Access (In)Equality Index (AEI) - Measuring (In)Equality of Access to Basic Opportunities Across India - Amazon AWS
←
→
Page content transcription
If your browser does not render page correctly, please read the page content below
Access (In)Equality Index (AEI)
Measuring (In)Equality of Access to Basic Opportunities Across India
AUTHORS OF THE REPORT
                                                     Deepanshu Mohan*
                                                        Latika Sharma**
                                                        Richa Sekhani**
                                                         Vanshika Mittal
                                                                   and
                                                           Advaita Singh

*Deepanshu Mohan is Associate Professor of Economics and Director, Centre for New Economics Studies (CNES), Jindal School of Liberal Arts
and Humanities, O.P. Jindal Global University. Richa Sekhani is a Research Associate at ICRIER and a Senior Research Analyst with CNES. Latika
Sharma works at KPMG (India) and was engaged as a Senior Research Analyst with CNES for this project. Advaita Singh and Vanshika Mittal
are students at Ashoka University and Senior Research Analysts with CNES.
** The views/opinions expressed by these authors are made in their personal capacities and do not in any way reflect the work or views of
their organisations of affiliation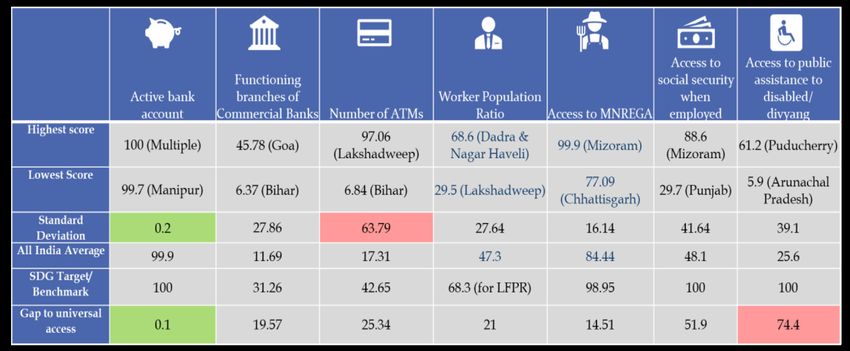
TABLE OF CONTENTS

Acknowledgement                                                        5

Executive Summary		                                                    6

1.    Background                                                       10

2.    About the Index                                                  11

2.1   Introduction                                                     11

2.2   Outlined Objective of Study                                      12

2.3   Salient Features                                                 12

2.4   Rationale                                                        15

2.5   Data Collection and Methodology                                  18

3.    Findings from the Index                                          20

3.1   Composite Index - Measuring “Equality of what?”                  20

3.2   Sub-Index Rankings                                               22

A)    Access to basic amenities                                        22

B)    Access to Health care                                            25

C)    Access to Education                                              29

D)    Access to socio-economic security                                33

E)    Access to Justice                                                34

4.    Equality of Whom?                                                38

4.1   By Area of Residence: Rural - Urban                              38

4.2   By Caste Groups: SC, ST, OBC                                     43

4.3   By Gender: Male - Female                                         45

5.    Impact of Covid                                                  48

6.    Limitations of the Data and Methodology                          50

7.    Conclusions and Way Forward                                      51

References                                                             53

Appendices                                                             55
ABBREVIATIONS

AEI       Access Equality Index
ANC       Antenatal Care
ANM       Auxiliary Nurse Midwives
ATM       Automated Teller Machine
BMI       Body Mass Index
ESI       Employees' State Insurance
GDP       Gross Domestic Product
GER       Gross Enrolment Ratio
GIS       Geographic Information System
GPI       Gender Parity Index
GSMA      The Global System of Mobile Association
HLRN      Housing And Land Rights Network
HOI       Human Opportunity Index
ICRIER    Indian Council For Research On International Economic Relations
IRDAI     Insurance Regulatory And Development Authority
LFPR      Labour Force Participation Rate
LHV       Lady Health Visitor
LPG       Liquefied Petroleum Gas
MGNREGA   Mahatma Gandhi National Rural Employment Guarantee Act
MoHFW     Ministry of Health And Family Welfare
NAR       Net Attendance Ratio
NCMH      National Commission On Macroeconomics And Health
NCW       National Commission For Women
NFHS      National Family Health Survey
NFSA      National Food Security Act
NSS       National Sample Survey
OBC       Other Backward Class
PDS       Public Distribution System
PLFS      Periodic Labour Force Survey
PMJDY     Pradhan Mantri Jan Dhan Yojana
PNG       Piped Natural Gas
PPE       Personal Protection Equipment
PTR       Pupil Teacher Ratio
PwD       Persons With Disabilities
RMNCHA    Reproductive, Maternal, Newborn, Child And Adolescent Health
RMSA      Rashtriya Madhyamik Shiksha Abhiyan
RTE       Right to Education
RT-PCR    Reverse Transcription Polymerase Chain Reaction
SC        Scheduled Caste
SDG       Sustainable Development Goal
ST        Scheduled Tribe
TCA       Technical Cooperation Agency
UDISE     Unified District Information System For Education
UN        United Nations
UT        Union Territory
WPR       Worker Population Ratio
ACKNOWLEDGEMENTS

 This study would not have been made possible without the invaluable contributions of many
 collaborators. We are highly grateful to Dr. Indranil Mukhopadhyay, Associate Professor at Jindal
 School of Government and Public Policy, O.P. Jindal Global University for providing his valuable inputs
 and guidance on the projects.

 We are also thankful to Professor Anamika Srivastava, Associate Professor at Jindal Global Law School
 and Assistant Director, Centre for Social and Education Policy, Jindal Global Law School and Dr. K.M.
 Parivelan, Associate Professor at School of Law, Rights and Constitutional Governance, and Chairperson
 of Centre for Statelessness and Refugee Studies, Tata Institute of Social Sciences (TISS) for providing
 their continuous inputs in building and selecting indicators for the index.

 We are grateful to Serene Vaid, Urban and Spatial Economy Specialist at UN-Habitat (United Nations
 Human Settlements Programme) and Dr. Siddhi Gyan Pandey, Assistant Professor of Economics, Jindal
 School of Liberal Arts and Humanities (JSLH), O.P. Jindal Global University for their guidance in designing
 the methodological framework of the index and helping the team in working towards it.

 We thank Ms. Rekha Pachauri, Assistant Professor, Bennett University for her review and assistance on
 edits. We also thank Mr. Shirish Sharma, Lecturer, Amity University for his kind assistance in designing
 this report.

 Finally, we are grateful to our research team at Center for New Economics Studies –Vanshika Mittal,
 Advaita Singh, Ada Nagar, Wynnona Fernandes and Krishanu Kashyap for their assistance on
 proofreading and editing.

 All errors remain our own.

Access (In)Equality Index (AEI)                                                                           5
EXECUTIVE
                                                                                                      SUMMARY

With the need for international comparisons becoming pressing, income inequality has risen to the
top of the development agenda across the globe. Most of the literature on inequality has focused on
inequality of outcomes such as income inequality or wealth inequality arising from various economic,
demographic and social processes which impact distribution of income. However, the discourse around
income inequality does not reflect (in)equality of opportunity (basic amenities, health care, education,
access to justice and socio-economic security) that arise because of the circumstances that are beyond
individual’s control including gender, family background, ethnicity, place of birth etc. These evidences
while informative are often criticized for not measuring inequalities that are more relevant from a social
or moral perspective (Lefranc. A et. al, 2007).
Inequality is a roadblock to progress and development as it deprives people of opportunity. The
international community through Sustainable Development Goals (SDGs) aims to “ensure that no one
is left behind”. One of the major factors behind India falling short of achieving these goals remains
underinvestment in human and social capital leading to uneven access to various opportunities such as
education, healthcare and other basic amenities. Thus, with goal of achieving equality in opportunities,
rather than outcomes, it becomes important to measure inequality from this perspective.
Moreover, global data shows that the Covid-19 pandemic has further widened the existing income
and wealth inequality significantly, both within and between countries (Goldin and Muggah (2020),
Ghatak (2020), UN reports). India, itself, produced 70 new millionaires every day between 2018 and
2021(Oxfam, 2021), while the number of people living in poverty increased by 75 million due to the
pandemic, accounting for nearly 60 percent of the global increase in poverty.
With pandemic not only contributing to inequality, but also the dynamics of public service delivery and
working of institutions, markets and governments, measuring inequality with a fresh perspective turns
out to be even more vital.
The concept of equality of opportunity is rooted in the Rawlsian philosophical tradition whereby, people
are expected to construct society in a way that they would be happy for their position in society to be
determined by a random draw (Rawls (1971) and Dworkin (1981). He argued that social positions should
be formally open to all and that each person should have a fair chance of attaining them. Over the years,
with the development of literature, there now exists multiple interpretations of inequality of opportunity
that arise because of factors or circumstances that are beyond an individual’s control. These include
accessibility and availability of basic resources (Dworkin, 1981), primary goods such as basic liberties and
rights, access to political and other offices (Rawls, 1971), public goods, quality of education or access to
labor market opportunities, gender, family background, ethnicity, place of birth etc.
Against this background, the objective of this report is to create an index to capture inequality among
households and individuals by looking at access to various opportunities (capabilities), thus measuring
uneven distribution of deprivations across the states and union territories in India. The definition of
“Access” in this report is conceptualized to encompass the “4As”, namely 1) Availability 2) Affordability
3) Approachability and 4) Appropriateness. These four dimensions of “Access” are not only critical in
addressing inequalities in accessing healthcare services but can be expanded to cover various other sectors
including basic amenities, education, justice and for addressing socio-economic inequalities.
The AEI framework illustrated in figure 1, therefore, measures five key pillars across 23 broad
categories1 crucial to social and human development, each of which relates to an important opportunity
for improving the overall quality of life and that has been found to be critical in reducing inequality. This
multidimensional framework serves as a benchmark in assessing inequity in spatial and non-spatial
access to social and economic opportunities across the states.

1
  These 23 broad categories have in total 58 indicators that are included in the creation of index.
# This report is currently in a working paper stage and any inputs/comments for incorporation can be shared at cnes@jgu.edu.in

6                                                                                            Access (In)Equality Index (AEI)
Figure 1: Access to Inequality Index – Framework

The composite index as can be seen in the table 1A and 1B below is created using equal weights or
a simple average aggregation technique where five of the sub-indices are given equal weight and all
variables within each sub-index are also assigned equal weight (=1). The final index value for each state/
UT is produced by taking the geometric mean of the five sub-indices. States and UTs are ranked on the
basis of the final aggregate score. To ensure comparability, all variables are normalized, the details of
which are provided in the report.
In order to ensure comparability across geographical size and governance, AEI 2021 scores and ranks states
and UTs separately. Based on the composite Index scores range (0.67-0.23), the states are grouped into three
categories: Aspirants, Achievers, and Front-runners (Table 1).
Front-runners are the states falling in the top one-third score range (score above 0.42) and are the best
performing States. The findings from the composite index indicate that twelve states are front runners.
Smaller states such as Goa, Sikkim, Himachal Pradesh and Punjab have the advantage of better coverage of
service geographically and demographically. There has been concerted focus by these state governments
in ensuring improvement of Human Development, and achieving SDGs, which has resulted in better
accessibility. Among larger states, Tamil Nadu, Kerala, Telangana, Karnataka, and Andhra Pradesh have
performed the best, and thus, provide better access to critical human development opportunities to its
citizens.

Access (In)Equality Index (AEI)                                                                          7

Achievers represent the States with an average Index score between .42 and .33. These States provide
good access to opportunities and can advance to the next group with sustained efforts. Aspirants are the
bottom States with an Index score below 0.33. The states with the least overall access to opportunities
are Bihar, Uttar Pradesh, Jharkhand, Assam, Odisha and Madhya Pradesh
Among UTs, Chandigarh and Puducherry are the best performers. The Index is also a tool for States and
                             Table 1A: Composite Index: Rankings of States

                 Rank                        States                      Composite index
                                      Front Runners (> 0.42)
                   1                            Goa                              0.67
                   2                          Sikkim                              0.6
                   3                        Tamil Nadu                           0.55
                   4                           Kerala                            0.53
                   5                      Himachal Pradesh                       0.52
                   6                         Telangana                           0.49
                   7                          Punjab                             0.48
                                             Mizoram                             0.46
                   8
                                             Karnataka                           0.46
                   10                      Andhra Pradesh                        0.45
                                             Nagaland                            0.43
                   11
                                              Haryana                            0.43
                                         Achievers (.33-.42)
                                           Maharashtra                           0.42
                   13
                                         Arunachal Pradesh                       0.42
                   15                         Gujarat                            0.41
                   16                      Uttarakhand                            0.4
                   17                      Chhattisgarh                          0.38
                   18                        Rajasthan                           0.37
                   19                         Tripura                            0.36
                   20                       West Bengal                          0.35
                                             Manipur                             0.33
                   21
                                            Meghalaya                            0.33
                                          Aspirants (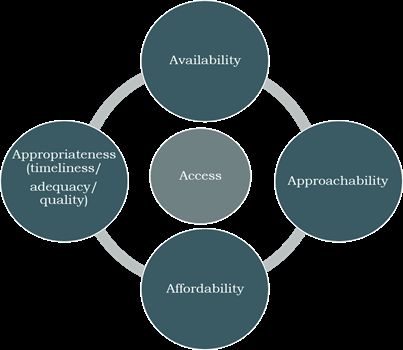
Table 1B: Composite Index: Rankings of UTs

         Rank                                UTs                                       Index Value
          1                              Chandigarh                                        0.55
          2                              Puducherry                                        0.52
          3                        Andaman & Nicobar Islands                               0.50
          4                                 Delhi                                          0.49
          5                           Jammu & Kashmir                                      0.42
          6                         Dadra and Nagar Haveli                                 0.38
          7                             Daman and Diu                                      0.37

UTs to identify problem areas and focus their interventions in these areas, given that the report presents
the sub-indices rankings as well.
In the absence of data at the state level, the report also comments on the inequalities spread across
region (urban, rural), caste, and gender for all India level. Spatial inequalities — where people reside
(urban or rural) — have an impact on access to opportunities, including access to basic amenities such
as safe drinking water, housing, clean energy, sanitation, health care, education, decent work and other
goals envisioned in the 2030 Agenda (SDGs).
The exclusions and discriminations meted out to various castes (Schedule Caste (SC), Schedule Tribe (ST) and
Other Backward Class (OBC)) in India also resulted in high incidences of poverty, deprivation, and low levels
of education & awareness, which has further hindered their access to opportunities. Further, the presence
of gender inequalities has limited the progress of women in India, depriving them of access to various
opportunities vital for their growth.
The twin approach of ranking Indian states and UTs, accompanied by explanations on the inequalities
across region, caste and gender in this report, presents both aggregated and disaggregated view of the
situation. This helps in identifying the challenges faced by individuals and households in accessing
various services across Indian states and UTs. There is a need for targeted policies and an action plan to
address the bottlenecks, given that the recent pandemic has exacerbated the pre-existing vulnerabilities
and deprivations, which is observed not only in the various outcomes matrix but also in accessing various
opportunities in the form of affordable, quality education, health care and basic infrastructure, which
remain unevenly spread both socially and geographically.
Addressing such inequality of access will remove institutional and structural “barriers” which creates
“exclusion” of various sections of populations from the development process. The findings from the
report calls for promoting equal access by extending coverage of the essential services to more people
— irrespective of their caste, gender, region — such that India can achieve inclusive growth in its truest
sense.

Access (In)Equality Index (AEI)                                                                           9
1. Background Significant deficits in the achievement of Sustainable Development Goals remain stagnant in developing countries, including India. One of the major factors behind this shortfall remains underinvestment in human and social capital leading to uneven access to various opportunities such as education, healthcare and other basic amenities. This negatively affects economic growth in the long term and traps the country on a path of increasing income and wealth inequality (Marrero and Rodríguez, 2013; Bradbury & Triest, 2016; Ferreira et al. 2014; OECD ). Goal 10 of the SDGs directly calls for a progressive reduction of income inequality while also ensuring access to equal opportunities, and promoting social, economic and political inclusion of all — irrespective of age, sex, disability, race, ethnicity, religion or any other social status. The SDGs target “leaving no one behind” through “universal access” to food, basic amenities such as sanitation, water, healthcare, education, decent work and other socio-economic opportunities. An assessment of the supply side imbalances in providing these “access” provisions thus becomes important (access to public infrastructure, public goods, service, or institution). In addition to this, the Covid-19 pandemic has led to contraction of India’s GDP by 7-8percent —the largest in the post-Independence period—and has worsened the existing income and wealth inequality significantly, both within and between countries. India produced 70 new millionaires every day between 2018 and 2021 while the number of people living in poverty increased by 75 million due to Covid-19, accounting for nearly 60 percent of the global increase in poverty . This adds to the motivation behind relooking at the measurement of inequality through creation of an index encapsulating new dynamisms in global inequality debate. This report—through the AEI framework—holds merit in examining how far Indian states and UTs are from providing universal access to essential goods and services to all. Location/geographical distribution or spatial concentration of opportunities matter in achieving equality. There is evidence which proves that young children (below age 13) who move to lower-poverty areas with better access to opportunities are more likely to attend college and have substantially higher incomes as adults (Chetty, R. et al. 2016), thus, attaining better standards of living. Various inequalities of opportunities arising due to uneven distribution of basic amenities and infrastructure across space scales are often mutually reinforced, creating a vicious trap for households and communities. These circumstances make it particularly hard for them to improve their living standards. Thus, this report aims to highlight the inequalities in opportunities, wherein the problems to which they give rise have a spatial dimension that policy makers cannot afford to ignore. In the recent years, globalization and digitalization have been transforming the way economies work, providing new opportunities for growth, but also deepening inequalities7. Accelerated use of digital technologies, and automated decision-making tools for basic services such as health and education, seem to have made access more inequitable in an already unequal society, thereby, hindering people from receiving services they are entitled to8. The pandemic in past as well as now has acted as a source of creative destruction (Schumpeter, 1942) and has changed the well-established dynamics of governance, public service delivery, and economic and social mobility, altering the definition of “accessibility”. 2 IMF and recent national estimates 3 Goldin and Muggah (2020), Ghatak (2020), UN reports 4 India Extreme Equality in Number, Oxfam. 5 Pew Research Center, 2021 6 All On Board Making Inclusive Growth Happen, OECD 7 OECD (2020), “Enhancing Equal Access to Opportunities for All”, OECD Publishing, Paris 8 Virginia Eubank’s - Automating Inequality 10 Access (In)Equality Index (AEI)
This necessitates renewed measurement of inequalities incorporate this dynamism. Thus, along with
the physical aspect or the spatial distribution of opportunities, the report tries to capture other nuances
of “access” which have been defined in the next section.
2.          About the Index
            2.1. Introduction
The empirical literature about ‘equality of what’ and views of justice consistent with equality of opportunity
involves contributions from many key economists and philosophers, beginning with John Rawls (1958,
1971), Amartya Sen (1980), Ronald Dworkin (1981a, 1981b), Richard Arneson (1989), G.A. Cohen (1989),
John Roemer (1993, 1998), Fleurbaey (2008), Walter Bossert (1995, 1997), Vito Peragine (2004), Dirk Van
de Gaer (1993) and Nussbaum (2011) along with many others. Appendix 1 provides a synopsis of the vast
literature on the subject.
The majority of discourse on inequality has been centered around economic inequality, particularly income
or wealth inequality, thus focusing on inequality of outcome (Fields and Fei, 1978; Atkinson, 1970; Deaton,
2013,2021; Milanovic. 2016; Niño-Zarazña, etal. 2017; Goldin and Muggah, 2020; Chateauneuf and Moyes,
2005). There are multiple indices and ratios which have been adopted globally to measure inequality,
particularly income inequality, due to availability of income datasets (Lorenz, Gini coefficient, decile ratios,
Atkinson’s index, Theil’s index).
However, inequality goes beyond income and affects opportunities and capabilities for large parts of
society (Roemer, 1998, 2013; Bourguignon, Ferreira, and Walton, 2007; Elbers et al., 2008; Cohen, 1989;
Arneson, 1989). Wealth, income and consumption are generally considered economic outcomes and
indicators such as health status (mortality rates, life expectancy), literacy rates define social outcomes.
These outcomes are the “ends” which have been the result of various “means” or processes which relate
to access to basic opportunities such as water, education, electricity, sanitation, etc. The goal (in terms
of inequality) should be to equalize the opportunities people have, and not the outcomes people obtain
(Drèze and Sen, 2013). Sen defines “capabilities” as freedom or real opportunities one has regarding the
life one may lead. Instead of focusing exclusively on economic means or subjective well-being, capability
approach focuses on people’s capabilities to live the kind of life they have reason to value (Sen, 1979;
1985; 1987; 1992; 1993; 1999; Nussbaum, 2011).
This report draws on the concept of “opportunities” and “capabilities” in order to assess the uneven
distribution of deprivations across the country. As the concept of “opportunities” and “capabilities” is too
broad and is subject to much wider deliberations, this report will restrict itself to looking at opportunities
(capabilities) through the lens of “access”. The link between equality and access to opportunities is
important in its own right because (i) access to opportunities acts as a social and personal determinant
of aspirations of people, which impacts their investments in human capital for themselves and their
children, which will then affect actual mobility and human capital development (Genicot and Ray, 2016;
Cojocaru 2019); and because (ii) unequal access to opportunities is associated not only with lower
intragenerational mobility, but also intergenerational mobility and stronger redistributive preferences
impacting policy decisions (Cojocaru 2019; IMF, 20209; OECD, 2017).
Generally, one-dimensional, income-based measurements do not reflect (in)equality of opportunity that
arise because of the factors or circumstances that are beyond an individual’s control and for which they

9
    IMF’s “Enhancing Access to Opportunities” - https://www.imf.org/external/np/g20/pdf/2020/061120.pdf

Access (In)Equality Index (AEI)                                                                              11
cannot be held responsible. These factors include accessibility and availability of basic resources (Dworkin,
1981), primary goods such as basic liberties and rights, access to political and other offices (Rawls, 1971),
public goods, quality of education or access to labor market opportunities, gender, family background,
ethnicity, place of birth etc. It usually includes non-income dimensions such as health, education, access
to basic services and human development measured primarily through intergenerational social mobility10.
The motivation behind this index is analogous to that of the Human Opportunity Index (HOI) of Barros
et al. (2009, 2011) which measures the extent to which households have access to “basic opportunities”
across various states/UTs. HOI is a synthetic measure of how far a society is from universal access to
an essential good or service, and how equitably access is distributed across individuals (circumstance
groups). It defines “opportunity” itself as “Access to a good or service, which society accepts should be
universal”.
There is a large body of work on inequality in India, to state some - Banerjee and Piketty (2001);
Deaton and Dreze (2002); Sen and Himanshu (2005), Pal and Ghosh (2007). These works present
robust evidence on the existence of inequality in India, but they mostly focus on measuring inequality
in consumption or income. These also present important factors behind the growing inequality and
contribute immensely to enrichment of poverty and inequality estimation in India. The AEI report builds
on these evidences indicating the persistence of ‘relative’ poverty and inequality in India and attempts
to perform an in-depth assessment of each Indian state’s performance in terms of provision of access to
various opportunities to its citizens towards the maximization of the well-being and reduction of income
inequality and poverty of the citizens.
2.2. Outlined Objectives of the Study
Recent analysis of global income inequality trends underlines the importance of being clear about how inequality
is understood and measured. Inequality of what (means versus end, opportunity versus outcome), inequality
among whom and at what level (between countries, regions, castes, gender, etc.) is determined by the definition
of inequality. Thus, the report aims at the following:
a) To develop a multidimensional Index to capture (In)equality of what or (In)equality in access
to key opportunities including individual/household access to public infrastructure, resources and
public service delivery indicators and generate scores and rankings for all States and UTs based on
pillar wise performance and overall performance.
b) To look at inequality of whom or horizontal inequality - inequality between groups of individuals
or households classified according to gender, caste and region.
c) This report also comments on the impact of the pandemic on rising inequalities in India.
2.3. Salient Features
1. The AEI Index measures 5 key pillars crucial to social and human development, each of which
relates to an important opportunity for overall quality of life and has been found to be critical in
reducing inequality. These are: basic amenities, healthcare, education, social and economic security
and justice. The index measures the set of opportunities represented by these pillars. The report, thus,
Francisco Perez-Arce, Ernesto F. L. Amaral, Haijing Huang, Carter C. Price (2016); Andrews and Leigh (2009), Corak, M. (2013), Ber-
10
man, Y. (2016).
12 Access (In)Equality Index (AEI)provides a multidimensional framework to construct an “Access to (In)Equality Index” which would
serve as a benchmark in assessing inequity and spatial access to social and economic opportunities
across the states by the means of ranking. The five pillars include 23 broad categories as depicted
in figure 2.1 below. These 23 broad categories have in total 58 indicators that are included in the
creation of index. The details of the indicators are provided in appendix 2 .
Figure 2.1: Access to Inequality Index – Framework
2. The definition of ‘Access’ in this report is derived from the theory developed by Penchansky
and Thomas (1981) and others (Levesque et al. 2013; Haddad & Mohindra, 2002; Peters et al.
2008; Di McIntyre et al.) in healthcare policy literature. Though “Access” in general means a way
of approaching, reaching or entering a place, as the right or opportunity to reach, use or visit11,
it is here broadly conceptualized to encompass the “4As” as provided in figure 2.2 below. These
four dimensions of “Access” are not only critical in addressing inequalities in accessing healthcare
services but can be expanded to cover various other sectors including basic amenities, education,
justice and for addressing socio-economic inequalities.
11 Oxford Dictionary
Access (In)Equality Index (AEI) 13Figure 2.2: What do we mean by “Access”?
Source : Developed by authors on the basis of literature review
a. Availability: This measures physical access or in other words, presence, demographic coverage,
and volume of service or institutions or opportunities available to the population (household and
individuals).
b. Approachability: This measures geographical access or in other words, the ability of
households/individuals to access the services.12
c. Affordability: This measures financial access, or in other words the relationship between the
prices of the services and providers to the household’s or individuals’ income and their ability to pay
for accessing the services.
d. Appropriateness: This measures the adequacy of the services by assessing the balance
between the need and service provision in terms of content, effectiveness, timeliness and quality.
3. To assess the 4As, we primarily look at the household level data or access granted to individuals
across states and UTs collected from various national sources as provided in appendix 2. The data for
some of the indicators is as old as 2016. However, for most of the indicators we have tried to capture the
latest possible data available. We have also tried to map and cover the four dimensions of “Access” across
all the indicators to the extent possible.
12
So far, India lacked valuable data on the location of various public facilities, but GIS – based planning has been received a much-await-
ed push in recent pandemic times. But even today mapping the location of essential infrastructure to assess the actual accessibility and
conduct an advanced spatial analysis on various social outcomes is not possible.
14 Access (In)Equality Index (AEI)4. The report presents the findings from the Composite index for states and UTs and also provides
pillar wise rankings for states and UTs.
5. The report provides brief commentary on:
a) Gender disparities in accessing the opportunities in terms of basic amenities, health, education,
socio-economic security and justice.
b) Disparities across various socio-ethnic groups in accessing various opportunities at an all-India
level.
c) Rural-urban gaps in accessing basic services and opportunities.
2.4. Rationale
Each pillar has been selected on the basis that disparities in each—access to health, education, basic
services, social-economic security and justice—are markers of inequality of opportunity and are
associated with deprivation of multiple ‘means’ essential for well-being (as summarized in table 2.1).
Uneven access to these services constrains human capabilities, the quality of human capital, impact life-
time income and restrict intergenerational mobility.
It should be the priority of the Government to provide people with basic infrastructure, education,
health and socio-economic security. However, not all citizens can avail of these opportunities equally
due to various circumstances. For example, many children in India are unable to attend school due to
their inability to travel kilometers on foot daily; many girls drop out due to no access to clean water and
sanitary toilets in the school.
Each indicator tries to capture such crucial circumstances or socioeconomic and demographic
characteristics outside the individual’s control, related to the four dimensions of ‘access’ defined in this
report.
Table 2.1: Rationale for the Pillars
S.no. Rationale
1. Universal access to basic amenities and public infrastructure such as drinking water, sanita-
tion, electricity, decent housing, food and nutrition is imperative to ensure a decent quality of
life, healthier lives, improved job opportunities and subsequently, higher economic growth.
• Access to piped water and sanitation is critical in reducing the child mortality substan-
tially (Zwane et.al., 2007). The distance and time spent fetching water from the source
significantly affects the health of children under five (Pickering and Davis, 2012; Zayatri
et. al., 2013) and increase the risk of illness (Xia and Hunter, 2010). Close to 54 percent of
rural women—as well as some adolescent girls—spend an estimated 35 minutes fetch-
ing water every day, equivalent to the loss of 27 days’ wages over a year.13
13
Analysis of the situation of children, adolescents and Women in India 2016
Access (In)Equality Index (AEI) 15• Access to good-quality affordable housing is important for achieving a number of social
policy objectives, including poverty reduction, equality of opportunity and social inclu-
sion.14
• Increasingly, access to mobile and internet has also become fundamental as a means for
inclusive growth and act as a node for access to information and diversifying livelihood
opportunities.
• Access to clean cooking energy has the transformative potential to curb the health risks
posed by traditional cookstoves while also reducing the time spent by women on unpaid
domestic work.
• One of the key channels of food security in India is the distribution of food grains through
the government controlled Public Distribution System (PDS).15
2. Health and human capital are strongly related and better health early on is a determinant
for future outcomes.16 Universal access to healthcare is instrumental to achieving equality
of opportunities. Monitoring Universal Health Coverage requires measuring health service
coverage and financial protection (SDG 3).
• According to a study, increasing the density of health facilities and providers in rural
areas may improve maternal and neonatal care.17 Proximity and access to health care are
important determinants of health outcomes.
• Due to lack of GIS–based data on location of healthcare infrastructure, the study aims
to use other indicators available such as availability of beds, doctors, nurses/ANMs etc.
While urban populations have access to private health care networks, rural populations
rely heavily on the public health system, thus require special attention.
• Moreover, COVID-19 has not been an equal opportunity virus, it disproportionately
affects the poor and the least developed economies with poorer health conditions, health
systems that are less prepared to deal with the pandemic, and people living in conditions
that make them more vulnerable to contagion.18 Thus, looking at accessibility of health-
care services, the public health system becomes indispensable.
• The study also looks at public spending on health which is crucial as it is an important
means itself to achieve universal healthcare.
3. Education is fundamental to human and social progress, developing an equitable and just
society, and promoting national development. India aims to achieve Goal 4 of SDG which is
to “ensure inclusive and equitable quality education and promote lifelong learning opportu-
nities for all” by 2030. The broader objective of the education and skill-related interventions
is to reduce the inequality of opportunities among the population so that in the medium and
long run, the inequality of outcomes will be eliminated.19
14
OECD, 2017, https://www.oecd.org/inclusive-growth/inequality-and-opportunity/The-Issues-Note-Social-Mobility-and-Equal-Opportuni-
ties-May-4-2017.pdf
15
DFPD Targeted Public Distribution System.; Available online: http://dfpd.nic.in/public-distribution.htm.
16
Francisco Perez-Arce, Ernesto F. L. Amaral, Haijing Crystal Huang, Carter C. Price
17
Kumar.S, Dansereau.E &. Murray.C. 2014. “Does distance matter for institutional delivery in rural India?”, Applied Economics, 46:33, 4091-4103
18
Stilgtilz (2020)
19
India SDG report 2019-20
16 Access (In)Equality Index (AEI)The report takes into account specifically Secondary education, as India has achieved con-
siderable success in ensuring universal access to elementary education with RTE Act imple-
mentation in the past few years and hence, focus now should move to universal secondary
education as the basic necessity.
• While distance to school is an important factor and captures geographical access, the
report adopts an expanded view of education access to go beyond the indicators of en-
rollment and include the dropout rate and actual attendance, since these reflect various
socio-economic reasons acting as hindrances to access to schooling indirectly. “Increasing
attendance cannot be an end in itself. Rather, it should be a means to improving learning
outcomes and the employability and competence of the workforce”.20
• The appropriateness of education at secondary level depends on various factors such as
pupil-teacher ratio and teaching of vocational courses etc.
• The study looks at how much a state spends per child (population aged 13-15) for sec-
ondary education, as it denotes the inputs or means to ensure universal access to quality
and affordable education.
• The study also looks at computer and internet access in schools to capture availability of
school level infrastructure for digital education
4. Equal access to and control over economic and financial resources is critical for the achieve-
ment of equitable and sustainable economic growth and development. It has positive multi-
plier effects for a range of key development goals, including poverty reduction and increased
welfare at both the household and macro level.
• According to Dreze and Sen (1995), “Social security is an essential requirement of social
justice”. Social security is a set of means that influences human development by address-
ing deprivation and improving living standards and access to entitlements21.
• Financial inclusion and access to better financial infrastructure acts as stepping stones
for better economic stability.
• The International Labour Organisation describes three decent work dimensions: ‘em-
ployment opportunity’, ‘social security benefits’ and ‘social dialogue’. The report captures
the first two for access to decent work.
• Access to work has been captured through Worker Population Ratio (WPR) as it provides
information on actual workers/employed population against Labour Force Participation
Rate (LFPR), which provides information on available labour supply. MGNREGA has been
a crucial source of providing Social Protection and Economic Empowerment to rural
unskilled youth, and thus has been considered to measure access to decent work in rural
areas.
5. Access to opportunities to live in a safe environment with a fair legal support system is
essential not only for human development at an individual level, but for the economic and so-
cial development of the country as a whole. Heterogeneity and a complex hierarchical social
structure in India make the right to justice an even more vital factor for achieving equality.22
20
Special Focus: Inequality In Emerging Economies (Ees), OECD, 2011
21
Tamil Nadu Human Development Report
22
In the absence of data on affordability, the indicators used in this pillar measures availability, approachability and appropriateness in
the justice system in India
Access (In)Equality Index (AEI) 17• An effectively functioning justice system comprises of four major pillars — Police, Ju-
diciary, Prisons & Legal Aid. Strengthening state capacities in all these areas requires
urgent attention to provide its people with the best possible justice delivery.
• Despite the progressive measures, the ‘access to justice’ in India has been costly and be-
yond the reach of poor citizens, worsened by the delays in disposal of cases and arrears
in the system.
• In the recent years, the government has introduced a slew of measures to improve access
to justice and justice delivery like Services provided by state's citizen portals, which in
light of the recent pandemic, have also received a major thrust.
• Judiciary remains one of the least diverse areas especially for representation of women
and looking the inequality within is important to bring out the difference in the same
across states.
2.5 Data Collection and Methodology
The indicators included in all the pillars have gone through several omission and commissions based
on the availability of data across the states and UTs. The choice of indicators is also based on the 4As of
the ‘Access’ identified in the report and is accounted for across all the indicators to the extent possible.
Indicators have been selected on the basis of their importance and availability of reliable data from
existing data sources such as National Family Health survey (NFHS), National Sample Survey (NSS)
reports, India Sustainable Development Goals (SDG) Reports, Ministry of Health and Family Welfare
(MoHFW), Ministry of Rural Development (MoRD), etc. We have tried to create the index as per the
latest data available. The five pillars include a total of 58 indicators. Across 58 indicators, the data is
available for all the states. However less data is available for the UTs.
For better representation, we have ranked states and UTs separately. The ranking of UTs across all the
pillars and the composite ranking is based on fewer indicators for which the data was available.
Building the Composite Index and Method of Aggregation
The index is constructed through successive aggregation of scores. Scores for individual indicators
are aggregated to create the five sub-indices: access to basic amenities, access to health care, access to
education, access to socio-economic security and access to justice. The sub-indices are further aggregated
to arrive at the final composite index score. States and UTs are ranked on the basis of the final aggregate
score. To ensure comparability, all variables are normalized (See Appendix 2 for more details).
The index is created using equal weights or a simple average aggregation technique where five the sub-
indices are given equal weight and all variables within each sub-index are also assigned equal weight
(=1). This method of aggregation is used when there is limited or no information to judge whether some
variables in the index are more important than others or when all variables are considered equally
important.
18 Access (In)Equality Index (AEI)There are two steps to calculating AEI values .
The first step involves calculating indicator value:
Minimum and maximum values (goalposts) are set in order to transform the indicators expressed in
different units into indices between 0 and 1. These goalposts act as “the natural zeros” and “aspirational
targets”, respectively, from which component indicators are standardize.
Having defined the minimum and maximum values, the variables are normalized using the following formula
The basic formula for converting an indicator value (V) into an index score (I) is:
V-minimum value
I= **
maximum value-minimum value
where minimum value is the minimum admissible value (lower bound) and, maximum value is the
maximum admissible value (upper bound)
In a few cases, indicator and criteria point in opposite directions. In these cases, the following alternative
formula is used. For instance, in case of availability of judge per 1000 population. The lower the population
load on a high court the better the states ranking are. In such cases, the formula presented below is used .
maximum value-V
I*=
maximum value-minimum value
Again, actual indicator values are replaced with lower or upper bounds, if necessary.
The equation 1 is first applied to each of the indicators of the pillars, and then the arithmetic means of the
indicators resulting indices is taken. For instance, to arrive at the sub-index value for basic amenities, we
have first normalized all the 10 indicators ( see appendix 1 for information on the indicators) using equation
1 and then used arithmetic mean to arrive at the basic amenities sub- index. We use same methodology for
all the other four pillars including education, health, social security and justice.
The second step involves developing composite index
This is produced by taking the geometric mean of the five sub-indices .
AEI = (IBasic amenities * IHealth * IEducation * ISocial Security *Ijustice)1/5
The use of geometric mean reduces the level of substitutability between the sub-indices and smoothens the
intrinsic differences across them and is most suitable for this index . Additive aggregation methods imply full
compensability across variables. For example, if the score for the two sub-indices is 5 and 10 respectively, the
arithmetic mean would give a composite score of 7.5 while the geometric mean would give a score of 7.07.
The advantage of using the geometric mean24 is that it implies only partial compensability, i.e., poor
performance in one sub-index cannot be fully compensated by good performance in another (In this case
5 for the poor performing sub-index and 10 for the good performing sub-index). Second, it balances the
uneven performance between dimensions. Third, it encourages improvements in the weak dimensions,
i.e., the lower the performance in a particular sub–index, the more urgent it becomes to improve that
particular dimension25. In case of aggregation within the sub-index, the variables are much more
homogenous and therefore allowances can be made for partial substitutability. Using the arithmetic
** https://ec.europa.eu/jrc/en/coin/10-step-guide/step-7
23 https://ec.europa.eu/jrc/en/coin/10-step-guide/step-7
24 Formula for the geometric mean Sl= j √∏ajk. If value of any sub-index is zero (0), one is added to in the set to avoid the prod-
uct from becoming zero and later one is subtracted from the result for geometric mean calculation.
25 Stan. P (2014) 12th JRC Annual Training on Composite Indicators & Multicriteria Decision Analysis (COIN 2014. https://ec.europa.
eu/jrc/sites/jrcsh/files/20140922_JRC_COIN_11_Aggregationpercent28Ipercent29.pdf
Access (In)Equality Index (AEI) 19mean for aggregating within a sub-index does not run the risk of overcompensating a bad performing
parameter by a good performing parameter. There are several other methods of aggregation such as
the harmonic mean, penalty for bottleneck, summation of ranks, etc. which are more suited to other
contexts and can sometimes be overly complex. The Human Development Index and the Sustainable
Society Index are some popular examples that use the geometric mean for aggregation.
3. Findings from the Index
3.1 Composite Index – Measuring “Equality of what?”
Based on the composite Index scores range (0.67-0.23), the states are grouped into three categories:
Aspirants, Achievers, and Front-runners (Table 3.1A). Aspirants are the bottom states with an Index score
below 0.33. The states with the least overall access to opportunities are Bihar, Uttar Pradesh, Jharkhand,
Assam, Odisha and Madhya Pradesh. These states require concerted efforts to improve “access” to basic
amenities, education, health, justice and socio-economic security. Jharkhand, especially, requires a lot of
effort across all pillar, as it appears in the bottom five of all the pillars.
Achievers represent the States with an average Index score between .42 and .33. Overall, these states
have good provisions of ‘access’ and can advance to the next group with sustained efforts.
Front-runners, the states falling in the top one-third score range (score above 0.42), are the best
performing states. Smaller states have the advantage of better coverage of service geographically and
demographically but concerted focus by the state governments in ensuring improvement of Human
Development and achieving SDGs has resulted in the best access on an average in Goa, Sikkim, Himachal
Pradesh and Punjab. Goa ranks first in access to basic amenities, health and socio-economic security
and second in access to secondary education. The only pillar where it does not secure a place in top 5
is access to Justice. Among larger states, Tamil Nadu, Kerala, Telangana, Karnataka and Andhra Pradesh
have performed the best and thus, provide better access to critical human development opportunities
to its citizens.
Table 3.1A: Composite Index: Ranking of States
Rank States Composite index
Front Runners (> 0.42)
1 Goa 0.67
2 Sikkim 0.6
3 Tamil Nadu 0.55
4 Kerala 0.53
5 Himachal Pradesh 0.52
6 Telangana 0.49
7 Punjab 0.48
Mizoram 0.46
8
Karnataka 0.46
20 Access (In)Equality Index (AEI)Rank States Composite index
10 Andhra Pradesh 0.45
Nagaland 0.43
11
Haryana 0.43
Achievers (.33-.42)
Maharashtra 0.42
13
Arunachal Pradesh 0.42
15 Gujarat 0.41
16 Uttarakhand 0.4
17 Chhattisgarh 0.38
18 Rajasthan 0.37
19 Tripura 0.36
20 West Bengal 0.35
Manipur 0.33
21
Meghalaya 0.33
Aspirants (Looking at the range of the score of composite indices, it can be inferred that a huge inequality exists among
states in terms of access as can be seen in table 3.2 below. Highest inequality persists in basic amenities
followed by justice, healthcare and socio-economic security. Least variations exist in access to secondary
school education among states and UTs.
Table 3.2: Standard Deviation – Variation Across the Indicators
Education Basic amenities Health justice Socioeconomic Index
security
Highest
0.47 0.94 0.87 0.75 0.77 0.67
score
Lowest
0.13 0.20 0.28 0.14 0.24 0.23
Score
Standard
0.08 0.19 0.15 0.10 0.12
Deviation
3.2. Sub-Index Rankings
While overall rankings are important for general perspectives, the sub-indices provide clear evidence on
policy direction for the future. Rankings at the sub-index level highlight specific areas of improvement
that can be achieved through policy formulation.
A) Access to basic amenities
As seen in figure 3.2 A, Goa followed by Punjab, Kerala, Sikkim, Haryana, Mizoram, Gujarat, Maharashtra
and Telangana are front runners (index value is >0.71) owing to the fact that the basic amenities in terms of
drinking water, sanitation, housing, clean energy, nutrition and digital access out-par other states in India.
Goa’s high score is driven by a high score across access to drinking water, functional toilets, good quality
housing, clean fuel, food through PDS and the internet. The index values for achievers lie between 0.52-
0.71. On the other hand, Aspirants including Jharkhand, Odisha, Tripura, Uttar Pradesh, Madhya Pradesh,
Chhattisgarh, Bihar, West Bengal, Meghalaya and Mizoram have underperformed.
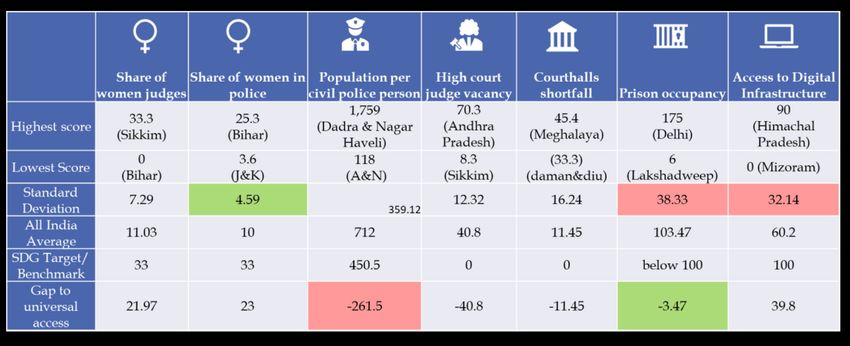
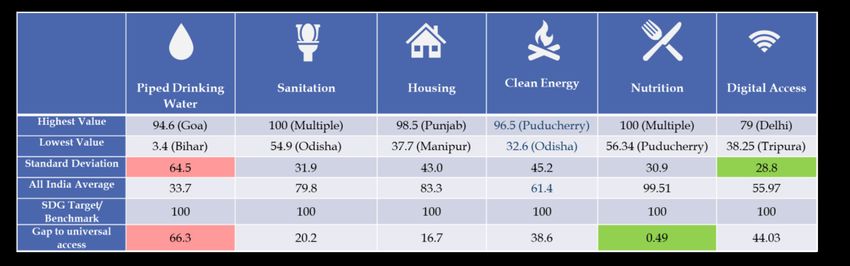
Table 3.2 A: Inequality of What among Basic Amenities
Among basic amenities, highest inequality is seen in access to drinking water whereas, access to digital
means (mobile & internet) & nutrition among states has least variations. Access to piped drinking water
is the farthest from universal access SDG target, whereas, access to food/nutrition through NFSA/PDS is
closest to the target.
22 Access (In)Equality Index (AEI)Figure 3.2 A: Access to Basic Amenities : Ranking for States – sub index scores
Figure 3.2 B : Access to Basic Amenities : Ranking for Union Territories ( UTs)
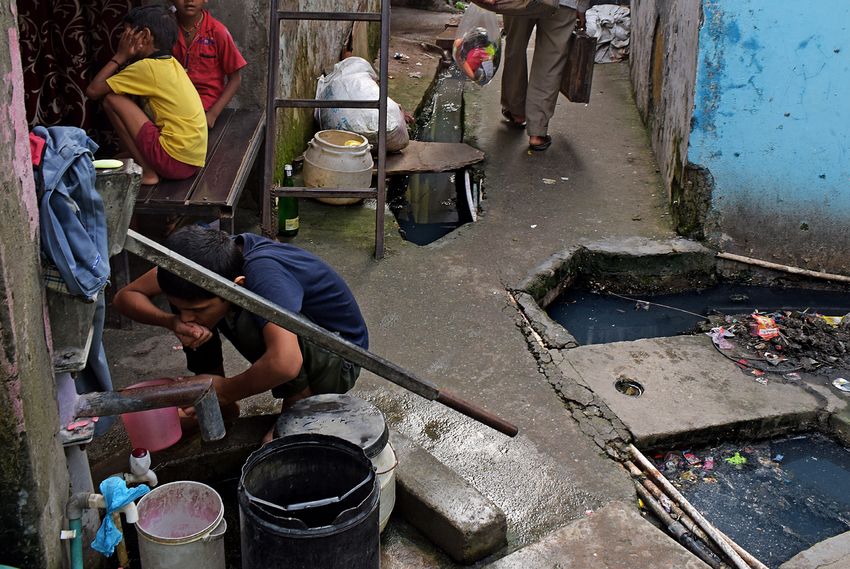
Access (In)Equality Index (AEI) 23Drinking Water: Piped drinking water being available to the households is one of the critical components for achieving universal access to safe drinking water in the country. Approximately 95 percent of the households in Goa and 86 percent of the households in Sikkim have access to Piped Water Supply as principal source of drinking water within their premises, with all India average being 33.7 percent. The distance travelled to access the principal source of drinking water measures the quantity and quality of water used by the households. Off-premises improved water sources located within 30 minutes of the point of use are considered a basic service. If the source is located above 30 minutes from the source, level of service is classified as limited (WHO & UNICEF 2017). The relation between the quantity of water used by the household and the time taken to fetch it can be qualitatively described as non-linear with a steep decline (at roughly 3 minutes of collection time) in water used once the source is not on the premise. While only 65.9 percent of the households in Indian states have access to water within the premise, more than 80 percent of households in Goa, Punjab, Haryana, Kerala and Sikkim have to travel less to access drinking water. Sanitation: Access to toilets and availability of water in the toilets has been the agenda of the national sanitation program “Swachh Bharat Mission” launched in 2014. The inadequate access to toilets has caused India an economic loss of USD 53.8 billion - equivalent to 6.4 percent of the GDP26 as a result of health-related impacts including premature deaths, the cost of treating disease and productive time lost due to illness. Other causes include the impact of women not going to work due to related illnesses and of girls missing school. The findings from the index suggest that 100 percent of the households in Sikkim, Manipur, Mizoram, Nagaland, Chandigarh and Lakshadweep have access to toilets aso the final line becomes - The findings from the index suggest that 100 percent of the households households in Sikkim, Manipur, Mizoram, Nagaland, Chandigarh and Lakshadweep. Sikkim have access to latrines/toilets.. Housing: Good quality, secure housing is one of the major end goals for many societies aiming to ease global poverty and ensure the provision of basic amenities for economically backward groups. Over the years, several governments, both state and central, have introduced various housing schemes in India. The Indira Awas Yojana which began in 1996 was one of the first major housing schemes with large- scale goals. Renamed the Pradhan Mantri Awas Yojana Gramin, the scheme now works on the objective of housing for all by 2022. Until now, about 83.3 percent of all households in India have access to a pucca house. On an average 95 percent of the top five front runner states have access to a pucca house, but the access to good condition houses in these five states is also abysmally low at 59 percent, though above the national average of 46 percent. Clean Energy: For over three decades, successive central and state governments in India have made efforts to increase the penetration of clean cooking energy solutions like liquefied petroleum gas (LPG), improved biomass cookstoves (ICS), biogas plants and piped natural gas (PNG), among others. However, only 63 percent of the households in Indian states have access to clean fuel in India. Nutrition: The index reveals that about 100 percent of the households in Kerala, Sikkim, Goa, West Bengal, Rajasthan, Manipur, Maharashtra, Gujarat, Himachal Pradesh, Arunachal Pradesh and Andhra Pradesh have access to food through PDS, while the state’s average being 98 percent. 26 Jamal. N, Chopra. T and Robert. K (2019). India’s building more toilets, but what happens ‘after the flush’?, World Economic Forum. https://www.weforum.org/agenda/2019/01/indias-building-more-toilets-but-what-happens-after-the-flush/ 24 Access (In)Equality Index (AEI)
Despite having the access, 189.2 million people are undernourished in India and about 51.4percent
of women in reproductive age between 15 to 49 years are anaemic27. Even, the Global Hunger Index
2019 ranked India at 102 out of 117 countries on the basis of three leading indicators—prevalence of
wasting and stunting in children under 5 years, under 5 child mortality rates, and the proportion of
undernourished in the population28.
Digital Access: Measured by the number of internet users29 and mobile users30 in the country, digital
access can also be considered one of the basic amenities, especially in light of the covid-19 pandemic.
Based on the survey conducted by IMRB in 2019, we find that on an average only 41 percent of the
individuals in the Indian states are internet users, while 66 percent of the individuals are the main users
of at least one mobile phone. The internet users in Goa, Punjab, Kerala, Sikkim and Haryana make up
59percent, 56percent, 59percent, 38percent and 51percent of the population respectively. While the
average amount of mobile users in the top five states is 68 percent of the population.
Jharkhand, Odisha, Tripura, Uttar Pradesh and Madhya Pradesh are the aspirants. Only 9 percent of the
households in Jharkhand and 11.4 percent of the households in Odisha have access to drinking water.
The access to water in latrines in these five states is below the average of all the states. Less than 30
percent of the households in these five states have access to “good condition” housing and on an average
only 41 percent have access to clean fuel in these five laggard states.
In terms of UTs (see figure 3.2 B), Chandigarh, Delhi and Puducherry are top performers. Performance
of Chandigarh across all the indicators is extraordinary Approximately 98 percent of the household
has water supply within the premise. 100 percent of the household in Chandigarh has access to both
latrines and water in latrines. Access to sanitation, housing and nutrition in Delhi is also striking. Also,
the internet and mobile users in Puducherry and Delhi is relatively high.
          B)        Access to Health care
The pillar captures various indicators that play an important role in accessing health care services
in Indian states and UTs. The frontrunners (index value ≥0.57) are Goa, Tamil Nadu, Sikkim, Kerala,
Himachal Pradesh, Mizoram, Andhra Pradesh, Punjab, and Karnataka. Nagaland, Assam, Jharkhand,
Bihar and UP are some of the aspirants’ states as can be seen in figure 3.3A.

27
   The State of Food Security and Nutrition in the World, 2020
28
   The Global Hunger Index 2019
29
   Any individual who has accessed internet in last 3 months using any device
30
   Any individual who is the main user of at least one mobile phone

Access (In)Equality Index (AEI)                                                                          25
You can also read