ACCOUNTABILITY PLAN AND REPORT
←
→
Page content transcription
If your browser does not render page correctly, please read the page content below

OKANAGAN COLLEGE

ACCOUNTABILITY
PLAN AND REPORT
                      2018-19 to 2021-22

                     >
Okanagan College
                                                                                                                            2018-19 – 2021-22
 Map?                                                                                                            Accountability Plan and Report

                                                                                             Indicates Okanagan College campus

                                                                                             Indicates Okanagan College Learning Centre

                                                              REVELSTOKE             TO
                                                                                   CALGARY

                                 TO
                              VANCOUVER
                                                               SALMON ARM

                                                                                TO
                                                                             KOOTENAYS
                               VERNON

                             TO                         KELOWNA
                          VANCOUVER

                         SUMMERLAND

             PRINCETON
                                                  PENTICTON
            TO
         VANCOUVER

                                                 OLIVER
                          KEREMEOS                                  TO
                                                  OSOYOOS        KOOTENAYS

                                              TO
                                      WASHINGTON STATE, USA

Page 2
Okanagan College
                                                                                                           2018-19 – 2021-22
 Letter from the Board Chair and the President                                                  Accountability Plan and Report

 Dear Minister Mark,

 At a point when British Columbia is facing a growing skills shortage, we hope you find it reassuring that Okanagan
 College continues to enrol an increasing number of students. This past fiscal year, Okanagan College’s full-time
 equivalent (FTE) student count grew to 9,244, an increase of 5.7 per cent over the previous year.

 Construction continues on our $18.9 million Health Sciences Building, supported by funds from the provincial
 government, as well as generous donations from our community. In the past year, we completed construction of our
 Vernon Trades Training Centre, and again want to extend our appreciation for you helping us celebrate the opening of
 that building. We also finished and opened a new welding building at our Penticton campus, bringing a much-needed
 facility to that community.

 Okanagan College has grown our program profile in various areas over the past year, with new programs and courses
 that serve the nascent cannabis industry and with a post-baccalaureate program in marketing and data analytics.
 We’ve also broadened our trades program with a two-year auto service technician diploma and we have developed
 and are about to offer a two-year tourism management diploma in Revelstoke. We are at work on a host of other new
 programs that speak to regional economic development opportunities. Our applied research profile continues to build,
 supported by federal and industry investments, as well as with appreciated support from your government.

 While a significant component of our student growth is as a consequence of an increase in our international student
 cohort, it is noteworthy that our domestic enrolments have also grown during a period when Grade 12 enrolments
 have been shrinking within our region. (In two years, Okanagan College’s FTE international numbers have increased
 59.4 per cent, to1,278 from 802.)

 This report identifies many of the successes Okanagan College can report in meeting the expectations of the Province,
 our students, employees and the communities we serve. This report has been prepared in accordance with the Budget
 Transparency and Accountability Act and we are accountable for meeting the objectives outlined in this plan.

 Sincerely,

 Christopher Derickson                                       Jim Hamilton,
 Chair, Okanagan College Board of Governors                  President, Okanagan College

Page 3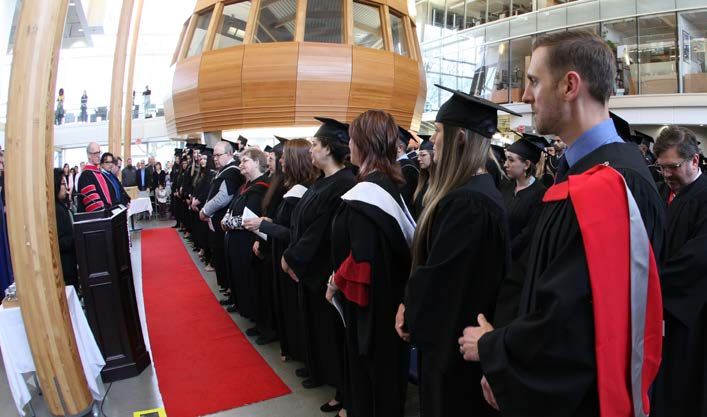
Okanagan College
                                                                                                                      2018-19 – 2021-22
 Table of Contents                                                                                         Accountability Plan and Report

 Map of Region  .  .  .  .  .  .  .  .  .  .  .  .  .  .  .  .  .  .  .  .  .  .  .  .  .  .  .  .  .  .  .  .  .  . 2
 Letter from the Board Chair and the President  .  .  .  .  .  .  .  .  .  .  .  .  .  .  .  .  .  .  . 3
 Institutional Overview and Strategic Direction  .  .  .  .  .  .  .  .  .  .  .  .  .  .  .  .  .  .  .  . 5
 Strategic Plan - Mission, Core Values   .  .  .  .  .  .  .  .  .  .  .  .  .  .  .  .  .  .  .  .  .  .  .  .  .  .  19
 Key Directions  .  .  .  .  .  .  .  .  .  .  .  .  .  .  .  .  .  .  .  .  .  .  .  .  .  .  .  .  .  .  .  .  .  .  .  .  .  . 20
         Supporting Learner Readiness and Success  .  .  .  .  .  .  .  .  .  .  .  .  .  .  .  .  .  .  . 21
         Excelling in Teaching, Programming, and Applied Research  .  .  .  .  .  .  .  .  .  .  . 27
         Working With, and Learning From, the Indigenous Community  .  .  .  .  .  .  .  .  . 30
         Serving and Engaging the Community  .  .  .  .  .  .  .  .  .  .  .  .  .  .  .  .  .  .  .  .  .  .  32
         Focusing on Organizational Sustainability  .  .  .  .  .  .  .  .  .  .  .  .  .  .  .  .  .  .  .  . 36
 Appendix: Performance Measures  .  .  .  .  .  .  .  .  .  .  .  .  .  .  .  .  .  .  .  .  .  .  .  .  . 38-40
 Appendix B: Mandate Priority #1   .  .  .  .  .  .  .  .  .  .  .  .  .  .  .  .  .  .  .  .  .  .  .  .  .  .  .  .  41
 Appendix: Financial Information  .  .  .  .  .  .  .  .  .  .  .  .  .  .  .  .  .  .  .  .  .  .  .  .  .  .  .  . 50

Page 4
Okanagan College
                                                                                                                        2018-19 – 2021-22
 Accountability Plan and Report                                                                              Accountability Plan and Report

 INSTITUTIONAL OVERVIEW & STRATEGIC DIRECTION

    In 2018-19,
 Over  the past 14Okanagan   CollegeCollege
                   years, Okanagan    has methasor grown
                                                   exceeded    Ministry
                                                          to better     performance
                                                                      Those    included: measures (see pages ??), including the
    institution’s mandate letter priorities of:
 serve  the communities,   employers,   and citizens of its region,
                                                                        • Post Baccalaureate Diploma in Marketing and Data Ana-
 which is more than six times the size of Prince Edward Island,            lytics (approved by Education Council in early 2019)
 with a population of approximately 410,000.
         • Implementing the education-related TRC Calls                     to Action
                                                                        • Courses        relevant
                                                                                     related        to Okanagan
                                                                                             to cannabis            College
                                                                                                         (in the wake          and in
                                                                                                                      of legalization
 The breadthactively
                and scopeparticipate   in an engagement
                            of its programs   have grown, itprocess
                                                                has     with     the Ministry
                                                                           October               and Cannabis
                                                                                      2018) including local, regional    andand
                                                                                                                Legislation   other
                                                                                                                                 Quality
 provided anIndigenous
                increasing number
                            partnersoftoseats    for students,
                                           develop               its
                                                      and implement       aAssurance,   Pest Management and Cannabis Production,
                                                                             comprehensive        strategy
                                                                           and Cannabis in the Workplace.
                                                                                                            that  increases
 physical space has grown and its reputation as a first-class
              student success and responds to the TRC Calls to Action and UN Declaration.
 educational institution has grown.                                     • Culinary Arts program with an Indigenous focus

        - Working
 The College  now offersclosely
                        more thanwith
                                   130government
                                       programs that to            • Blockchain certificate
                                                          support implementation
                                                       provide                              program initiatives including:
                                                                                        of priority
 credentials, ranging from Adult Upgrading to four post-
                 o Improving access to post-secondary education    • Two-year with  a focus
                                                                              diplomas        onService
                                                                                         in Auto   vulnerable   and and
                                                                                                          Technician under-
                                                                                                                        Colli-
 baccalaureate diplomas. A significant investment in facilities      sion Repair and  Refinishing.
                      represented students.
 and programs over the past 14 years has resulted in Okanagan
                 o    Expanding    programming
 College becoming B.C.’s second-largest        tradesaligned
                                                       trainingwith high demand occupations and priority sectors
                                                                   • Work is afoot on a new applied arts degree, currently

 provider.            (such as trades, technology and health).under review by the Degree Quality Assessment Board.
                 o Expanding co-op and work-integrated           Forlearning
                                                                      the 14thopportunities
                                                                                year, Okanaganfor    all students.
                                                                                                   College  has successfully met
 Several programs were introduced or expanded in 2018-19 to government established FTE domestic enrolment targets, and
 meet student and employer needs and interests.                  has experienced significant increases in international student
        • Improving student safety and overall well-being              in the areas of mental health and the
                                                                 enrolment.
             prevention of sexual violence and misconduct, including creating greater awareness of
             available supports.

         •   Ensuring that students are able to seamlessly transition into post-secondary education with
             the implementation of the new B.C. Graduation Program.

Page 5   •   Continuing to actively participate in the implementation of the EducationPlannerBC common
             application system for all undergraduate applicants.
Okanagan College
                                                                                                                        2018-19 – 2021-22
 Accountability Plan and Report                                                                              Accountability Plan and Report

      The headcount of individuals served by the College has grown to 20,650 in the 2017-18 academic year
      (ending Aug.
 The headcount        31, 2018)
                of individuals   and by
                               served thethe
                                           institution’s
                                             College hasfull-time
                                                         grown At equivalent  student
                                                                    a point when Gradecount  has grown
                                                                                       12 student       toin9,244
                                                                                                   numbers         – the have
                                                                                                              the region
      largest the  institution  has been,   and  approximately  70 per cent  larger than it was in 2005-06.
 to 20,650 in the 2017-18 academic year (ending Aug. 31, been falling, domestic FTEs have increased year-over-year by
 2018) and the institution’s full-time equivalent student count 181 FTEs to a total of 7,966 FTEs, or an increase of 2.3 per cent.
       At a point
 has grown         when
            to 9,244 – theGrade
                           largest12thestudent    numbers
                                         institution          in the
                                                      has been,  and region  have been
                                                                        International  FTEsfalling, domesticby
                                                                                             have increased    FTEs
                                                                                                                  318have
                                                                                                                      FTEs to a total of
       increased
 approximately  70year-over-year      by 181
                   per cent larger than         FTEs
                                           it was      to a total of 7,966
                                                  in 2005-06.               FTEs,
                                                                        1,278 FTEs,ororan
                                                                                        anincrease   of33
                                                                                           increase of  2.3per
                                                                                                            per  cent.
                                                                                                               cent.
         International FTEs have increased by 318 FTEs to a total of 1,278 FTEs, or an increase of 33 per cent.

Page 6
Okanagan College
                                                                                                                         2018-19 – 2021-22
 Accountability Plan and Report                                                                               Accountability Plan and Report

                                       Okanagan College’s first graduating class of 2019 celebrated in the Centre for Learning in January.

 In 2018-19, Okanagan College has met or exceeded Ministry            • Ensuring that students are able to seamlessly transition into
 performance measures (see Pages 38-48), including the                  post-secondary education with the implementation of the
 institution’s mandate letter priorities of:                            new B.C. Graduation Program.

   • Implementing the education-related TRC Calls to Action           • Continuing to actively participate in the implementation of
     relevant to Okanagan College and actively participate in           the EducationPlannerBC common application system for
     an engagement process with the Ministry and local, re-             all undergraduate applicants.
     gional and other Indigenous partners to develop and im-          • Working closely with the Ministry to develop a balanced
     plement a comprehensive strategy that increases student            approach to international education, participating in the
     success and responds to the TRC Calls to Action and UN             development and implementation of a provincial frame-
     Declaration.                                                       work for international education.
   • Working closely with government to support implementa-           • Meets or exceeds the financial targets identified in the Min-
     tion of priority initiatives including:                            istry’s three-year Service Plan tabled under Budget 2018,
     o Improving access to post-secondary education with a fo-          including maintaining balanced or surplus financial results.
       cus on vulnerable and under-represented students.              • Complying with the Tuition Limit Policy, which sets a two
     o Expanding programming aligned with high demand oc-               per cent cap on tuition and mandatory fee increases for
       cupations and priority sectors (such as trades, technolo-        domestic students to ensure courses and programs are af-
       gy and health).                                                  fordable.

     o Expanding co-op and work-integrated learning opportu-
       nities for all students.
   • Improving student safety and overall well-being in the ar-
     eas of mental health and the prevention of sexual violence
     and misconduct, including creating greater awareness of
     available supports.

Page 7
Okanagan College
                                                                                                                          2018-19 – 2021-22
 Accountability Plan and Report                                                                                Accountability Plan and Report

 AFFORDABILITY                                                         the Okanagan (Syilx) Nation Alliance and the Shuswap Tribal
                                                                       Council (the Secwépemc). There were several significant events
 In 2019, Okanagan College increased domestic student                  of note during 2018-19. In the fall of 2018, Okanagan College
 tuition fees by the allowable two per cent (as per government         held its 10th annual PowWow, honoring two elders – Richard
 guidance). It was the ninth time the College’s Board chose to         Jackson Jr. and Noel Ferguson – who have been stalwart
 increase domestic tuition in the 14 years since the government        supporters and participants in the PowWows. In turn, they
 has established a cap on tuition
 fee increase. During that period
 Okanagan College’s domestic arts
 tuition per semester has increased
 from $1,509 per semester to $1,739
 per semester, an increase of 15.2
 per cent. The cost of living in B.C.
 (inflation) has gone up 27.9 per cent.
 Okanagan College’s per semester
 tuition is still lower than Okanagan
 University College’s tuition in the fall
 of 2004 ($1,800)

 In terms of Open Educational
 Resources, BC Campus reports that
 as of November, 2018, Okanagan
 College ranked sixth among the 41
 institutions in BC that have adopted
 Open Educational Resources as part
                                                OC Aboriginal Transition Planner Marilyn Alexis was recognized by CICan for her leadership
 of BC Campus’s initiative. OC faculty,
 by that point, had reported 147 text
 adoptions since 2013, saving students an estimated $437,211. presented the College with an Eagle Staff, built by Jackson.
 That figure does not tell the complete story, however. In 2018- That Staff has come to be used in significant College events,
 19 OC invested $12,044 from its Emerging Opportunities including Convocation and Commencement ceremonies.
 Fund to purchase electronic versions of required text books, Also worthy of note was the honor accorded one of Okanagan
 when unlimited simultaneous user licensing was available. To College’s Aboriginal Transition Planners, Marilyn Alexis.
 date 94 titles have been purchased for courses ranging from She was acknowledged for her leadership by Colleges and
 water engineering technology to nursing, business, computer Institutes Canada for her work on an Indigenous Garden (the
 science, viticulture, and English. Estimated savings to students K’nmalka? Senqualten - Kalamalka Garden) at the College’s
 to date is $110,177. As well, professors are using texts from Vernon campus. It contains Indigenous food/medicinal plant
 Creative Commons in their course work. An example is species from the Okanagan territory and was developed to
 Economics Professor Brad Clements, who relies on such be a “teaching” resource of Okanagan Indian Band’s (OKIB)
 material for his Introduction to Economics course. The 425 traditional knowledge through tours and outdoor workshops.
 students who have taken his course since fall 2016 have saved Since its inception in 2017 the garden has experienced
 a minimum $117 per textbook, for accumulated savings of considerable demand and, as such, is now positioned to
 approximately $50,000.                                                become an Indigenous tourism asset for the North Okanagan
 INDIGENIZATION                                                        region.

 Significant work has continued on development of an                   College staff continue to work on many provincial committees
 Okanagan College Indigenization Strategy, drawing on the              that serve to advance key provincial priorities in post
 advice, insight, and direction of a respected Indigenous scholar,     secondary. Those include BCCAT, (co-chaired by Okanagan
 Dr. Bill Cohen, and supplemented with direction and advice            College President Jim Hamilton), and the EducationPlannerBC
 from the Okanagan Aboriginal Education Council, a body                Governance Working Group (chaired by Dr. Andrew Hay,
 that serves both Okanagan College and UBC Okanagan. As                Okanagan College’s Vice President Education).
 the College continues discussions with the First Nations band         The College’s Strategic Plan (2016-2020) is available on the
 and Metis organizations of the region, it is also is engaging         College website and is including beginning on Page 19.

Page 8
Okanagan College
                                                                                                                                2018-19 – 2021-22
 Accountability Plan and Report                                                                                      Accountability Plan and Report

 EMPLOYMENT AND LABOUR MARKET                                                    OKANAGAN EMPLOYMENT
 Variables that help in enrolment forecasting at Okanagan                        BC’s unemployment rate declined by 0.4 per cent in 2018,
 College are the overall regional unemployment rate, one year                    dropping to 4.7 per cent. This was the tenth consecutive year
 out, and the regional Grade 12 headcounts (combined with                        of decline.
 the immediate K-12 to post-secondary transition rates within
                                                                                 Kelowna’s unemployment rate also showed a decline over the
 the College catchment area).
                                                                                 previous year to 4.8 per cent.
 Generally, as employment rates increase and Grade 12
                                                                                 The unemployment rate for the entire Thompson Okanagan
 headcounts decrease, College enrolments can be expected to
                                                                                 region (6.1 per cent) also continued its year over year
 decrease – or at least see slower growth.
                                                                                 improvement, though it remained higher than the provincial
                                                                                 average. The Kelowna unemployment rate dropped further
                                                                                 since December to 4.1 per cent at the end of March, 2019.

                            BC Unemployment Rate by Region and Metropolitan Area
       10

                              8
        9
              8.6
                                                 7.7                                                   8
        8

        7
                                                                                                                                         6.1
                                                          6.5          6.6
        6                                                                                                               5.4

                                                                                                                                         4.8
        5                                                                                        5.6
                                                                                                                                         4.7
        4                                                                         4.6
                                                                                                                                   4.3

        3
                 2009          2010          2011         2012          2013        2014       2015        2016      2017         2018
                           BRITISH               KELOWNA              MAINLAND/            THOMPSON/
                           COLUMBIA                                   SOUTHWEST            OKANAGAN

            Source Statistics Canada Labour Force Survey, Prepared by BC Stats

     Lowering unemployment in the region may adversely affect enrolments. However, an overall increase in
     regional population as well as a transitioning economy from manufacturing and resources, to service-
     oriented sectors of government, tourism and technology will continue to create demand for new skills.

       CPABC used Statistics Canada Census data from 2016 to build their Thompson-Okanagan Regional Check-
       Up 2017. The educational attainment of Thompson-Okanagan region’s labour force rebounded from a
Page 9 decline in 2016 to achieve an all-time high in 2017 of 67.9 per cent. This gain resulted from the addition
       of 7,800 individuals with post-secondary accreditation to the labour force and the loss of 6,500 workers
       with less education.
Okanagan College
                                                                                                                      2018-19 – 2021-22
 Accountability Plan and Report                                                                            Accountability Plan and Report

    As summarized by the International Monetary Fund (IMF), Canadian gross domestic product (GDP)
 As summarized by the International Monetary Fund (IMF), both the national and provincial employment picture.
   showed
 Canadian    thedomestic
           gross  nationalproduct
                             economy (GDP)grew   1.8theper
                                            showed          cent for all of 2018 — about half of the pace of 2017. This
                                                        national
                                                                    Both Canadian and BC average unemployment rates continued
   overallgrew
 economy    GDP1.8improvement
                    per cent for all was  reflected
                                     of 2018 — aboutin  both
                                                      half      the to
                                                           of the   national  and provincial employment picture.
                                                                       improve in the last year. British Columbia currently has the
 pace of 2017. This overall GDP improvement was reflected in
                                                                    lowest unemployment rate of any province in Canada.
    Both Canadian and BC average unemployment rates continued to improve in the last year. British
    Columbia currently has the lowest unemployment rate of any province in Canada.
                        Unemployment Rates* (%), March 2019               Line represents Canada at 5.8%

    Central 1’s B.C. Economic Outlook 2019-2021 confirms that B.C.’s economy decelerated over the past year
    following robust gains in 2017.

             “Growth in real gross domestic product (GDP) is estimated to have eased to 2.8 per cent in 2018
 Central 1’s B.C. Economic Outlook 2019-2021 confirms that             “While there is weakness in hiring demand in some
             from 3.8 per cent in 2017.”                               sectors, particularly residential construction,
 B.C.’s economic growth decelerated over the past year
 following robust gains in 2017.                                       transferable skillsets to non-residential activity will
             “Policy-induced deceleration in the housing market        provide anand       slowing
                                                                                      outlet           consumer
                                                                                              for displaced          demand
                                                                                                             jobs. A period of have
     “Growth in real gross domestic product (GDP) is
             dampened household demand. B.C. economic growth is forecasted to slow to 2.1 per cent in 2019
                                                                       flat employment       is anticipated  in manufacturing
     estimated to have eased to 2.8 per cent in 2018                   and resources, with stronger gains related to
     from 3.8before
               per centrising   to 2.4 per cent in 2020 and 2.8 per cent
                           in 2017.”                                          in 2021.” sectors of government, tourism
                                                                       service-oriented
     “Policy-induced deceleration in the housing                       and technology.”
   Despite
     marketthe anddip    in growth
                      slowing         the provincial
                                 consumer    demand haveeconomy continues to expand marking more than a decade of
                                                                 Further, the Central 1 economic forecast predicts that over
   continuous
     dampened economic
                   household expansion.
                                  demand. B.C. economic
                                                                 the next two years BC unemployment rate will continue to
     growth is forecasted to slow to 2.1 per cent in
                                                                 be below five per cent. The consumer price index increases
     2019 before
             “While rising  to 2.4
                        there      per cent in 2020
                                is weakness         and 2.8
                                                in hiring demand in
     per cent in 2021.”                                          aresome     sectors,
                                                                      expected           particularly
                                                                                   to hold               residential construction,
                                                                                            steady at approximately    two per cent.
             transferable skillsets to non-residential activity       will provide
                                                                 Population             an to
                                                                               is forecast  outlet
                                                                                                grow for  displaced
                                                                                                      by an average ofjobs. A 67,000
                                                                                                                        about  period
 Despite the dip in growth the provincial economy continues to persons, or 1.3 per cent annually, through 2021. Growth
             of flat employment is anticipated in manufacturing and resources, with stronger gains related to
 expand, marking more than a decade of continuous economic reflects positive migration factors. Rising federal intake of
 expansion. service-oriented sectors of government, tourism            and technology.”
                                                                 international migrants is a key contributor to growth with
                                                                 inflows of permanent residents above 40,000 persons per year.
    Furthermore, the Central 1 economic forecast predicts that over the next two years BC unemployment
    rate will continue to be below five per cent. The consumer price index increases are expected to hold
    steady at approximately two per cent. Population is forecast to grow by an average of about 67,000
    persons, or 1.3 per cent annually, through 2021. Growth reflects positive migration factors. Rising federal
    intake of international migrants is a key contributor to growth with inflows of permanent residents above
    40,000 persons per year.
Page 10
BC’s unemployment rate declined by 0.4 per cent in 2018, dropping to 4.7 per cent. This was the tenth
consecutive year of decline.
Kelowna’s unemployment rate also showed a decline over the previous to 4.8 per cent.
Okanagan College
The unemployment rate for the entire Thompson Okanagan region (6.1 per cent) also continued2018-19
its year– 2021-22
Accountability Planthough
over year improvement, and Report
it remained higher than the provincial average. The Kelowna
Accountability Plan and Report
unemployment rate has dropped further since December to 4.1 per cent at the end of March, 2019.
KELOWNA
105 10
8.6 102.3
101.9 102 9
101.4
8 8
7.7
100 8
6.6 100.2
6.5 7
95 5.6 5.4 6
4.8
4.6 5
93.2 4.1
92.9 92 3.9
90 91.9 3.8 4
90.9
90.3 90.3
3
87.2
85 2
1
80 0
ar
09
10
11
12
13
14
15
16
17
18
n
eb
-Ja
-M
20
20
20
20
20
20
20
20
20
20
-F
19
19
19
EMP. ('000) UNEMP. %
Lowering unemployment in the region may adversely affect According to British Columbia Labour Market Outlook 2018
enrolments. However, an overall increase in regional population edition in the Thompson-Okanagan region:
as well as a transitioning economy from manufacturing and
“Over the 10-year forecast period, employment
resources, to service-oriented sectors of government, tourism demand is anticipated to increase by 0.7 percent
and technology will continue to create demand for new skills. on average each year. Over the next 10 years,
91,190 job openings are expected, of which 79
The Chartered Professional Accountants of British Columbia
per cent are needed to replace retirees and 21
(CPABC) used Statistics Canada Census data from 2016 to
per cent are due to economic growth.”
build their Thompson-Okanagan Regional Check-Up 2017.
The educational attainment of Thompson-Okanagan region’s “The fastest growing industries from now until
2028 are anticipated to be Warehousing and
labour force rebounded from a decline in 2016 to achieve
Storage, Telecommunications and Nursing and
an all-time high in 2017 of 67.9 per cent. This gain resulted
Residential Care Facilities.”
from the addition of 7,800 individuals with post-secondary
accreditation to the labour force and the loss of 6,500 workers With a versatile set of program offerings, Okanagan College
with less education. continues to be leader in fulfilling these regional educational
needs.
Okanagan College and UBC Okanagan also continue to see
growth and an increased influx of international students and a
consequent growth in the number of graduates.
Page 11Okanagan College
2018-19 – 2021-22
Accountability Plan and Report Accountability Plan and Report
Okanagan College’s international student population has experienced significant growth.
Page 12Okanagan College
2018-19 – 2021-22
Accountability Plan and Report Accountability Plan and Report
POPULATION PROJECTIONS AND According to BC Stat’s People population projections, from
GRADE 12 HEADCOUNTS 2024 onwards the Central Okanagan’s largest working age
population cohorts will be the 35 to 39 year old group almost
Below are the population projections for the 15 to 39 age overlapping with the 30 to 34 year old group. In the Okanagan
cohorts for the Okanagan Region; these age groups account school districts outside of the Central Okanagan (i.e. Vernon,
for more than 90 per cent of the fall term headcount at the Okanagan Shuswap, Okanagan Skaha, and Okanagan
College. Overall, the regional population for the 15 to 19 age Similkameen), the largest working-age cohort is projected to
cohort will continue to decline until 2021. The 20 to 24 age be 60 to 64 age group, far greater in numbers than the 20-
cohort, after rising over the last few years, peaked in 2018; to 24-year-old group. Demand for various types of college
hereafter it will continue to shrink until 2026. The population of programming will be uneven in the valley, based on expected
Population Projections and Grade 12 Headcounts
25- to 29-year olds is also forecast to start declining after 2023. population numbers.
The other age groups (30 to 34, and 35 to 39) are expected to
Below are the population projections for the 15 to 39 age The cohorts for the Okanagan
Central Okanagan Region;
School District these
Grade 12 age
headcount
increase until 2027.
groups account for more than 90 per cent of the fall term headcount
is the largest inatthe
theCollege
College.region,
Overall, the regional
slightly smaller than all
population for the 15 to 19 age cohort will continue to decline untilschool
of the other 2021.districts
The 20combined
to 24 ageincohort, after
2019. (See graph on
following page).
rising over the last few years, peaked in 2018; hereafter it will continue to shrink until 2026. The
population of 25- to 29-year olds is also forecasted to start declining in numbers after 2023. The other age
groups 30 to 34, and 35 to 39 are expected to increase until 2027.
Okanagan Region School Districts Population Projection
32000
30825
30000 30566
28000
26663
26000 24907
24753
23807
24000 24456
22542
23275 24517
22274
22000 20862
21782 21645
21165
20000
2013 2014 2015 2016 2017 2018 2019 2020 2021 2022 2023 2024 2025 2026 2027
15-19 20-24 25-29 30-34 35-39
According to BC Stat’s People population projections, from 2024 onwards the Central Okanagan’s largest
working age population cohorts will be the 35 to 39 year old group almost overlapping with the 30 to 34
year old group. In the Okanagan school districts outside of the Central Okanagan (i.e. Vernon, Okanagan
Shuswap, Okanagan Skaha, and Okanagan Similkameen), the largest working-age cohort is projected to
be 60 to 64 age group, far greater in numbers than the 20- to 24-year-old group. Demand for various types
of college programming will be uneven in the valley, based on expected population numbers.
The Central Okanagan School District Grade 12 headcount is the largest in the College region, slightly
smaller than all of the other school districts combined in 2019.
Page 13Okanagan College
2018-19 – 2021-22
Accountability Plan and Report Accountability Plan and Report
Grade 1212
Grade Headcounts
Headcountsforforthe
theOkanagan
OkanaganCollege
CollegeRegion
Regionby
by
School District
School District(SD23
(SD23ononright
rightaxis)
axis)
800 2,100
2,100
source: 1558b
682
700
623 611 2,000
2,000
600 1,957
567 587
504 1,900
1,900
544
500
478
1,849 489
400 1,800
1,800
300
1,738 1,700
1,700
211
200 186
171
92 124 1,600
1,600
100 86
0 1,500
1,500
2013 2014 2015 2016 2017 2018 2019 2020 2021 2022 2023 2024 2025 2026 2027 2028
SD19 SD22 SD53 SD67 SD83 SD23
Change in Grade 12 Headcounts
for the Okanagan College Region
200
156 147
150 127
110
100
57
39
50
8 4
0
-50 -14
-28
-47 -45
-100 -73
-150
-150
-200 -172
2013 2014 2015 2016 2017 2018 2019 2020 2021 2022 2023 2024 2025 2026 2027
to to to to to to to to to to to to to to to
2014 2015 2016 2017 2018 2019 2020 2021 2022 2023 2024 2025 2026 2027 2028
PageNet
14 Regional MigrationOkanagan College
2018-19 – 2021-22
Accountability Plan and Report Accountability Plan and Report
In recent years, there has been an increase in the number of people migrating to BC from other provinces,
NET REGIONAL
as well MIGRATION
as an increase
72 per cent of the new residents in the Thompson-Okanagan
in immigration from other countries. In migration fromAlberta
these and
twoother
sources is
Region were migrants from provinces.
In anticipated
recent years, to continue,
there has been albeit at a slower
an increase rate. According
in the number of The to the CPABC
population Regional
growth Check-Up 2017,
was concentrated 72 per
in the Central
people migrating to BC from other provinces,
cent of the new residents in the Thompson-Okanaganas well as an RegionRegional
Okanagan were migrants from Alberta
District, attracting and of
83 per cent other
the new
increase in immigration from other countries. In-migration residents. Some of the interprovincial migration may be British
provinces. The population growth was concentrated in the Central Okanagan Regional District, attracting
from these two sources is anticipated to continue, albeit at a Columbians returning to BC after working in other provinces,
83 per
slower rate.cent of the
According new
to the residents.
CPABC RegionalSome of the
Check-Up interprovincial
2017, migration may be British Columbians
especially in the oil and gas patch in Alberta.
returning to BC after working in other provinces, especially in the oil and gas patch in Alberta.
Thompson Okanagan Development Region Migration Stats
net_international_migrants interprov_net intraprov_net total_net_migrants
14000
12719
12000
10000
8000
6000
4910
4000 4664
3145
2000
0
2008-2009 2009-2010 2010-2011 2011-2012 2012-2013 2013-2014 2014-2015 2015-2016 2016-2017 2017-2018
Source: BC Data Catalogue - British Columbia Development Region Migration Components
Down from 7.8 per cent in 2017 and after averaging 6.6 per cent in 2018, the average Alberta
unemployment rate is forecast to stay at this level in 2019. With fairly slow prospects of improvement in
Alberta
Down from labour
7.8 per market the and
cent in 2017 influx of averaging
after workers 6.6 to BC
per as workers
well Thompson-Okanagan region from Alberta
to BC as well Thompson-Okanagan region isfrom
cent in 2018, the average Alberta unemployment rate is Alberta is expected to continue in 2019. However, as the
expected to continue in 2019. However, as the Alberta economy picks up momentum over a longer
forecast to stay at this level in 2019. With fairly slow prospects Alberta economy picks up momentum over a longer horizon
ofhorizon there in
improvement is athe
possibility of reversal
Alberta labour marketover
the the coming
influx years.
of there is aAs stated inofAlberta’s
possibility 2018
reversal over the-19 thirdyears.
coming quarter
fiscal update and economic statement:
“The Alberta economy continued to recover in 2018 after leading the country in growth in 2017.
Real GDP is estimated to have grown by 2.4 per cent due to strength in the first three quarters of
the year. However, momentum slowed in the fourth quarter amid pipeline constraints and
unprecedented discounts for Alberta crude. Activity in Alberta’s energy sector weakened in
response, weighing on business and consumer sentiment. Market access issues and tempered WTI
prices have dampened growth expectations for this year. Real GDP growth is forecast to slow to
1.6 per cent in 2019, down from 2.5 per cent at Budget.”
Page 15Okanagan College
2018-19 – 2021-22
Accountability Plan and Report Accountability Plan and Report
HOUSING Average monthly rents also continued their upward trajectory
in 2018. A bachelor apartment in October 2017 cost $656 in
Rental vacancies increased in BC’s four Census Metropolitan Vernon (up from $619 in 2017), and $890 in Kelowna (up from
Areas (CMA’s) including Vancouver, Victoria, Abbotsford- $859 in 2017).
Mission and Kelowna based on new supply increasing faster
than demand in each of these markets. BC’s four CMA’s now The October 2018 data was suppressed due to small sample
all have vacancy rates either at or above 1 per cent as a result size for Salmon Arm where the average bachelor’s apartment
of new supply beginning to outpace demand. rent was $579 in 2017.
However, in three of the municipalities that are home to The effects of migration to the Okanagan can be seen more
Okanagan College’s major campuses – Kelowna, Salmon Arm prominently in the exponential increase in Kelowna home
and Penticton – the rental vacancy rates of private apartments prices on a year-over-year basis.
continue to stay well below the provincial average. According to the Royal LePage House Price Survey released
The October 2018 Rental Market report from Canada in April 2019:
Mortgage and Housing Corporation (CMHC) showed Salmon “The aggregate price of a home in Kelowna grew in
Arm maintaining the lowest vacancy rate, hovering close to the first quarter of 2018 by 2.7 per cent year-over-
0.7 per cent (a slight improvement from 0.0 per cent in 2017). year to $643,787. When broken out by housing type,
Kelowna’s vacancy rate has increased significantly from 0.2 per the median price of a two-storey home increased 2.2
cent in 2017 to 1.9 per cent in 2018. Penticton had 1.7 per cent per cent year-over-year to $729,602, while the median
vacancy rate (up from 0.9 per cent in 2017). Vernon’s vacancy price of a bungalow dipped 0.1 per cent to $635,418.
The median price of a condominium rose significantly
rate remained unchanged at 1.5 per cent. The vacancy rate
by 13.6 per cent, increasing to $435,823.”
in BC increased in October 2018 to 1.4 per cent from 1.3 per
cent in October 2017 but remained low relative to the 10-year
average of approximately two per cent. The noted increase is
generally as a result of new supply entering the rental market.
Okanagan College students raise a wall on a new home that is part of their Carpentry Foundation program.
Page 16Okanagan College
2018-19 – 2021-22
Accountability Plan and Report Accountability Plan and Report
GLOBAL ECONOMY & mandated cuts in Alberta, policy-induced weakness
in the housing market and slower consumer demand
INTERNATIONAL FACTORS will drag on Canada’s growth picture. B.C.’s economic
There are several global economic factors that may continue growth trajectory follows the broad brushstrokes of
to influence the Canadian and British Columbian economies. the Canadian picture; however, growth will continue
These factors can also influence the numbers of international to outperform the rest of the country.”
students that come to BC. The macro-economic scene around Due to the volatility in macro-economic conditions an element
the globe remains volatile. The world economy continues to of unpredictability seems to be afflicting those at the helm of
be susceptible to trade disputes, regional economic disputes, financial affairs. The mood remains somber among CFOs in
military conflicts and other geo-political factors. As summarized major world regions. Nearly half of U.S. Chief Financial Officers
in International Monetary Fund (IMF) World Economic Outlook (CFOs) believe that U.S. economy will enter a recession by the
(WEO) 2019: end of 2019. According to the Duke University/CFO Global
“One year ago economic activity was
accelerating in almost all regions of the world
and the global economy was projected to
grow at 3.9 percent in 2018 and 2019. One
year later, much has changed: the escalation
of US–China trade tensions, macroeconomic
stress in Argentina and Turkey, disruptions
to the auto sector in Germany, tighter credit
policies in China, and financial tightening
alongside the normalization of monetary
policy in the larger advanced economies
have all contributed to a significantly
weakened global expansion, especially in
the second half of 2018. With this weakness
expected to persist into the first half of
2019, WEO projects a decline in growth in
2019 for 70 per cent of the global economy.
Global growth, which peaked at close to 4
per cent in 2017, softened to 3.6 per cent A taste of India is an annual celebration of Indian culture held at
in 2018 and is projected to decline further OC’s Penticton Campus
to 3.3 per cent in 2019. Although a 3.3 per cent
global expansion is still reasonable, the outlook for Business Outlook:
many countries is very challenging, with considerable “Worst-case projections would see capital spending
uncertainties in the short term, especially as advanced drop in 2019, accompanied by flat hiring. CFOs have
economy growth rates converge toward their modest generally become pessimistic in most regions of the
long-term potential.” world. Ninety-seven percent of African CFOs believe
Central 1’s Economic Analysis of British Columbia report their countries will be in recession no later than year-
(2019-2021), generally confirms WEO’s conclusions that global end 2019, as do many CFOs in Canada (86 percent),
Europe (67 percent), Asia (54 percent), and Latin
economic growth has reached a cyclical peak and we are
America (42 percent).”
entering a period of softening macro-economic environment.
It states: The Canadian dollar also continues to be impacted by the
world macro-economic picture. TD Securities predicts:
“The deceleration in growth is forecast to be steeper
in advanced economies, from a 2.3 per cent rate “The loonie will spend much of 2019 in range where
in 2018 to 2.0 and 1.7 per cent in 2019 and 2020. it will cost between $1.35 and $1.40 Canadian to buy
Emerging and developing economic growth is also one US dollar. Put another way that means it could dip
forecast to slow from 4.6 per cent in 2018 to 4.5 as low as 71 cents US against the greenback. “
per cent in 2019, before picking up. Weaker growth
in China is a key driver of the slowdown. The IMF
forecasts Canadian GDP growth to slow to 1.9 per
cent in both 2019 and 2020. This is higher than our
outlook of 1.7 per cent but aligns in its downward
direction. Lower oil production following government
Page 17Okanagan College
2018-19 – 2021-22
Accountability Plan and Report Accountability Plan and Report
Visiting other areas of the province is an important component of the cultural experience for Okanagan College’s international students.
Due to general slowdown in world economic outlook the which measured the reputation of the 55 countries with the
emerging market currencies may also remain under pressure. largest economies in the world. Canada has often been in
Over the past few years, top two source countries of the top spot - in the past eight years placed first five times
international students to BC have been the emerging market including in 2017. In 2016 and 2014, we were in second place,
countries of India and China. As the currencies of both these beat out by Sweden and Switzerland respectively. The 2018
countries continue to stay weak relative to US dollar, the dip results have Sweden, Finland, Switzerland, and Norway as the
in the Canadian dollar’s outlook against the US dollar may top four reputational countries, however the official language
not have any material impact on is not English in any of these
international student budgets from countries limiting their appeal
these countries. For instance, due to a majority of international
to the currency exchange rate of students coming to Canada.
approximately one Canadian dollar Among the English speaking
staying near or above 50 Indian countries Canada remains at the
Rupees, the rapidly increasing share third spot after New Zealand
of BC international students from and Australia respectively.
India will continue to face significant
International students that
economic challenges to support
ultimately intend to immigrate
their cost of education in Canada.
to Canada also continue to
However, under the aforementioned benefit from one of the most
macro-economic and geopolitical accommodating rules at the
conditions Canada will continue provincial and federal levels
to be one of the top desired that facilitate their permanent
destinations for international residency in Canada. A few
students. International students are years ago part-time work rules
expected to continue to move to were also relaxed by the Federal
Canada and BC for various reasons. government to accommodate
From a reputational point of view, the needs of international
Canada is known for being a safe students for Canadian work
space as well as an ethical country experience while they are full-
with an effective government. time students. Indirectly these
Although Canada has fallen to relaxed rules help international
seventh spot in the 2018 Country students with their economic
RepTrak, by the Reputation Institute, challenges as well.
Page 18Okanagan College
2018-19 – 2021-22
Strategic Plan Accountability Plan and Report
STRATEGIC PLAN 2016-2020
MISSION
Okanagan College transforms lives and communities.
We engage, lead and serve through:
• A high quality educational experience for our learners.
• An environment that supports employees and encourages personal and professional growth.
• Collaborative relationships that are responsive to our communities.
CORE VALUES
These serve to guide decision-making as an organization and our actions as individuals.
1. Learner Success. Learners are at the heart of everything we do.
2. Access. We advocate and promote access to education.
3. Continuous Improvement. We strive to do better tomorrow than we did today.
4. Collegiality. In all our interactions we act with respect and integrity.
5. Diversity. We support an inclusive environment.
6. Sustainability. We strive for social, environmental and economic sustainability.
7. Collaboration. We embrace the opportunity to work with and learn from each other.
8. Innovation. We introduce, evaluate and embrace new ideas.
Page 19Okanagan College
2018-19 – 2021-22
Strategic Plan - Key Directions Accountability Plan and Report
KEY DIRECTIONS
Supporting Learner Readiness and Success (See page 21)
Through their educational experience, learners are better prepared for work, life and further study.
• Improve pathways for students into, within, and beyond Okanagan College.
• Provide the best possible support services for learners.
• Enhance the learner experience by improving administrative systems and processes, and by creating
an engaging college environment.
• Implement an internationalization plan so that students better understand the world around them.
Excelling in Teaching, Programming, and Applied Research (See page 27)
Students, employers, and the community will benefit from the College’s commitment to
innovative and responsive education.
• Use the best combination of course delivery methods, such as face-to-face, E-learning, and blended approaches,
to address diverse learner and community needs.
• Provide an array of programming that effectively responds to the needs of our students, employers and
communities.
• Provide opportunities for teaching professionals to continuously enhance their skills, knowledge and practice.
• Significantly develop applied research, scholarly activity, and knowledge transfer activities to better serve
students, communities, and employers.
Working With, and Learning From, the Indigenous Community (See page 30)
The College values and respects Indigenous culture and ways of knowing and is working
towards indigenization. The goal is an authentic partnership that benefits all parties and enriches
the education of learners.
• Commit to an indigenization plan through engagement with Indigenous communities. The plan will address:
• Enhancing ties with Indigenous partners.
• Strengthening support services as well as physical, cultural, and spiritual spaces that are available to learners.
• Increasing opportunities for the college community to learn from Indigenous knowledge and culture.
• Identifying possible changes to College policies, structure, and processes that will benefit all.
Serving and Engaging the Community (See page 32)
Strengthening relationships with alumni, employers, and community groups contributes to
the health and prosperity of the region the College serves.
• Increase the number and strength of connections.
• Build and sustain relationships with alumni and donors.
• Increase opportunities for engagement with all communities through approaches such as applied research,
experiential learning, student employment programs, guest speakers, and events.
Focusing on Organizational Sustainability (See page 36)
The College needs to address the human and financial resources, infrastructure, and environmental
challenges that will accompany anticipated demographic, economic, and social changes.
• Seek additional sources of funding to sustain and further develop the College.
• Ensure there are sustainable operations in each of the four regions.
• Augment the College’s human resource plan through improved strategies in key areas such as succession
planning, employee development and the recruitment and retention of a diverse employee base.
• Complete and implement a sustainability plan that addresses environmental, financial and social sustainability.
Page 20Okanagan College
2018-19 – 2021-22
Key Directions - Supporting Learner Readiness and Success Accountability Plan and Report
Okanagan College Key Direction: Supporting Learner Readiness and Success
Okanagan College Objectives Ministry Objectives Aligned BC AEST Performance
Measure
• Improve pathways for students into, within, • Improving access to post- • Student Spaces – total and
and beyond Okanagan College. secondary education with designated program areas
a focus on vulnerable and
• Provide the best possible support services for • Credentials Awarded
underrepresented students.
learners.
• Transition rate of secondary
• Expanding programming
• Enhance the learner experience by improving school students to public
aligned with high demand
administrative systems and processes, Postsecondary Education.
occupations and priority
and by creating an engaging college
sectors • International student spaces
environment.
• Expanding co-op and • Year-to-year retention rate
• Implement an internationalization plan so that
work-integrated learning • Time to completion
students better understand the world around
opportunities for all students
them.
PATHWAYS AND TRANSITIONS On July 13, 2018, CampOC’s new Girls Can Go-Kart Too camp
crossed the finish line. The weeklong pilot camp received a
Starting in March, 2019 a new Gateway to Technology lot of attention, spanning the country. The camp saw a dozen
Program, funded by AEST and in collaboration with School girls aged 9-12 step into the Automotive shop at the Kelowna
District 67, equipped 16 Grade 10-12 students in Penticton campus, tackling everything from designing their go-karts to
with an enhanced understanding of how various technologies working on small engines, changing the oil, replacing tires,
function. Students completed the program in June. testing and fixing brakes, and installing ignition kill switches –
In September, 2018 Okanagan College brought a new Trades all under the watchful eye of College instructors.
and Technology Teacher Education (TTTE) program to life, Connecting the young women with mentors was another
through a partnership with Brock University. The program priority. They each received mentorship, support and
offers high school teachers looking to specialize in trades encouragement from the Women in Trades team, WITT
and technology and professionals in the industry a chance to industry mentors and WITT foundation participants.
add instructional training to their toolkit. Secondary school
teachers can complete the TTTE Certificate and qualify to Preparation for construction on the new $18.9-million Health
teach various trades courses, while tradespersons with a Red Sciences Centre at the Kelowna campus kicked off in mid-June,
Seal and industry experience can complete the TTTE Diploma 2018 with a traditional smudging ceremony. The ceremony
and apply to instruct trades began with a blessing by
programs in their industry. Westbank First Nation Elder
Students pursuing the TTTE Grouse Barnes. He blessed
Certificate will enroll with the the land, the new building,
College, while those looking employees, workers and
to complete the Diploma all of the students who will
will register with both OC occupy the new building.
and Brock University. The Employees were invited to
goal of the program and the smudging ceremony as
the new collaboration is to well as a series of information
provide students entering sessions held on June 19 and
the program from different 20. The project is anticipated
fields with just the right to be complete in late spring
blend of instructional and 2020.
hands-on trades training. CampOC’s new Girls Can Go-
Kart Too camp gives young girls
the opportunity to test drive a
career in the trades.
Page 21Okanagan College
2018-19 – 2021-22
Key Directions - Supporting Learner Readiness and Success Accountability Plan and Report
Melanie Mark, Minister of Advanced Education, Skills and Training and Stephen Fuhr, MP for Kelowna-Lake Country joined Okanagan
College students and officials to open the doors of the new Trades Training Centre at the Vernon campus.
A class of Plumbing and Piping Foundation trades students 16 Welder Foundation students, who, under the tutelage of
were the first to step through the doors of the newly completed instructor Mark Stathers, were the first to train in the facility.
Trades Training Centre at the Vernon campus at 7 a.m. on The shop is one of the most advanced and sustainable in the
Aug. 7 in early August, 2018. A few hours later, they helped province, informed by extensive input from industry.
to officially open the space where they honed their trade. The
The new facility also affords the College enhanced space and
Hon. Melanie Mark, Minister of Advanced Education, Skills and
flexibility to be able to offer other trades programs on campus.
Training and Stephen Fuhr, Member of Parliament for Kelowna
- Lake Country, joined OC President Jim Hamilton and other
College officials, donors, industry and community members,
students and alumni in a ribbon cutting ceremony.
The new 1,250 square-metre (13,450 square-foot) centre can
accommodate about 150 students per year in Carpentry,
Welding, Electrical, Plumbing and Piping, and Women in
Trades programs. The centre will also bring trades students
back to campus who were previously training at leased
facilities near the Vernon airport. It was constructed to meet
the minimum Leadership in Energy and Environmental Design
(LEED) Gold standard, building on the college’s commitment
to delivering highly sustainable facilities.
On Aug. 20, 2018 , College officials, students, industry partners
and community members gathered at the Penticton campus to
mark the opening of OC’s new $2.2-million, 465-square-metre CampOC offers youth an opportunity to explore the trades.
(5,000 square ft.), welding facility. Among them was a class of
Page 22Okanagan College
2018-19 – 2021-22
Key Directions - Supporting Learner Readiness and Success Accountability Plan and Report
Okanagan College Enactus students take win big at the national championships in Vancouver.
PROGRAMMING SUPPORT EXPERIENTIAL LEARNING
OC’s wellness program, Flourish, which launched at the Trades, Technology, Aviation
Penticton campus in 2017 was off to a strong start as students
In June 2018, an Okanagan College-trained carpenter was
returned to the Penticton campus in fall 2018. Flourish is a drop-
recognized among the best in the country at the Skills Canada
in safe space led by Penticton Counsellor Sarah Lefebure. The
National competition (SCNC). Lukas Pfob, a Level 4 Carpenter
weekly sessions, called Wellness Wednesdays, were offered
apprentice, brought home the silver medal in the carpentry
free of charge to all OC students and explore themes related
competition at SCNC, which took place in Edmonton on June
to stress management and mental wellness. Flourish also
4-5.
facilitated Flourish with Yoga classes on Thursdays, which were
open to students and employees alike. The project started last The challenge required competitors to build an intricate play
September fueled by an Innovation Fund grant (the College’s house from scratch in just 12 hours spread over the course of
internal grant for innovative new programs and initiatives). In two days. The medal was his first at Nationals and fifth overall
2018-19, Flourish is supported by the Campus Life fund. at Skills Canada competitions, including consecutive gold
medals at Provincials the past two years. Pfob was joined
Another successful Long Night Against Procrastination was
by two other OC students at Nationals. Vernon’s Bradley
held at the Penticton campus on Nov. 22, 2018 where more
Vanlerberg competed in the Aerospace Technology category
than 50 students buckled down from 9 p.m. – 2 a.m. to finish
and Kelowna’s Conner McLaren competed in the Automotive
major school projects, homework and studying, supported
Service category. All three students won gold at the Provincial
by faculty and staff. The event gives students mind-breaks
Skills Canada competition on April 18, 2018.
throughout the evening with prize draws, pizza, coffee,
snacks and stress-busting activities. The event happens every
semester, approximately two weeks before the end of term.
Page 23Okanagan College
2018-19 – 2021-22
Key Directions - Supporting Learner Readiness and Success Accountability Plan and Report
BUSINESS AND FOOD, WINE their skills. Chef Yannick LaSalle of Restaurant Les Fougeres in
& TOURISM Chelsea, Quebec took home the title and was quick to thank
his team of OC students.
Neither freezing temperatures nor strong competition from
some of the top business schools in the west could stop “At the moment I cannot explain how proud I am of the team,”
Okanagan College Business students as they cruised to four LaSalle said in a media interview. “I just know the team and
podium finishes at Enactus Western Canada Regionals in students worked really hard and they deserve every moment
February 2019. of this celebration.”
During a competition in which no other school was victorious Students reveled in the opportunity to cook alongside and
in more than one competition, OC took the top spot in learn from the best.
three challenges – the CWB Financial Education Challenge, OC Culinary student Sevynn Bigattini, a Grade 12 dual
the Scotiabank Environmental Challenge and the TD credit student from Mount Boucherie, was interviewed by
Entrepreneurship Challenge. The College also notched a the Kelowna Capital News on her experience. She worked
runner-up showing in the Scotiabank Youth Empowerment alongside chef Elia Herrera of Toronto’s Los Colibris Cocina
Challenge. The College faced teams from 20 other institutions Mexicana. The College also played host to the CCC’s
– more than 400 students participated in total – during the second event, the Black Box Competition, which took
two-day event, which took place from Feb. 28 – March 1, 2018 place in OC’s kitchens in the morning and afternoon on
in Calgary. Feb. 2.
OC third-year Business In October, OC Enactus students
Administration students Nico recently returned from a two-day
Dirksen, Nathan Ziebart and Silicon Valley tech tour and a
Cooper Simson competed two-day experience at Enactus
against 30 student teams at World Cup in San Jose, CA, USA.
the February 2019 Scotiabank OC School of Business Professor
Canadian Case Challenge at and OC Enactus Advisor Mark
Vanier College in Montreal and Ziebarth organized the Silicon
earned a well-deserved bronze Valley tech tour which saw
place. The Scotiabank Canadian students take exclusive tours,
Case Challenge is considered attend a talk at Netflix, join
one of the most challenging an intimate chat with visionary
collegiate competitions in the Luminate Health Co-CEO Shally
country and sees students Madan, check out the Google
analyze a case problem over just campus, Apple Park, Intel
three-and-a-half hours. Students Museum and join a Tesla cruise
were required to combine led by one of the company’s
business strategy, marketing and engineers. After the tech tour,
management knowledge and students attended the Enactus
present their recommendations World Cup where they got to
to a panel of industry experts. hear from keynote speakers –
The team was coached by including Condoleezza Rice –
OC Business professors Mark and take in cultural events with
Ziebarth and Blair Baldwin. students and faculty from across
Eleven of Canada’s top chefs 36 countries. Students also
competed in the Canadian Culinary student Sevynn Bigattini works alongside chef Elia took part in workshops, faculty
Culinary Championships Herrera of Toronto’s Los Colibris Cocina Mexicana. research sessions and got to
February in Kelowna, vying for learn about projects taking place
the title of Canada’s best chef. The chefs battled through three across the globe. OC Business Professor and OC Enactus
rounds of culinary challenges but they didn’t do it alone – they Advisor Dr. Kyleen Myrah was selected as one of just six faculty
each received a helping hand from their own team of OC to present at the inaugural academic leaders forum.
Culinary and Pastry Arts students who impressed the chefs with
Page 24You can also read