Achievement Challenge: Far North Community of Learning - Ministry of Education
←
→
Page content transcription
If your browser does not render page correctly, please read the page content below
Achievement Challenge: Far North Community of Learning
Our aim is to maximise the achievement of valued outcomes
for taitamariki through community collaboration.
Context
The ‘Far North’ or ‘Te Hiku’ district is one of New Zealand’s earliest inhabited areas, with a
proud history, sweeping and beautiful landscape, and a rich heritage of peoples and
activities. The five iwi of ‘Te Hiku o te Ika’ (the tail of the fish) are
,N . Te Hiku has a population of about 22,000 people,
which accounts for about forty per cent of the whole Far North District. Centred on
Kaitaia, Te Hiku extends from Te Rerenga Wairua (Cape Reinga) down to the North
Hokianga harbour in the west, and south as far as Mangonui on the East coast. Te Hiku
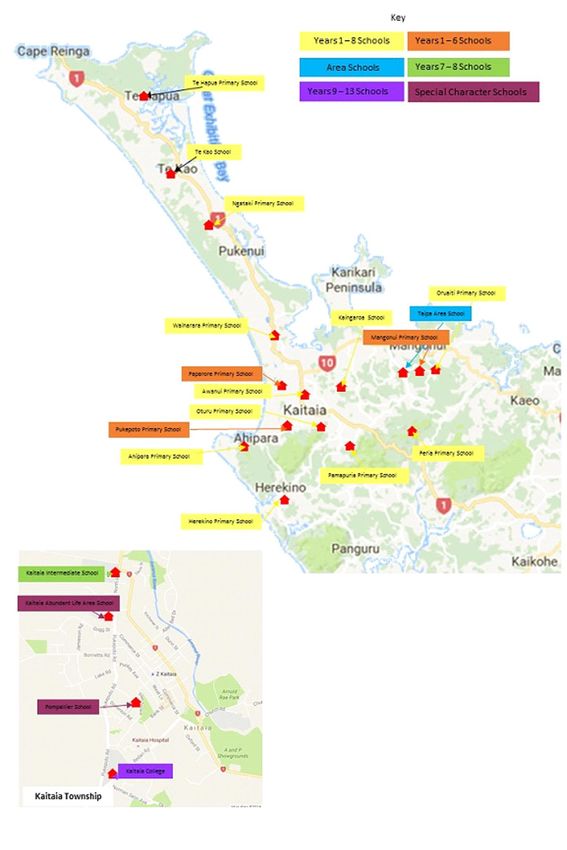
also includes Kaeo, linked historically as a special interest area. A map of Te Hiku is
presented below, also showing the distribution of our schools.
The Far North Community of Learning (FNCoL) comprises twenty schools, of which three
include secondary level students: one of these is a Secondary school, one is a Composite
Area school and the third is a Composite, State Integrated school. Of the remaining
seventeen, a large number (12) are Full Primary schools, including one State Integrated.
One Intermediate and four Contributing primary schools make up the group.
Many of our schools are relatively isolated and significant numbers of students are from
remote rural schools. Driving distance from our northern-most school (Te Hapua) to
Herekino in the southwest is 126km; or from Te Hapua to the south-eastern most school,
is about 160 km (2 ¼ hours). Thus the combination of school size and geographical
isolation is a significant feature for us to consider.
Of positive help, however, is the fact that ten schools within the CoL have worked for the
past three years as part of the Muriwhenua Learning Change Network (LCN) and have an
established a culture of working collaboratively. We see this as a significant enabling
factor as we begin the work of this CoL together, anticipating that the early learning from
FNCoL Achievement Challenge Page 1this group will serve as a positive starting place for effective collaboration amongst the whole group. Our Learners The total number of students in the CoL schools is about 3100: with an estimated 1900 in primary school phase (up to year 8) and the remainder (1000) in the secondary stage. The average size for all our primary schools is 88 students, with the full primary schools being slightly smaller (81). Te Hiku has a larger proportion of Mā ori than nationally. About seventy percent of our learners are Mā ori, with fewer than national average being of ethnicities other than NZ European, which category makes up most of the remaining thirty percent. The ‘Summary Table’ in the Appendix gives further breakdown of schools by type. Considering the wider community, the Far North is characterised by high levels of unemployment and teen births, low wages and poor health issues, and is over represented in most social deprivation statistics. Students overall, including Mā ori students, are not achieving as well as students nationally in relation to both National Standards and National Certificate in Educational Achievement (ERO, 2016). This ERO Report for our CoL also identified student retention rates, high rates of suspension and exclusion (in some schools), high staff turnover, high student transience, lower ECE participation rates, and school size and geographical isolation as significant factors for us to consider. One key challenge for schools in our unique context is the recruitment and retention of effective teachers. Complexities attached to our context, in particular our geographical isolation, perhaps often combined with a pessimistic perception of the rohe by those who have not lived here, make recruitment of staff difficult; and retention, for periods longer than three years, the exception rather than the norm. In contrast to these challenges, which the ERO Report also notes, there is a strong sense of identity and belonging provided by whā nau connections, and the community values of ngatanga and manaakitanga, which are also seen as strengths. Similarly the Make it Happen Te Hiku report (Ministry of Social Development, 2014), based on extensive community consultation, identified five key aspirations for the community. The report FNCoL Achievement Challenge Page 2
identifies five community-wide visionary outcomes as: “culturally strong and proud;
peaceful, safe and connected; prosperous and progressive; clean and has a sustainable
environment; and healthy and well” (p. 6). In accord with such positive aspirations, and
with the New Zealand Curriculum aim, to generate young people who will be confident,
connected, actively involved life-long learners (MoE, 2007), the Far North Community of
Learning aspires to work collaboratively amongst our schools so as to improve learning
outcomes for our young people.

In this collaborative effort we see contributions from other community stakeholders as
pivotal to our success. In particular our partnership with the iwi of the Muriwhenua – Te
Rarawa, Te Aupouri, Ngai Takoto, Ngā ti Kuri and Ngā ti Kahu – are seen as crucial in
overcoming the challenges attached to whā nau engagement, contextualising the
curriculum and fostering stronger cultural identity and pride within our rohe. In addition,
Far North REAP has aims compatible with the CoL and has expressed a commitment to
work with us. Although we have not finalised our working arrangements with the ECE
sector in the far north, a widely representative group of leaders from the sector have
worked collaboratively since 2012, and are well placed to contribute towards improving
successful transitions and other issues relating to successful well-being and learning for all
children prior to school age. We intend to keep local ECE institutions appropriately
involved and to communicate with them throughout the journey.

Learning Needs
We believe that barriers to student well-being in our region, such as the deprivation
issues mentioned above, are impacting significantly and negatively on student
achievement generally; perhaps more so than in many other regions. We feel strongly
that we must incorporate into our work some focus on aspects of student well-being that
are likely to help reduce such barriers as we simultaneously embark more directly on
addressing our student achievement challenges. We think that also focussing on a culture
of well-being throughout the CoL is likely to enhance our endeavours to raise student
achievement. We see student, and whā nau, engagement as important components of
improving student achievement; and therefore as likely key strategies. We think both of

FNCoL Achievement Challenge                                                         Page      3
these may be within the scope of schools to influence, and that this component of
student well-being reinforces a sense of commitment to our purpose.
From the Starpath Project in one of our secondary schools we are aware of the Academic
Counselling model. We understand that it has had some success and intend to extend
this model, although we also wish to build on it to ensure that the quality of those
conversations is more likely to become effective and genuinely ‘agentic’ for the students.
We therefore challenge ourselves to support the development of a culture of wellbeing
throughout the Community of Learning, which we believe will enhance our other
endeavours to raise student achievement.
In conjunction with this focus on well-being we intend to directly address our
achievement challenges through professional learning, sourced according to the needs of
schools identified by our CoL leaders and teachers, and provided and led by them; or
possibly by external providers as recommended.
Our analysis of achievement data in National Standards and in NCEA has highlighted:
National Standards achievement data (measured as percentage of students
achieving At or Above) is significantly and consistently lower than national
averages (over the last two years; 2013-14)
National Standards writing achievements (of students achieving At or Above) as
significantly and consistently lower than for reading and mathematics (over the last
two years); by an average of nearly 8%
Our trends in National Standards writing are not improving either and the most
recent trend may even be slightly negative1
Schools have reported in 2015, a wider range of percentages of students At or
Above standard for writing than for reading or mathematics (30 – 80%; a 10%
wider range).
Roll based NCEA data is consistently lower than the national average over the last
three years. Level 3 and UE performance has an average disparity, when compared
1 Subject to final confirmation of 2015 data, however that is mostly completed now.
FNCoL Achievement Challenge Page 4nationally, of 20%. Level 1-2 results also fall well below the national average with
Level 2 results in 2015 falling almost 20% short of the BPS target.
Overall NCEA trends indicate little to no shift in the disparity that currently exists
between overall results in the FNCoL vs. National and the results of our Mā ori
tamariki compared to other disaggregated groups.
ECE participation rates seem to be improving slightly, although these remain
below the national average
[Charts underpinning this analysis are included in Appendix 1]
Following from these analyses, and from our work in student agency through the LCN
schools, and in view of our community’s aspirations to maximise the achievement of
valued outcomes for taitamariki through community collaboration, we believe that we can
make the most difference by prioritising our efforts on students’ writing, (at primary and
perhaps early secondary levels), and on raising achievement at NCEA Level 2. We believe
we will be able to improve NCEA (Level 2) achievement through better aligning our
curriculum to meet student aspirations and career pathways. Simultaneously we intend to
strengthen student engagement by continuing to foster greater student agency within
our schools, and to strengthen whā nau engagement by further enhancing our shared role
as key partners in supporting the learning and career pathways of our taitamariki.
Inclusive of three achievement challenges underlined above – we commit to add a fourth
challenge in 2018 once we have worked to embed the first three in 2017. These
Achievement Challenges are described in detail in the next section.
Achievement Challenges
As outlined above, from the work of ten of our schools within the LCN, and from the ERO
Report on FNCoL, and from student achievement data supplied by the Ministry, our
recent meetings have identified three main areas that we believe have the potential to
maximise valued student outcomes. These are formulated below. In addressing these
challenges we think it is important to emphasise the following points:
The context within which we intend our challenges to be addressed is one cognisant
of student well-being; best addressed through student and family engagement
FNCoL Achievement Challenge Page 5 Because we are a large community of schools, we think this implies the need for
somewhat ‘higher level’ goals; ones which allow some degree of adaptation at the
level of individual schools. Thus we identify, for example, ‘all writing’ as a focus, even
although for the CoL schools on average this is likely to be more pertinent for Mā ori,
or for boys, (or both). We intend that schools will examine their own writing
achievements in detail and may adopt such specific goals as appropriate, without
departing from the overall focus on writing. Goal progress would nevertheless be
measured across the whole CoL.
We have selected the end of 2019 as our target date to allow three full years for this
work to have an effect and for changed practices to become embedded; implicit in
our goals is learning for everybody involved. We need to ensure time for this to
happen. Our aim is to “learn fast in order to implement well under a variety of
conditions and contexts.”2. Nevertheless we expect improvements to become evident
sooner than 2019 and have included Interim Targets for monitoring progress
throughout the period.
We see this process as being based on an ‘inquiry cycle’ model such that we will
evaluate effectiveness of initiatives from the outset and adapt our work accordingly.
For instance in our efforts to improve NCEA Level 2 attainment rates, we expect to
monitor the effects of curriculum re-alignment work and student engagement
regularly to ensure that we can reach our targets
Achievement Challenge 1:
The intent of Achievement Challenge 1 is to influence student achievement at an
overarching level by:
carrying out a community-wide review of challenges posed by students’
disengagement in learning in the Far North CoL
identifying factors which contribute to positive student agency specific to the Far
North CoL schools
2 Quoting Anthony Bryk of …Downloaded from http://er.aera.net on June 15, 2016
FNCoL Achievement Challenge Page 6 using the review data and deliberate use of student voice to re-examine our
curriculum and align it closely with the needs of the community
The central question surrounding Achievement Challenge 1 concerns the influence of
teaching on emotions, motivations, mindsets, and behaviours that we associate with
student agency.
“Agency is the capacity and propensity to take purposeful initiative – the
opposite of helplessness. Young people with high levels of agency do not
respond passively to their circumstances; they tend to seek meaning and act
with purpose to achieve the conditions they desire in their own and others’
lives.” (Ferguson, Phillips, Rowley & Friedlander, 2015).
Achievement Challenge 1 is overarching of all our efforts to raise and influence student
achievement, affecting all other areas of student learning processes. In line with current
literature we see the notion of student engagement and student agency, as multifaceted
and complex, but at the same time quantifiable and measurable. Evidence presented by
Russell Quaglia shows that when students believe they have a voice and that teachers
listen and learn from them, they are significantly more academically motivated. In saying
this Quaglia also found that 53% of the students who participated in the research felt like
they didn’t have a voice in decision making at school (Quaglia, 2014).
The 2010 Education Review Office report on Promoting Success for Māori Students
recognises the notion of engagement as a key factor that promotes success for Māori
students. High performing schools that maintained high levels of engagement
implemented a variety of initiatives to engage Maori students in learning (Education
Review Office, 2010). Achievement Challenge 1 seeks to understand and inform what
these factors should be for schools across the Far North CoL.
Quantifying Measurement of Student Agency within the CoL
While we can reliably measure achievement outcomes through summative and formative
assessment methodology, there is growing agreement that standardised testing of
academic skills provides incomplete measures of the important things that students learn
from their teachers. (Ferguson, Phillips, Rowley & Friedlander, 2015). Evaluating the
engagement of students and teachers provides rich data to identify and explain trends
FNCoL Achievement Challenge Page 7and issues in school. The results can be used to inform and guide improvement at the
school, year, subject or student levels (University of Canterbury, 2016).
Ferguson, Phillips, Rowley & Friedlander (2015) present evidence that untested learning
outcomes are measureable and specific components of teaching influence them in
nuanced and interesting ways. In the New Zealand context such measures can be found
in the Me and My School Survey (NZCER) which is used to seek student’s views on their
engagement in school and learning. The Centre for Evaluation and Monitoring at
Canterbury University provide a range of tools to assess student and teacher engagement
for Year 7-13 students. From an international perspective, the 7Cs of Effective Teaching is
an evidenced based tool to help schools gather student ratings of teaching quality. The
7Cs of Effective Teaching is found to be a good predictor of achievement gains, and
student ratings of teaching quality were found to be more reliable than either test score
gains or classroom observations by trained professionals (Ferguson, Phillips, Rowley &
Friedlander, 2015).
Achievement Challenge 1 provides a very strong rationale and purpose for positively
influencing students’ learning journeys through the CoL. Schools in our Muriwhenua LCN
made good progress with their focus on increasing student agency and we wish to build
on that success with the other schools now collaboratively working together in the Far
North CoL.
Goal 1: To strengthen students’ engagement with their schooling.
Target 1.1: Increase student agency in the learning process through:
1.1.1 identification and evaluation of factors which contribute to positive student
agency across FN CoL schools
1.1.2: deliberate and planned use of factors which contribute to positive student
agency including the use of student voice
Target 1.2: Improve the degree of alignment of curricula with student pathways.
FNCoL Achievement Challenge Page 81.2.1 Simultaneously re-examine our curriculum, with the intent of aligning it more
closely with the needs of the community, and with the voice of our tamariki
We expect that this goal will entail – for many leaders, teachers, and whā nau – significant
learning about the wide field of student engagement, and how to measure it, as we work
to improve it.
Actions towards targets in 2017/18:
We will undertake a community-wide review of challenges posed by attendance rates;
whā nau engagement with student learning; key student transitions between ECE, schools
and tertiary institutes; learning pathways; and transience. We will do this through the
accumulation of shared knowledge to create a baseline of understanding in the field of
student agency, to influence widespread pedagogical change. In 2017 and 2018 we will
do this by:
2017 Actions to Achieve Targets
Term: Action:
1 With the support of relevant literature - all EC centres and schools will
develop a collective understanding of the notion of student agency with
their staff through critical conversation – and capture their journey in a
narrative.
All schools will complete the NZCER – Me and My School Survey – and carry
out a school and community wide evaluation of the results.
The CoL will form a student reference group to seek views of student
engagement and capture the outcomes in a narrative.
Appoint CoL Leader by the end of Term 1
Once the Leader is appointed the CoL will host a ‘launch’ event at Kaitaia
College with all teachers and leaders. The event will emphasise student
FNCoL Achievement Challenge Page 9agency as a key lever to raise achievement in writing and NCEA Level 2
2 On the basis of the student agency data gathered in Term 1, the CoL will
complete a GAP analysis to establish the steps required to ensure
widespread pedagogical change and the development of positive student
agency in each school.
On the basis of the GAP analysis - the CoL will form up a CoL PLD
application to complement the steps required for widespread pedagogical
change.
Linked to CoL PLD application above – the Col will seek to complete a
workshop with NZCER focused on the purposeful use of engagement and
learning data generated by Me and My School Survey – and to increase the
overall evaluative capability of the CoL.
Appoint CoL Lead teachers – and link their work to the strategic goals of the
CoL (see GAP analysis and related plan). Ensure strong and ongoing support
is in place for these roles.
As an initial task to induct and mobilise Leaders Across Schools – the
teachers will form and facilitate Professional Learning Clusters across the CoL
with Leader Within teachers. These teachers will focus on building the
capacity of teaching pedagogy related to positive student agency. The
clusters can be supported by the MOE Student Achievement Function
Practitioner aligned with the CoL.
CoL progress update – CoL Leads and school leaders will complete a
midpoint evaluation of progress gained and barriers encountered - including
an interim assessment of data in writing and NCEA.
3 The CoL will host a conference for all teachers and leaders with an emphasis
on the development of student agency to influence achievement. Speakers
and workshop leaders to be confirmed. The conference will ensure case
studies from CoL teachers and leaders, who are experiencing strong
pedagogical shifts, are shared with participants to influence change.
FNCoL Achievement Challenge Page 10 The CoL Leader and Leader Across teachers will begin a curriculum re-
examination based on the data and learning opportunities described above –
with a focus on pedagogical approaches required to influence positive
student agency and achievement gains.
4 Re-evaluate CoL base line data that informed the initial GAP analysis to
assess shifts in knowledge, understanding and application in the classroom.
Cut this re-evaluation with an analysis of CoL achievement in writing and
NCEA Level 2 to assess trends as influenced by pedagogical change across
the CoL.
An action plan for curriculum change will be distributed for critique to all
CoL schools in preparation for implementation in 2018 – and to signal
potential shifts in strategic planning for schools.
A CoL PLD application will be submitted for the 2018 academic year based
on above evaluation.
2018 Actions to Achieve Target
Term: Action:
1 Implement the action plan described above across all CoL schools to further
build capacity of teaching pedagogy and specific skills to raise achievement
in writing, NCEA 2, *and the addition of a further academic based
Achievement Challenge determined by achievement data in 2018 (see
comment under Achievement Challenge 4 on page 13 below).
Beginning of Year CoL launch event celebrating progress from 2017, and
signalling goals and direction for the following year.
2 Implementation of PLD across CoL
Ongoing work according to action plan
Progress update – CoL Leads and school leaders complete a midpoint
FNCoL Achievement Challenge Page 11evaluation check of progress gained and barriers encountered – including an
interim assessment of data in writing and NCEA
3 The CoL will host their annual conference for teachers and leaders with an
ongoing emphasis on needs and aspirations expressed through evaluation.
Speakers and workshop leaders to be confirmed. The conference will
continue to ensure case studies from CoL teachers and leaders, who are
experiencing strong pedagogical shifts, are shared with participants to
influence change.
Ongoing work according to action plan
4 Re-evaluate CoL base line data that informed the action plan to assess shifts
in knowledge, understanding and application in the classroom. Cut this re-
evaluation with an analysis of CoL achievement in writing, NCEA Level 2 and
other priority curriculum areas to assess trends as influenced by pedagogical
change across the CoL
Continue ongoing inquiry loop as carried out over the previous two years
Achievement Challenge 2:
Students’ writing stands out as the weakest achievement area, on average, across our
schools; the top three challenges against National Standards for this CoL all pertain to
writing achievements (see Appendix, Figure 2). To improve this situation we have set the
following goal.
Goal 2: To lift the achievement of all students in writing.
Target 2.1: To lift the achievement of all students in writing from
65.4% (1121/1714)3 to 85% (1457/1714) at or above expected level by the end of
2019. This goal will therefore be focused on approximately 336 students4.
Actions towards Target 2.1: We anticipate that progress towards this goal may
not be linear, given that teachers and schools, as well as whā nau, may need time
3 These figures are based on final published data for 2015 and differ slightly from Figure 2.
4 This number is likely to change also over the years ahead, according to enrolment levels.
FNCoL Achievement Challenge Page 12to learn new skills for improved focus on students’ writing. Interim targets will be
used and are set out in Table 2.
Achievement Challenge 3:
While Level 3 and UE results currently lag significantly behind national averages, we feel
that Level 2 achievement is the gateway to further opportunities in employment,
education and/or training and, as such, needs to be an explicit focus of our kura.
Goal 3: To lift achievement at NCEA Level 2.
Target 3.1: To increase the percentage of all school leavers gaining NCEA Level 2
from 67% (2015) to 85% by the end of 2019.
This goal is expected to focus on approximately 90 students (2014 numbers).
Achievement Challenge 4:
* The FN CoL wants to commence its collaborative efforts in 2017 with a focus on the
three Achievement Challenges described above because of the extent of work required to
implement Achievement Challenge 1 - to make the significant pedagogical shifts required
across all schools to influence widespread change. The CoL will add a further
Achievement Challenge after the first 12 months of implementation of this plan to include
a fourth Achievement Challenges from 2018 onwards. The fourth Achievement Challenge
will be academic based and informed by 2017 achievement data.
Measurement of Achievement Challenges
In writing we will use National Standards data, especially the combined percentage
for students At and Above (and the corresponding percentage of Below and Well
Below) but also further analysis as appropriate. Initial analysis of the 2015 data
identifies the distribution of our tamariki across the CoL, school by school (See Table
1 below).
At years 9 and 10 we anticipate the identification of a suitable tool for measurement
of progress in writing. We will be investigating possible use of the PaCT tool.
FNCoL Achievement Challenge Page 13 Goals related to NCEA will be measured on roll-based statistics within the rō pū . Our
definition of 85% achievement includes all disaggregated groups, including Mā ori
and Pasifika, achieving at or above this level.
Indicative measures for engagement (and agency) are of interest in our CoL and we
intend to continue to explore options here, including student surveys, observation
and attendance data as well as pastoral data. We wish to utilise existing tools (such
as, for instance, the NCER survey) for measuring student engagement and will begin
by establishing baseline data. This will require some (rapid) investigation and
adoption of suitable tools, for the start of 2017.
We are aware of measures used in the Starpath project for the ‘Academic
Counselling’ meetings (at secondary schools) and will consider ways to adapt those
for use in our ‘Pathways’ meetings. Measurement would be via student and whā nau
surveys and qualitative data.
We intend to also develop interim (proxy) measures (e.g., use of e-asTTle) if needed,
to allow students, teachers and whā nau to have more up-to-date (indicative)
information about expected future achievements; especially where other measures
tend to be more summative (e.g., final external papers for NCEA subjects). We wish to
know how students’ learning is progressing before it is too late to help.
Key Data
National Standards data for each of our primary and intermediate schools has been
gathered from 2015 and is presented in Table 1 below. The purpose of the table is to
identify the distribution of our target students: those currently attaining a ‘Below’ or ‘Well
Below’ standard in writing, across years 1 to 8.
NCEA achievement data will be the focus for Goal 3.
FNCoL Achievement Challenge Page 14Table 1: Distribution of Target Students across schools for National Standards Writing,
2015
Total Total Maori Male
Students Numbers Students Students Students in Yr Students in Yr
(Yrs Below or Well Below or Well Below or Well 1-4 Below or 5-8 Below or
1
School Name 1 – 8) Below Below Below Well Below Well Below
Abundant Life Sch. 120 24 15 15 8 16
20.0% 18.5% 25.4% 13.1% 27.1%
Ahipara School 214 50 47 36 19 31
23.4% 28.1% 29.5% 16.7% 31.0%
Awanui School 43 30 30 20 16 14
69.8% 71.4% 80.0% 61.5% 82.4%
Herekino School 26 18 18 14 12 6
69.2% 69.2% 66.7% 80.0% 54.5%
Kaingaroa School 84 40 21 30 26 14
47.6% 52.5% 75.0% 65.0% 35.0%
Kaitaia Intermediate 182 56 43 37 0 56
30.8% 30.9% 43.0% 0% 30.8%
Mangonui School 164 68 40 50 43 25
41.5% 43.0% 54.3% 40.2% 43.9%
Ngataki School 26 8 X X X X
30.8% X X X X
Oruaiti School 61 36 22 20 12 24
59.0% 62.9% 80.0% 52.2% 63.2%
Oturu School 142 63 63 43 24 39
44.4% 44.4% 54.4% 33.3% 55.7%
Pamapuria School 115 36 28 23 10 26
31.3% 33.3% 38.3% 18.5% 42.6%
Paparore School 159 36 32 23 21 15
22.6% 27.1% 26.7% 19.4% 29.4%
Peria School 41 19 14 11 11 8
34.1% 63.6% 57.9% 61.1% 34.8%
Pompallier Catholic 150 36 20 27 13 23
24.0% 23.0% 33.8% 17.3% 30.7%
Pukepoto School 52 22 22 14 16 6
42.3% 43.1% 50.0% 44.4% 37.5%
Taipa Area School 81 37 33 23 14 23
45.7% 47.1% 59.0% 48.3% 44.2%
Te Hapua School 26 8 X X X X
30.8% X X X X
Te Kao School 14 3 X X X X
21.4% X X X X
Waiharara School 14 3 X X X X
21.4% X X X X
Note. 1 This is the total number of assessed students, as at 1/11/15, x=Data has been Redacted
FNCoL Achievement Challenge Page 15What is our plan of action?
To successfully address these challenges we have summarised our overarching strategies
as:
1. Employ our best leaders and teachers into the new FNCoL positions to design and
share good practice effectively across the schools so as to improve valued student
outcomes in our Achievement Challenge areas.
a. Recruitment and retention was earlier identified as a key challenge related
to our context. As such, there is a strong feeling from all of our kura within
our roopu that this needs to be factored in, by ourselves and by the
Ministry, prior to the commencement of the FNCoL’s work. Boards are
concerned that they will find it incredibly difficult to recruit staff to replace
any specialists used by the CoL. This challenge alone may lead to some of
our kura opting to remain outside of the CoL if we cannot address it. As a
roopu we believe we need to consider:
i. Providing some level of enticement for teachers looking to transfer
to our rohe as a result of CoL needs. This could take the form of
removal expenses, a one off recruitment payment, a longer (3 year?)
tenure for replacement teachers, and/or some form of regular salary
increase.
ii. Providing the CoL with the flexibility to re-conceptualize the
resourcing when releasing teachers is undesirable. This may take the
form of providing the CoL with funding, rather than FTTE, to engage
a provider with the work between schools.
2. Working collaboratively as a community to share knowledge and resources so as to
allow CoL students equal opportunities and to improve outcomes in our Achievement
Challenge areas; particularly through:
a. partnering with key community stakeholders, such as iwi and the wider
commercial sector, to accelerate progress as a collective,
FNCoL Achievement Challenge Page 16b. strengthening cluster-wide alignments of certain measures to help ensure
consistency of those measures,
c. strengthening cluster-wide links between primary, intermediate and
secondary schools, through communications and systems to improve
student transitions between schools,
d. strengthening links with our local ECE sector to improve student transitions
into schools, and to discuss and share good practice in writing, as relevant
to ECE, as this develops,
e. strategically targeted supportive interventions, determined through well-
aligned baseline data for individual schools,
f. recognising and celebrating student and school successes,
g. maintaining open and full communication with the wider community,
including interested agencies, using available media and processes.
3. Building on the ‘student agency’ focus already begun by several of our primary
schools in the local Far North LCN. At this stage we see ‘agency’ as guiding students
to be self-directed learners; through inclusive teaching that involves students knowing
the point of learning; and owning that learning, including the direction it is taking.
4. Improving engagement between schools and homes such that teachers will know
their learners and whā nau; working together through frequent targeted conversations
about the learning and its direction. Through such communication we intend that
families will understand that they have a significant influence on their children's
learning, and that communication and understanding will promote better student
engagement.
5. Teachers enquiring deeply into target students’ learning capabilities and challenges,
and sharing their findings (appropriately) within and between schools, as necessary,
to promote student learning.
6. Utilise the CoL leaders and team to identify and share best practice and to promote
the expertise necessary for teachers to facilitate learning in the achievement areas
and to better make accurate judgements (OTJs) against criteria for assessing progress.
FNCoL Achievement Challenge Page 177. Utilise the CoL leaders and team to promote the quality and strength of ‘pathways’
conversations (including academic and vocational) between students, whā nau, leaders
and teachers so that individual achievements are maximised and fit-for-purpose.
8. When and as necessary, to engage with external experts to increase the
organisational capacity and capability of the COL to accelerate outcomes for our
taitamariki.
Our Plans for Collaboration
We believe that our degree of success in this venture will be directly dependent on
genuine collaboration between schools, families and whā nau, and more widely with the
communities involved, to be facilitated by the CoL leaders, teachers and advisors. This will
be necessary at all levels of organisations, within and between those, as well as across
time and locations. We see collaboration as meaning that we will work together to realise
our shared goals. Our work together will be based on, and guided by, an open, shared
analysis of evidence and improvement strategies, in such a way that everyone involved
feels able to contribute and that they are being listened to. This analysis of evidence and
strategies will be contingent on genuine shared inquiry, robust testing of validity, and
honest and open sharing. In this way we wish to allow appropriate freedom for schools to
contribute to the goals in various ways, according to their particular circumstances. This
will require high quality communications throughout our work; and involve, and hopefully
build, high levels of trust.
We think it is important that the CoL operates as a ‘learning organisation’; that is to say
that we learn to address tough issues together, in an environment that promotes honesty
and thinking critically to resolve obstacles to student learning.
Successful collaboration will depend on strong communications. The inherent
geographical challenges will require particular attention. Our plan for communications
includes periodic group meetings, face-to-face small group or individual meetings, and
digital communication based around ‘Google Groups’ and ‘Google Docs’ software. We
recognise that significant travel between schools will also be required.
FNCoL Achievement Challenge Page 18We also recognise that there are already a number of structured and informal networks
which are contributing positively and we wish to work with and support any of those
which may be useful or appropriate.
This communication plan is ultimately intended to serve the students in our Community
of Learning, as well as other community participants, such that, so far as possible, we are
all aware of the direction and focus of our CoL in the ‘Te Hiku o te Ika’ (‘The Tail of the
Fish’).
Monitoring and Reviewing
We expect to develop, with our Col Leaders and between member schools, an on-going
monitoring and review system, based on an effective and shared peer review of our
efforts, in such a way that builds trust and promotes the evolution of shared professional
accountability for maximising the achievements and success of students in our region.
Improvements against National Standards in writing are likely to be non-linear because
new learning necessitated by collaborative work takes time (Robinson, 2011). We see this
crucial phase as the ‘joint work that challenges thinking and practices’ (Katz & Earl, 2010)
and therefore an important component of monitoring and reviewing progress towards
our goals will be the use of interim targets. At this stage the members of the working
group for the CoL think that interim targets such as those below (Table 2) could be
appropriate. We wish to review and finalise these once our CoL Leaders have been
appointed and before the work begins in earnest at the start of 2017.
Table 2: Interim Targets for National Standards in Writing
Year Percentage at or Approximate additional student Approximate total
End above standard by numbers in each year1 students At or Above
end of year (Cumulative Total) in that year2
2015 65% Baseline 1,121
2016 67% 27 (27) 1,148
2017 69% 34 (62) 1,183
2018 75% 103 (165) 1,286
FNCoL Achievement Challenge Page 192019 85% 171 (336) 1,457
Notes. 1. Based on 2015 data: total number of target students needed to reach 85% was 336.
2. Percentages calculated out of Total students in 2015: i.e., 1714
Finance
Subject to further confirmation as schools continue to meet and feedback into these
plans, it is the intention of the founding trustees to recommend that:
the Far North COL member schools will pool the $1000 funding allocation per
school and this combined fund be administered by Far North REAP.
the Far North CoL Governance group will be delegated by the members to make
financial decisions for the allocation of any such shared FNCoL funding towards
the Achievement Challenge goals (noting that Boards of Trustees of course retain
their own financial autonomy otherwise). We expect this would initially be a
potential combined pool of approximately $20,000 p.a. (20 schools pooling $1000
each) for set-up and establishment costs (including appointment processes during
2016).
Far North REAP will provide secretarial and physical resources to support the COL
wherever possible. Far North REAP will be paid an annual fee (to be agreed in due
course) for the provision of secretarial and financial administration services and the
hire of meeting and seminar rooms.
In principle, trustees will be able to be paid, as requested, a travelling allowance
(74 cents per km) and a meeting fee of $50 for meetings.
FNCoL Achievement Challenge Page 20References: Ferguson, R. F., Phillips, S. F., Rowley, J. F., & Friedlander, J. W. (2015). The Influence of Teaching Beyond Standardized Test Scores: Engagement, Mindsets, and Agency. Retrieved from The Achievement Gap Initiative at Harvard University website: http://www. agi. harvard. edu/publications. php. Katz, S., & Earl, L. (2010) Learning about networked learning communities, School Effectiveness and School Improvement, 21:1, 27-51, DOI: 10.1080/09243450903569718 Ministry of Social Development (2014) Make it Happen Te Hiku Accord: Community Action Plans for Outcomes Based Social Development. Wellington: Government Printer. ISBN 978-0-478-33590-3 [Downloaded March 2016: https://www.msd.govt.nz/documents/about- msd-and-our-work/newsroom/media-releases/2014/make-it-happen-report-april-2014.pdf] Ministry of Education (2007). The New Zealand Curriculum. Wellington: Learning Media. Education Review Office (2016). Kaitaia Community of Learning Report 2016. [Hardcopy by hand] Robinson, V. M. J. (2011). Student-Centered Leadership. San Francisco: Jossey-Bass. University of Canterbury. (2016). Attitude and Engagement Surveys. Retrieved October 16, 2016, from https://www.cem.canterbury.ac.nz/student-attitude-perception- questionnaire.shtml FNCoL Achievement Challenge Page 21
Appendix 1
[The following data and charts have been compiled with the assistance of the MoE.]

FNCoL Achievement Challenge                                                          Page   22
Table of Schools in FNCoL

                                                                    July Roll
Name                           Type                    Authority                  Decile
                                                                      2015
Ahipara School                 Full Primary            State          209*

Awanui School                  Contributing            State           46              2

Herekino School                Full Primary            State           28              3

Kaingaroa School (Kaitaia)     Full Primary            State           85              3
                                                       State:
Kaitaia Abundant Life School   Composite (Year 1-15)                  234              2
                                                       Integrated
Kaitaia College                Secondary (Year 9-15)   State          851              2

Kaitaia Intermediate           Intermediate            State          214              1

Mangonui School                Contributing            State          179              3

Ngataki School                 Full Primary            State           26              1

Oruaiti School                 Full Primary            State           70              2

Oturu School                   Full Primary            State          155              1

Pamapuria School               Full Primary            State          127              2

Paparore School                Contributing            State          157              3

Peria School                   Full Primary            State           50              3
                                                       State:
Pompallier Catholic School     Full Primary                           150              3
                                                       Integrated
Pukepoto School                Contributing            State           57              1

Taipa Area School              Composite (Year 1-15)   State          235              3

Te Hapua School                Full Primary            State           22              1

Te Kao School                  Full Primary            State           38              2

Waiharara School               Full Primary            State           13              1

FNCoL Achievement Challenge                                                     Page       23
Summary Table of Schools by Type
State: Grand Ave. Roll
School Type State Integrated Total (Type)
Composite (Year 1-15) 235 234 469 234
Kaitaia Abundant Life Sch. 234 234
Taipa Area School 235 235
Contributing 439 439 110
Awanui School 46 46
Mangonui School 179 179
Paparore School 157 157
Pukepoto School 57 57
Full Primary 823 150 973 81
1
Ahipara School 209 209
Herekino School 28 28
Kaingaroa School (Kaitaia) 85 85
Ngataki School 26 26
Oruaiti School 70 70
Oturu School 155 155
Pamapuria School 127 127
Peria School 50 50
Pompallier Catholic School 150 150
Te Hapua School 22 22
Te Kao School 38 38
Waiharara School 13 13
Intermediate 214
Kaitaia Intermediate 214 214
Secondary 503
Kaitaia College 851 851
Totals 2562 384 2946
Notes.
1. Roll number (2015) to be confirmed
FNCoL Achievement Challenge Page 24FNCoL National Standards Achievements: All students
Percentage of students At or Above standard 90
85
80
78.0 75.2
75
74.8
73.8
70 67.9 72.0
71.1
66.6 70.7 70.6
68.9
64.3
65
60
55
50
2013 2014 2014 NZ 2015
Reading Writing Maths
Figure 1: FNCoL 2013–15 and NZ national averages in 2014. Data for 2015 is incomplete and based on currently
available numbers.
FNCoL Achievement Challenge Page 25National Standards: 2015 achievement + required % to reach 85% by 2017
All maths
All writing
All reading
Māori maths
Māori Writing
Māori reading
Boys' maths
Boys' writing
Boys' reading
Girls' maths
Girls' writing
Girls' reading
0 10 20 30 40 50 60 70 80 90
Girls' Girls' Girls' Boys' Boys' Boys' Māori Māori Māori All All All
reading writing maths reading writing maths reading Writing maths reading writing maths
2015 % At or Above 81.3 75.8 73.6 67.3 54.3 68.1 71.1 61 67.8 73.8 64.3 70.6
Gain required to reach 85% 3.7 9.2 11.1 17.7 30.7 16.9 13.9 24 17.2 11.2 20.7 14.4
2015 % At or Above Gain required to reach 85%
Figure 2: FNCoL: Relative Challenge to reach BPS target. Summarises required gains across three areas, by three
demographics.
St u d ent s w it h NCEA Level 2
100
90
80
Percentage of Students
70
60
50
FNCoL
40
30 NZ national
20
10
0
2013 2014 2015
FNCoL 60 72.2 66.9
NZ national 71.6 75.4 75.8
Figure 3: NCEA Level 2 rates compared to NZ national
[Please note: Figures 4 – 7 containing school level NCEA data have been redacted]
FNCoL Achievement Challenge Page 26You can also read