Acquisition increases future earning capacity - YEAR-END REPORT 2021 - Eastnine

Page created by Michelle Hudson
 
CONTINUE READING
Acquisition increases future earning capacity - YEAR-END REPORT 2021 - Eastnine
YEAR-END REPORT 2021

Acquisition increases
future earning capacity

                       1
Acquisition increases future earning capacity - YEAR-END REPORT 2021 - Eastnine
Eastnine company highlights
        I             Baltic yields at Nordic risk levels                                             II                                                                       Solid market fundamentals
                                                                                                              GDP per capita (2015 = 100)
                                              • Portfolio of prime office properties in        140
                                                                                                                                                                                                                 • Superior growth prospects compared
                                                Vilnius and Riga with a yield of 4.8 %1,                                                                                                                           to the Nordics
                                                                                               130
                                                complemented by a strategy also                                                                                                              Nordics             • Business-friendly climate with top
                                                encompassing logistics properties              120                                                                                            & EU

                                                                                                                                                                                                                   rankings in ease of doing business
                                              • Nordic & international corporates are          110
                                                                                                                                                                                                                   index
                                                amongst largest tenants                        100
                                       Riga
                                              • Poland is evaluated as an investment
                                                                                                                             Latvia                                              Lithuania
                                                                                               90

                                                                                                     2015
                                                                                                            2016
                                                                                                                    2017
                                                                                                                               2018
                                                                                                                                          2019
                                                                                                                                                    2020

                                                                                                                                                                         2022E
                                                                                                                                                               2021E

                                                                                                                                                                                    2023E
                                                                                                                                                                                               2024E
                                                                                                                                                                                                         2025E
                                                market
                                    Vilnius

  1)    Earning capacity

       III                 Best-in-class ESG credentials                                             IV                                                                 Prudent financial risk profile
                                                                                                                   Net LTVP & Equity ratio (%)
                                              • 81 % of Eastnine’s gross property                     100                                                                                                        • Net LTVP of 45 % and the equity ratio
                    81%                         area is sustainability certified                       90
                                                                                                       80
                                                                                                                                                                                                                   of 58 %
             Certified properties                                                                      70
                                              • 26 % of financing is green                             60                                                                                                        • First loan maturity in September 2023
                                                                                                       50
                                                                                                       40
                                                                                                       30
                                                                                                       20
                                                                                                       10
                                                                                                        0

                                                                                                                             Q1 2020
                                                                                                                   Q4 2019

                                                                                                                                       Q2 2020
                                                                                                                                                 Q3 2020
                                                                                                                                                           Q4 2020
                                                                                                                                                                     Q1 2021
                                                                                                                                                                               Q2 2021
                                                                                                                                                                                         Q3 2021
                                                                                                                                                                                                   Q4 2021
                                                                                                                                                      Equity ratio
                                                                                                                                                      Net LTVP

                                                                                           2
Acquisition increases future earning capacity - YEAR-END REPORT 2021 - Eastnine
Strong Baltic economies
                    GDP-growth                                                         Inflation                                                   Property yield
%                                                              %                                                               %
10                                                             8                                                               8

 8                                                             7
                                                                                                                               7
 6                                                             6

 4                                                             5
                                                                                                                               6
 2                                                             4

 0                                                             3                                                               5

 -2                                                            2

 -4                                                                                                                            4
                                                               1

 -6                                                            0
                                                                                                                               3
 -8                                                            -1
-10                                                            -2                                                              2
   2018     2019       2020      2021P         2022P   2023P     2018          2019     2020       2021      2022P     2023P       2018    Q3      2019      Q3   2020    Q3    2021    Q3
                                                                                                                                    Q1              Q1             Q1            Q1

      Lithuania            Latvia                  Estonia              Lithuania              Latvia                Estonia          Office Estonia                     Office Latvia
      Euro                 Sweden                                       Euro                   Sweden                                 Office Lithuania                   Office Sweden
                                                                                                                                      Industrial Estonia                 Industrial Latvia
 1 Annual change                                                    1 Annual change                                                   Industrial Lithuania               Industrial Sweden
 Source: Eurostat, Swedbank economic outlook                        Source: Eurostat, Swedbank economic outlook                       1 Annual change
                                                                                                                                      Source: Colliers, Newsec
                                                                                               3
Acquisition increases future earning capacity - YEAR-END REPORT 2021 - Eastnine
Properties in Vilnius
•   Total of nine office        CBD-area                                     Parliament district      New town
    properties and one
    development project;                   S7-1                 3Bures-1,2    Vertas-1                           Uptown Park
    3Bures-4.
•   Fair value of EUR 389m,
    83 % of Eastnine’s
    property portfolio.
•   More than 120,600 sq.m.
    in existing buildings, on    S7-2                             3Bures-3                 Vertas-2
    average 13,400 sq.m per
    property.
•   Around 12,600 GLA
    sq.m. to be constructed.
•   High occupancy ~93 %
                                           S7-3                               Uniq

                                                  Project 3Bures-4

                                                            4
Acquisition increases future earning capacity - YEAR-END REPORT 2021 - Eastnine
Properties in Riga
•   Total of three office    Krisjana Valdemara street/City centre
    properties and two
    development projects;     Valdemara Centrs                       Alojas Biroji
    The Pine and Kimmel.
•   Fair value of EUR 81m,
    17 % of Eastnine’s
    property portfolio.
•   Around 22,600 sq.m.                                                              Project The Pine
    in existing buildings,
    on average 7,500                             Zala 1
    sq.m. per property.
•   Around 47,000 sq.m.
    to be constructed.
•   Low, but increasing
    occupancy ~74 %                                                                  Project Kimmel

                                                                5
Acquisition increases future earning capacity - YEAR-END REPORT 2021 - Eastnine
Property investment and tenants
                                                                                                                                                                                                            Vinted and
                                                                                                                                                                                                         Bentley Systems
                                                                                                                                                                                                           new tenants
                                                                                                                                                                                                          among top ten
Portfolio of uniquely high-quality office properties in the Baltics                                                  Tenant base consisting of recognised international corporates

                                                                                     13 properties                                                                                        Type            Country
                                                                                                                              Tenants              % of annual contracted rent
                                                                                        Directly owned                                                                                   (Industry)          (HQ)

                                                                                                                       1                                           26%                       Finance
                                                                                          143,200
                                                                                       Total lettable area
                                                                                                                       2                                     12%                               ICT

                                                                                                                       3                                 8%                                  Finance

                                                                                        EUR 470m                       4                                 8%                                    ICT
                                                                                   Value of property portfolio
             S7-2, Vilnius                   3Bures-1,2, Vilnius                                                       5                                4%                                     ICT

                                                                                                                       6                                3%                                   Finance

                                                                                                                       7                               2%                                      ICT
            Eastnine Vilnius               Value
                                                                                                      1                8                               2%                                      ICT
                                           83%
                               3                                                                1                      9                               1%                                     Legal
                                                                                            1
                                       2                                                    1                         10                               1%                                    Finance
                               3
                                                                                                                                    90.0%                                  Contracted rent by tenants
                                                                                                                             Economic occupancy rate
                                                                                                                                                                         Other tenants                 Top 10 tenants
                                                                                                                                   EUR 179                                  33%                           67%
                                                                                                                               Annual rent per sq.m.

        Value
        83%
                                   1                               Eastnine Riga
                                                                                                       Value
                                                                                                       17%                       EUR 27.3m
                                                                                                                                 Rental income 1

 1   Earning capacity
                                                                                                                 6
Acquisition increases future earning capacity - YEAR-END REPORT 2021 - Eastnine
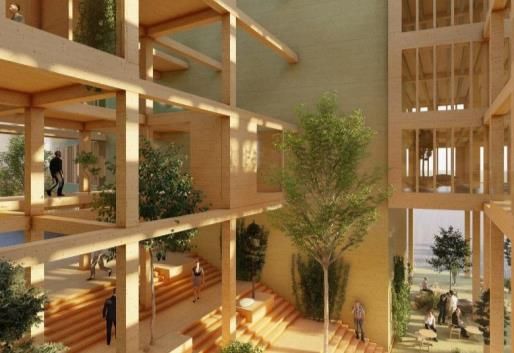
Other Investment I - Melon Fashion Group
                                                                                               Eastnine’s holding in        2021/        2020/
• Eastnine holds 36 per cent of the Russian fashion                                            MFG                        2021-12-31   2020-12-31
    retailer MFG.
• According to MFG’s preliminary IFRS-figures1 sales                                           Unrealised changes in
                                                                                               value, EURm                   42.5         12.4
    grew 49 % to RUB 37,498m (25,219) during 2021.
• EBITDA grew 38 % to RUB 8,642m (6,271) and the
                                                                                               Dividends, EURm               3.3           -
    EBITDA margin reached 23 % (25).
• E-com sales grew 42 % and amounted to 32 % (34) of
    total sales.                                                                               Total return, %               57.7         18.6

• The strong growth and EBITDA development for MFG                                             Eastnine’s share of
    open the way for divestment opportunities, which                                           MFG, %                        36           36
    can take the form of listing and may, depending on
    the state of the market, take place before the                                             Fair value of Eastnine’s
                                                                                               holding, EURm                121.8        79.3
    summer of 2022.
• Additional dividend of EUR 6.5m received in January                                          Proportion of
    2022.                                                                                      Eastnine’s assets, %         18.7         15.8
1MFG earnings for the full year 2021 have not been published at the time of
publication of Eastnine’s year-end report. For this reason, preliminary IFRS figures are
used as the basis for Eastnine’s report as relates to MFG.
                                                                                           7
Acquisition increases future earning capacity - YEAR-END REPORT 2021 - Eastnine
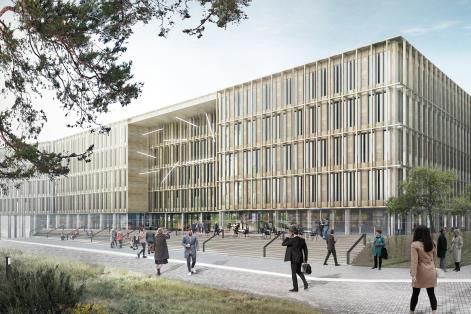
Other investment II – EC Baltic Property fund II
                                                               Eastnine’s holding in        2021/        2020/
• Eastnine indirectly holds 39 per cent of East Capital        East Capital Baltic        2021-12-31   2020-12-31
  Baltic Property Fund II (ECBPF2).                            Property Fund II
• The fund owns three properties in Tallinn, Estonia.
• ECBPF2 is prolonged until May 2022.                          Unrealised changes in
• One property was divested in December 2021. After            value, EURm                   1.1          1.0
  redemption of fund units, Eastnine received                  Dividends/Realised
  repayment of EUR 5.3m.                                       change in values, EURm        1.8          0.6
• Remaining three properties have been sold, and
  Eastnine expects to receive repayment of the                 Total return, %               13.1         7.6
  investment, of which most part in the first quarter of
  2022.
                                                               Eastnine’s share of fund
                                                               returns, %                    39           43

                                                               Fair value of Eastnine’s
                                                               holding, EURm                 19.0         22.8

                                                               Proportion of Eastnine’s
                                                               assets, %                     2.9          4.5

                                                           8
Acquisition increases future earning capacity - YEAR-END REPORT 2021 - Eastnine
Sustainability focus
GRESB                                      Albright                                         Green financing                             Certification of properties

                                                                                                                   Share of green                              Share of certified
                                                                                                                financing to increase                             properties

          92 points
                                                         Green list                                                   26%
     increase by 5 points
                                            Eastnine is included on the Green list of
Listed European estate companies for
                                            companies with a high degree of gender
      sustainability efforts 2021                                                                                                                                        81%
                                            equality

    Top 20th percentile                              3rd out of 320
Of the Global Real Estate Sustainability    Eastnine’s ranking compared to other                     Green    Not green                          Certified   Not certified
          Benchmark (GRESB)                     gender equal companies 2021

                       Eastnine’s overarching sustainability target is to reach net zero emission operations by 2030

                                                                                        9
Acquisition increases future earning capacity - YEAR-END REPORT 2021 - Eastnine
Financial overview
Highlights 2021
• Acquired three office properties in top locations.
• Profit from property management affected by higher
 vacancies and higher interest expenses after a bond issue.
• Large positive unrealised value changes from investments
 in MFG and properties.
• Long-term NAV per share increased by 24 % to 182 SEK.
• Proposed dividend; SEK 3.00 (3.00) per share, split in four
 and paid in quarterly instalments

    11
Financial highlights
                                                                                                     Annual rent
            Rental income                                               Net operating income                         Property value
                                                                                                     (per sq.m.)
            ~ EUR 24.5m1                                                    ~ EUR 22.4m1                               EUR 470m
                                                                                                      EUR 179

     Equity/asset ratio                                                      Net LTVP               Property yield   Occupancy rate
           58 %                                                                45 %                     4.81             90 %

1 Earning   capacity. Property yield excluding development properties

                                                                                               12
Income Statement
                                   2021        2020      Change,     2021        2020       Change,    • Larger property portfolio, two properties acquired in Q2
EURk                              Jan-Dec     Jan-Dec       %       Oct-Dec     Oct-Dec        %         with full effect from Q3 and one in Q4 with full effect from
Rental income
                                                                                                         Q1 2022.
                                    21,530      19,166        +12      5,451       5,251          +4
Property expenses                    -2,293     -1,689        +36       -839        -267        +214
                                                                                                       • Higher vacancies meant less rental income and higher
                                                                                                         property expenses. In Q4 also higher energy costs and a
Net operating income                19,237      17,497        +10      4,612       4,983          -7     non-recurring cost.
Central administration               -3,853     -3,515        +10      -1,000       -834         +20   • Bond issue increased interest expenses and other financial
Interest expenses                    -5,600     -3,703        +51      -1,749      -1,029        +70     expenses.
Other financial income/expenses       -257        -268         -4       -122         -59        +107   • Profit from property management was negatively affected,
Profit from property                                                                                     but the future looks brighter.
management                           9,527      10,011         -5      1,742       3,061         -43
                                                                                                       • Large positive unrealised change in value:
Unrealised value changes
properties                                                                                                – Properties: lower property yield
                                    16,306      17,383                13,957      14,997
Unrealised value changes                                                                                  – MFG: positive sales development
investments                         43,648      13,443                31,995      21,981               • Dividend & positive realised value change:
Unrealised value changes                                                                                  – Dividend from MFG and EC BPF II in 2021 and also EUR
derivatives                          1,349        -782                   689        -109                    6.5m from MFG at the beginning of 2022.
Realised value change/                                                                                    – Realised value change EC BPF II during Q4 due to
Dividend from investments            5,113         640                   861         640                    redemption of Eastnine's shares in the fund.
Profit before tax                   75,943      40,695                49,244      40,570
Deferred tax                         -3,609     -4,540                 -1,995      -3,066
Net profit                          72,334      36,155                47,249      37,504
                                                                                    13
Statement of financial position
                                           2021-12-31   2020-12-31        Change, %   Assets
EURk
Investment properties                         469,817      372,400              +26   • Increased value investment properties:
                                                                                        acquisitions, unrealised changes in value and
Long- and short-term securities holdings      140,858      102,152              +38     investments.

Cash                                           29,201       24,278              +20   • Increased value of securities holdings: MFG.
Other assets                                   12,642        3,395             +272
                                                                                      • Increased cash: bond issue
                                                                                      • Increased other assets: temporary VAT-effect
Total assets                                 652,518      502,225              +30      related acquisition of Uptown Park.
                                                                                      Equity and liabilities
Equity                                        375,994      309,942              +21   • Increased equity:
                                                                                        + profit for the year
Interest-bearing liabilities                  241,084      173,151              +39     - dividends
Derivatives                                     1,395        2,745              -49   • Increased interest-bearing liabilities: new bank
                                                                                        financing and bond issue.
Deferred tax liabilities                       14,464       10,855              +33
                                                                                      • Increased other liabilities: temporary VAT-effect.
Other liabilities                              19,581        5,532             +253

Total equity and liabilities                 652,518      502,225              +30

                                                                     14
Current Earning capacity
EURk                                  2021-12-31    2021-09-30      Change, %
                                                                                   • The rental value and rental income increase as a result of the
                                                                                     acquisition of Uptown Park.
Rental value                               27,276        24,966              +9
Less vacancy value                         -2,738        -2,604              +5
                                                                                   • Property expenses increase due to increased operating costs;
Rental income
                                                                                     higher energy prices and increased vacant space.
                                          24,538        22,362              +10
Property expenses                          -2,700        -2,100             +29    • Interest expenses unchanged, Uptown Park financed with cash.
Net operating income                      21,838        20,262               +8    • Increased other financial expenses are related to the bond issue.
Central administration                     -3,800        -3,800               0
Interest expenses
                                                                                   • Profit from property management increases more than rental
                                           -6,870        -6,910              -1
                                                                                     income and net operating income as a percentage.
Other financial income & expenses            -280           -52             +38
Profit property management                10,888         9,500              +15
                                                                                   • The prospective yield decreases due to increased property
                                                                                     expenses and higher property value.

Key figures                           2021-12-31    2021-09-30    Change, unit
Surplus ratio, %                              89            91               -2
ICR, multiples                                2.6           2.4            +0.2
Debt ratio, multiples                        13.4          14.7             -1.3
Average interest rate level, %                2.8           2.8             0.0
Prospective yield excl. development
properties, %                                 4.6           5.0             -0.4
Prospective yield, %                          4.8           4.9             -0.1
Investment properties, EURk              469,817       415,531         +54,286
                                                                             15
Balanced capital structure & low risk
Interest bearing debt                                                                                            Interest duration
                                                                                                                                              3%                  Fixed interest
• Total interest-bearing liabilities of EUR 241m                                                                                                                  term 1.5 years
   • Consisting of bank loans EUR 196m and bond EUR 45m                                                                                   10%
   • SEB, Swedbank and OP Bank representing the banking group                                                       Floating rate
• Average interest rate of 2.8 %                                                                                    2023
                                                                                                                    2024                                   42%
• Average capital tie-up of 2.5 years
                                                                                                                    2025            24%
• Average fixed interest term of 1.5 years
                                                                                                                    2026
                                                                                                                                              25%

Maturity structure                                  Net LTVP & Equity ratio                                      Capital structure
                                  Average                                              Equity/asset ratio 58 %
                                capital tie-up     100%                                    Net LTVP 45 %
 EURm
                                  2.5 years
150                                                80%

                                                   60%                                                                                       Equity
100
                                                                                                                                              55%
                                                   40%
                                                                                                                                                      Bank loan
 50
                                                   20%                                                                                                  33%

  0                                                 0%
        2022   2023     2024      2025      2026      2019                 2020                    2021
                                                             Equity/asset ratio        Net LTVP                                      Other     Bond 7%
               Loan maturity   Bond                                                                                                   5%

                                                                                  16
Share development and ownership
Equity, Long-term NAV and price per share                                                                                  Largest shareholders 31 December 2021

                                                                               2021                 2D20                                                    Share
Data per share                                                                31 Dec               31 dec                           Owner                              Country
                                                                                                                                                            percentage
Equity, EUR                                                                        16.9              14.0
                                                                                                                                1   Peter Elam Håkansson1        26.6%
Long-term NAV, EUR                                                                 17.6              14.6
                                                                                                                                    Bonnier Fastigheter
Share price, EUR                                                                   15.4              12.4                       2                                13.7%
                                                      The long-term                                                                 Invest
Equity, SEK                                          NAV rose by 24 %              174               141                        3   Arbona AB                    10.0%
Long-term NAV, SEK                                                                 182               147
                                                                                                                                4   Lazard Asset Mgmt             5.5%
Share price, SEK                                                                 158.4              125.0

                                                                                                                                5   Kestutis Sasnauskas1          3.8%
Share price and share discount
                                                                                                                                6   Patrik Brummer                3.7%
 SEK                                                  SEK                                            %
200                                                  200                                             28
                                                     175                                             21      The share          7   Avanza Pension                2.0%
180
                                                     150                                             14       discount
160                                                  125                     0                       7       decreased        8–
                                                                                                                                      Other shareholders         34.7%              -
                                                     100                                             0        to 13 %       6,749
140                                                   75                                             -7
                                        The share     50                                             -14                    Total                                100.0%
120                                                                                          -13
                                        price rose    25                             -15             -21      The number of
                                                       0     -22     -20                             -28       shareholders                                 1   Private and via companies
100                                      by 27 %
                                                            2017    2018    2019     2020   2021            increased by 36 %
           Eastnine (adjusted for dividend)              Discount, %                  Long-term NAV, SEK
           OMX Stockholm Real Estate GI                  Share price, SEK
                                                                                             17
Board of Directors

     Liselotte Hjorth              Christian Hermelin            Ylva Sarby Westman            Peter Elam Håkansson                Peter Wågström
        Chairwoman                    Board member                   Board member                    Board member                    Board member
• Chairman of the Board since   • Board member since 2020      • Board member since 2020      • Board member since 2014        • Board member since 2018
  2018
                                • Other assignments include    • Other assignments include    • Other assignments include      • Other assignments include
• Other assignments include       board member of Prior &        board member of Ikano          Chairman in East Capital and     Chairman of Arlanda stad
  board member of Rikshem         Nilsson Fond- och              Bostad.                        board member of Bonnier          Group, board member in
  and Fastighetsbolaget           kapitalförvaltning AB                                         Business Press                   Niam and Tredje AP fonden
  Emilshus, as well as
  Chairman of Brunswick Real
  Estate Capital Advisory

Selected experience             Selected experience            Selected experience            Selected experience              Selected experience

         (Former Deputy CEO)                    (Former CEO)                                                                                   (Former CEO)
                                                               (Current Deputy CEO and CFO)   (Founder & Chairman)

                                                                             18
Why Eastnine?
Profit and value increase per share
         Profit from property                              Dividend                                 Long-term equity
 EUR    management per share           EUR
                                                           per share                   EUR
                                                                                                       per share
  0,5                                  0,5                                             20

                                                                                       18

  0,4                                  0,4                                             16

                                                                                       14

  0,3                                  0,3                                             12

                                                                                       10

  0,2                                  0,2                                              8

                                                                                        6
  0,1                                  0,1                                              4

                                                                                        2
   0                                     0                                              0
        2018   2019   2020      2021            2018        2019        2020   2021*         2018      2019    2020    2021

                                             * Proposed dividend

                                                                   20
Why Eastnine?
1   Unique portfolio
    •    High-quality office property portfolio, and intention to acquire the best
        logistics properties, in the Baltics.
    •   Prime locations.

2   Strong cash generation
    •   Higher property yields than for comparable properties in the Nordics.
    •   Portfolio with predominantly strong, international tenants on long leases.

    Leading in sustainability
3   •   Unique opportunity to invest in a portfolio with the industry’s highest
        environmental certification level.
    •   Committed to the most ambitious ESG goals in the Baltic region.

    Growth journey ahead
4   •   Target to increase the property portfolio to EUR 700m by the end of 2023.
    •   Positioned for value growth since Baltic property yields converge with
        Nordic.
    •   Evaluates property investments in Poland.

                                                                      21
Baltics the new Nordics,
journey has just begun
You can also read