Acquisition of Cortland Bancorp June 23, 2021 - Farmers ...

Page created by Neil Mack
 
CONTINUE READING
Acquisition of Cortland Bancorp June 23, 2021 - Farmers ...
Acquisition of Cortland Bancorp
         June 23, 2021
Disclosure Statement
Forward-Looking Statements​
This presentation contains forward-looking statements within the meaning of the Private Securities Litigation Reform Act of 1995, including statements about the financial condition, results of operations, asset quality trends and profitability of
Farmers National Banc Corp. (“Farmers”). Forward-looking statements are not historical facts but instead express only management’s current expectations and forecasts of future events or long-term-goals, many of which, by their nature, are
inherently uncertain and outside of Farmers’ control. Forward-looking statements are preceded by terms such as “expects,” “believes,” “anticipates,” “intends” and similar expressions, as well as any statements related to future expectations of
performance or conditional verbs, such as “will,” “would,” “should,” “could” or “may.” Farmers’ actual results and financial condition may differ, possibly materially, from those indicated in these forward-looking statements. Factors that could
cause Farmers’ actual results to differ materially from those described in the forward-looking statements include impacts from the COVID-19 pandemic on local, national and global economic conditions; higher default rates on loans made to our
customers related to the COVID-19 pandemic and its impact on our customers’ operations and financial condition; unexpected changes in interest rates or disruptions in the mortgage markets related to COVID-19 or other responses to the health
crisis; and the other factors contained in Farmers’ periodic reports and registration statements filed with the Securities and Exchange Commission, including its Annual Report on Form 10-K for the year ended December 31, 2020, and Quarterly
Report on Form 10-Q, which have been filed with the Securities and Exchange Commission and are available on Farmers’ website (www.farmersbankgroup.com) and on the Securities and Exchange Commission’s website (www.sec.gov). Forward-
looking statements are not guarantees of future performance and should not be relied upon as representing management’s views as of any subsequent date. Farmers undertakes no obligation to update forward-looking statements, whether as a
result of new information, future events or otherwise.

Use of Non-GAAP Financial Measures
This presentation contains certain financial information determined by methods other than in accordance with accounting principles generally accepted in the United States (“GAAP”). These non-GAAP financial measures include “Core Deposits” and
“Tangible Common Equity ratio.” Farmers believes that these non-GAAP financial measures provide both management and investors a more complete understanding of Farmers’ deposit profile and capital. These non-GAAP financial measures are
supplemental and are not a substitute for any analysis based on GAAP financial measures. Because not all companies use the same calculation of “Core Deposits” and “Tangible Common Equity ratio,” this presentation may not be comparable to
other similarly titled measures as calculated by other companies.

                                                                                                                                                                                                                                                   2
Strategic Partnership to Drive Value
                     •   Increases deposit market share to #2 in Trumbull County and #3 in Mahoning County
 Logical In-Market   •   Expands market presence in attractive Cleveland suburban markets
   Combination       •   Enhances economies of scale and ability to expand product offerings to CLDB’s
                         customer base

                     •   Shared commitment to customers, communities and employees
  Shared Vision &
                     •   Combination creates a stronger Northeastern Ohio based financial institution offering
      Culture            a diversified mix of banking, wealth management and insurance products

    Enhances         •   2 directors from CLDB’s Board to join FMNB’s Board at closing
 Executive Team &    •   Jim Gasior and Tim Carney to join FMNB’s executive team to ease transition and
      Board              promote future growth of the pro forma franchise

                     •   Increases assets ~ 25% to $4.1 billion at close
    Financially      •   Double-digit EPS accretion anticipated (~13.5% fully phased in)
    Attractive       •   Tangible book value earn-back of approximately 3.3 years (crossover method)
                     •   Internal rate of return > 20%

                                                                                                                 3
Proven Acquisition History and Strategy
                                                                  Long-term strategy of value-enhancing acquisitions

                                                                                                                                                                                                                  Cortland
                                                                                $4,500.0                                                                                                                          Bancorp
                    Six acquisitions in the past six years*                                                                                                                                                        (2021)

                                                                                $4,000.0
                                                                                                                                                                                                    Maple
                                                                                                                                                                                                     Leaf
                                                                                $3,500.0
                    Target franchises with similar culture,                                                                                                                                         (2019)
                                                                                                                                                                                  Bowers
                      compelling reputation, and strong                                                                                                                          Insurance
                                                                                $3,000.0
                               customer base                                                                                                                                       (2017)
                                                                                                                                                    National
                                                                                $2,500.0                     Farmers Trust                         Associates
                                                                                                               Company                               (2013)
                   Focus on businesses that support cross                                                       (2009)                                                                       Monitor
                                                                                $2,000.0
                   sell opportunities and diversify footprint                                                                                                                                Bancorp
                                                                                                       Farmers                                                              Tri-state         (2018)
                       into compelling banking markets                          $1,500.0               National                                                             1st Banc
                                                                                                      Insurance                                                              (2016)
                                                                                                        (2008)
                                                                                $1,000.0
                                                                                                                                                                   National
                                                                                                                                         Private Client           Bancshares
                         Manageable initial tangible                                                                                       Services                 (2015)
                                                                                   $500.0
                            book value dilution                                                                                              (2012)

                                                                                         $-
                                                                                                   07        08       09       10       11       12          13   14   15      16       17     18      19    20     21*
                      Reasonable price with a currency                                                                            Assets                Wealth Management Assets
                          mix of cash and stock
                                                                                Graph in millions. * 2021 at March 31, 2021, and includes Cortland Bancorp

* Including CLDB                             •    Graph in millions
                                         •       As of June 30, 2020                                                                                                                                                         4
Pro Forma Franchise
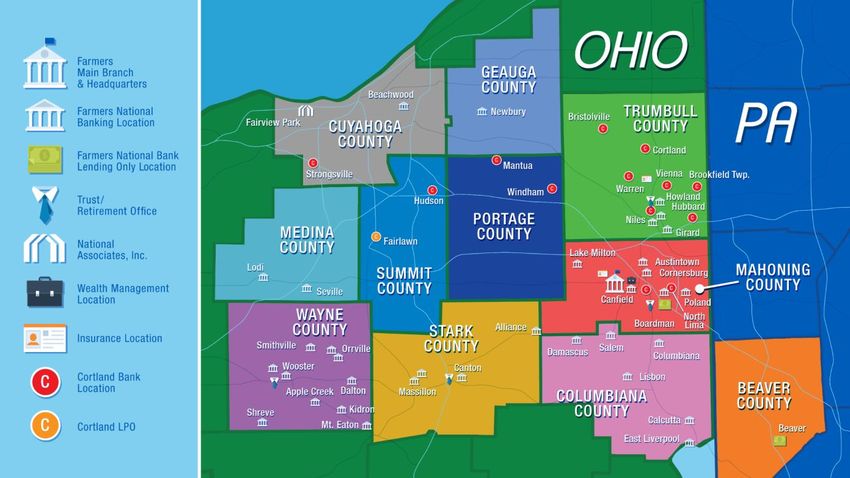
                                   Pro Forma Highlights                                                       Pro Forma Branch Map

        $4.1B                               $2.6B            $3.3B
         assets(1)                          loans(1)        deposits(1)

                            48                     $572M
                       locations(2)               market cap(3)

                        Pro Forma Loans & Deposits(4)

                       All Other                 CDs <    CDs >
    Consumer             9.0%                    $100K    $100K
      7.8%                          Total 1-4     6.5%     8.6%        Non-
                                     Family                          Interest
Agricultural                         23.4%                            25.6%
  1.8%
                C&I
               17.9%
                                                          Int-DDA,
                                   Total CRE
 C&D                                                         MM,
                                     34.2%
 2.9%                                                      Savings
                                                            59.3%
Multi-family
  3.0%

   Source: S&P Global Market Intelligence                                       (3) Based on FMNB’s closing stock price of $16.87 on
   (1) Estimated at close                                                           June 22, 2021                                      5
   (2) Assumes two location closures                                            (4) Based on bank-level data as of March 31, 2021
Combining Two High Performing Franchises
                                                                 Q1 2021 Performance
                                         Return on Avg. Assets                     Return on Avg. Tangible
                                                                                      Common Equity
                                         1.85%
                                                                                   19.6%
                                                          1.38%
                                                                                                      13.6%

                                            Efficiency Ratio                           Net Interest Margin

                                                          59.8%                    3.58%              3.58%
                                         48.5%

Source: S&P Global Market Intelligence
                                                                                                              6
Cortland Bancorp Financial Highlights
(Dollars in thousands)                                                          2018      2019      2020     2021Q1     '18 - YTD CAGR
Balance Sheet
Total Assets                                                                714,666      737,162   821,305   791,705          4.7%
Total Loans HFI                                                             514,392      518,716   556,760   518,618          0.4%
Total Deposits                                                              604,419      618,381   700,510   680,311          5.4%
Profitability
Pre-Tax Pre-Provision Income                                                    10,975     9,356    11,309     3,247          7.8%
Net Income                                                                       8,835     7,282     8,263     2,766         10.5%
PTPP ROAA (%)                                                                     1.63      1.34      1.46      1.62
ROAA (%)                                                                          1.31      1.04      1.07      1.38
ROATCE (%)                                                                        14.4      10.3      10.7      13.6
Efficiency Ratio (%)                                                              64.8      67.0      62.5      59.8
Net Interest Margin (%)                                                           3.76      3.79      3.32      3.58
Asset Quality and LLR
NPAs / Assets (%)                                                                 1.42      1.16      0.93      0.99
LLR / Gross Loans (%)                                                             0.81      0.85      1.07      1.15
NCOs / Avg. Loans (%)                                                             0.23      0.09      0.00     (0.00)

Source: S&P Global Market Intelligence
Note: Profitability CAGRs are calculated based off 2021 Q1 annualized figures                                                            7
Pro Forma Deposit Market Share
  •       Enhances FMNB’s market share to #2 in Trumbull County and #3 in Mahoning County
  •       Increases presence in Cuyahoga County, the state’s 2nd most populous county with 1.2 million people and provides
          entry into Summit County (541k people) and Portage County (162k people)
  •       Establishes presence in attractive Cleveland suburbs of Hudson ($135 thousand median household income) and
          Strongsville ($88 thousand median household income)
                                        Trumbull County, OH                                                                                                          Mahoning County, OH

                                                                                     2020                                                                                                                     2020
   2020                                                        Branches            Deposits Market Share                         2020                                                         Branches      Deposits Market Share
   Rank Institution (State)                                       (#)                 ($000)          (%)                        Rank Institution (State)                                        (#)           ($000)          (%)
     1  Huntington Bancshares Inc. (OH)                           19              1,153,978          33.9                          1  Huntington Bancshares Inc. (OH)                            21        2,039,156          32.1
      2     Pro Forma                                               11 (1)          740,508                  21.8                   2     Premier Financial Corp. (OH)                             12      1,402,670          22.1
      2     JPMorgan Chase & Co. (NY)                                 5             506,577                  14.9                  3      Pro Forma                                                9 (1)   1,161,024         18.3
      3     Cortland Bancorp (OH)                                     7             425,248                  12.5                   3     Farmers National Banc Corp. (OH)                         8       1,019,114          16.0
      4     Farmers National Banc Corp. (OH)                          5             315,260                    9.3                  4     The PNC Finl Svcs Grp (PA)                               6         626,389           9.9
      5     The PNC Finl Svcs Grp (PA)                                4             314,023                    9.2                  5     JPMorgan Chase & Co. (NY)                                5         571,589           9.0
      6     Premier Financial Corp. (OH)                              3             198,169                    5.8                  6     F.N.B. Corp. (PA)                                        4         375,500           5.9
      7     F.N.B. Corp. (PA)                                         3             192,757                    5.7                  7     Cortland Bancorp (OH)                                    2         141,910           2.2
      8     Citizens Financial Group Inc. (RI)                        1               96,998                   2.9                  8     KeyCorp (OH)                                             2         125,670           2.0
      9     Middlefield Banc Corp. (OH)                               1               64,103                   1.9                  9     Citizens Financial Group Inc. (RI)                       1          50,168           0.8
    10      First Niles Financial Inc. (OH)                           1               60,182                   1.8                10      Woodforest Financial Grp Inc. (TX)                       1           4,180           0.1
            Total For Institutions in Market                        51            3,399,933                   100                         Total For Institutions in Market                         62      6,356,346          100

Source: S&P Global Market Intelligence; Census.gov
Note: Deposit data as of June 30, 2020 per the FDIC’s Summary of Deposits; population data based on S&P Global Market Intelligence; median household income data sourced from Census.gov website                               8
(1) Assumes one location closure
Pro Forma Loan & Deposit Composition
                                                                                                       Loan Composition ($000s)
           The Farmers National Bank of Canfield                                           The Cortland Savings & Banking Company                                                                 Pro Forma
                    Total Loans & Leases: $2,040,986                                                     Total Loans & Leases: $525,195                                      Total Loans & Leases: $2,566,181
                                                                                                                 All Other                             Consumer
                                                                                                                  0.2%                                   0.7%                      Consumer
                     Consumer                                                                                                                                                        7.8%            All Other
                                        All Other                                                                                                                                                     9.0%
                       9.6%                                                                                                   C&I                                                                                 Total 1-4
                                         11.3%      Total 1-4                                              C&D                             Total 1-4
                                                                                                                             19.0%                                           Agricultural                          Family
                                                     Family                                                4.6%                             Family                             1.8%                                23.4%
                Agricultural                         24.4%                                                                                  19.6%
                  2.3%                                                                            Multi-family
                                                                                                    5.2%                                                                                      C&I
                                 C&I                                                                                                                                                         17.9%
                                17.6%                                                             Agricultural                   Total CRE
                                                    Total CRE                                                                                                                       C&D                          Total CRE
                        C&D                           29.9%                                         0.0%                           50.8%                                                                           34.2%
                                                                                                                                                                                    2.9%
                        2.5%

               Multi-family                                                                                                                                                        Multi-family
                 2.5%                                                                                                                                                                3.0%
                                                            Yield on Loans                                                                          Yield on Loans                                                     Yield on Loans
                                                                4.63%                                                                                   4.54%                                                              4.61%

                                                                                                  Deposit Composition ($000s)
           The Farmers National Bank of Canfield                                           The Cortland Savings & Banking Company                                                                 Pro Forma
                          Total Deposits: $2,843,508                                                             Total Deposits: $680,627                                           Total Deposits: $3,524,135
                                                                                                    CDs > $100K
                 CDs > $100K                                                                           6.4%                                                            CDs > $100K
                    9.1%                    Non-Interest                                                                                                                  8.6%                          Non-
                                                                                                                                     Non-Interest                                                     Interest
                                              24.1%                                            CDs < $100K                             31.6%
           CDs < $100K                                                                                                                                                                                 25.6%
                                                                                                  6.0%                                                               CDs < $100K
              6.6%                                                                                                                                                      6.5%

                                            Int-DDA, MM,                                                                     Int-DDA, MM,                                                             Int-DDA,
                                               Savings                                                                          Savings                                                              MM, Savings
                                                60.1%                                                                            56.0%                                                                 59.3%

                                                         Cost of Total Deps.                                                                   Cost of Total Deps.                                                  Cost of Total Deps.
                                                               0.32%                                                                                 0.27%                                                                0.31%

Source: S&P Global Market Intelligence
Note: Bank-level loan and deposit compositions as of March 31, 2021; MRQ loan yield and cost of deposits                                                                                                                                  9
Transaction Terms
                                                          •     1.75 shares of FMNB common stock or $28.00 per share in cash for each share of
          Consideration                                         CLDB, subject to 75% of being exchanged for stock and 25% being exchanged for cash
                                                          •     Aggregate Deal Value of $124 million or $29.14 per share(1)

                                                          •      Deal Value / Tangible Book Value:                                         153%
                Multiples                                 •      Deal Value / LTM Net Income:                                              12.8x
                                                          •      Deal Value / YTD Ann. Net Income:                                         11.2x
                                                          •      Core Deposit Premium(2):                                                  6.7%

                                                          •     2 directors from CLDB’s Board to join FMNB’s Board at closing
             Board /                                      •     Jim Gasior to join FMNB as Senior EVP and Corporate Development Officer
           Management                                     •     Tim Carney to join FMNB as Senior EVP and Chief Banking Officer

                                                          •     Expected closing 4th quarter 2021
     Timing / Approvals                                   •     CLDB shareholder approval required
                                                          •     Customary regulatory approvals

(1) Based on FMNB’s closing stock price of $16.87 on June 22, 2021
(2) Core deposit premium defined as aggregate deal value less Cortland’s tangible common equity divided by Cortland’s deposits less time deposit accounts with balances over $100,000   10
Modeling Assumptions
                      •   Total gross credit mark of $11 million (2.3% of CLDB’s MRQ gross loan portfolio
                          excluding loans held for sale and PPP loans)
   Credit Mark              ‒ $4.6 million allocated to purchase credit deteriorated (PCD) loans
                            ‒ $6.4 million allocated to non-PCD loans

                      •   ~$3.2 million write-up of loan portfolio
Interest Rate Marks   •   ~$0.9 million write-up of deposit portfolio
                      •   ~$1.9 million write down of trust preferred securities

                      •   $2.8 million core deposit intangible amortized over 10 years using the sum-of-the-year’s
                          digits method
   Other Marks        •   $1.0 million write down of fixed assets
                      •   AOCI amortized straight line over 4 years

  Cost Savings &
                      •   ~39% costs savings with 75% phased in 2022 and 100% thereafter
   Restructuring
                      •   ~$11.1 million merger charges
     Charges

                                                                                                                     11
Financial Impact Summary
                                                          •     $4.1 billion in assets (25% increase)
         Estimated Pro
         Forma Balance                                    •     $2.6 billion of loans (26% increase)
             Sheet                                        •     $3.3 billion of deposits (26% increase)

                                                          •     12.4% projected accretion to FMNB’s 2022 EPS (75% cost savings phased in) and
                                                                13.5% projected accretion on a fully phased in basis(1)
      Per Share Impact
                                                          •     TBV per share dilution of ~6.4% earned back in ~3.3 years using the cross over
                                                                method(2)

                                                          •     Leverage:                   ~9.1%
      Pro Forma Capital
                                                          •     CET1:                       ~13.0%
           Ratios(2)
                                                          •     Total Risk Based Capital:   ~14.6%

(1) Excluding one time merger charges
(2) Assumes all one-time merger charges of approximately $11.1 million booked at close                                                           12
Comprehensive Due Diligence
•     Completed a coordinated comprehensive due diligence review with executives from FMNB & CLDB, along with advisors & consultants
•     Detailed credit review completed by internal team and augmented with a 3rd party independent review
•     Track record of successful integration and realization of cost savings

                     Loan Review Process                                                    Diligence Focus Areas

             Comprehensive Loan Review Analysis                                                                   
                                                                                                 Commercial
                                                                           Asset Quality                            Consumer Lending
                                                                                                  Lending

       $252 Million                       $38 Million                                            Financial        
                                        Commercial unfunded                Financial and
    Commercial loans reviewed                                                                    Reporting and          Compliance
                                        commitments reviewed                Accounting
                                                                                                   Analysis

•     66% of total commercial loans                                                                               
                                                                                                  Information
•     90% review of special mention and substandard loans                      Operations
                                                                                                  Technology
                                                                                                                         Systems

•     93% of classified loans
•     72% of “worst-pass” rated loans                                                                             
•     100% of credits over $1 million                                            Legal             Treasury         Human Resources

•     100% of COVID sensitive loans

                                                                                                                                     13
You can also read