Actions Speak Louder Than Goals: Valuing Player Actions in Soccer
←
→
Page content transcription
If your browser does not render page correctly, please read the page content below
Actions Speak Louder Than Goals:
                                                                     Valuing Player Actions in Soccer

                                                        Tom Decroos1 , Lotte Bransen2 , Jan Van Haaren2 , and Jesse Davis1
                                                              1
                                                                  KU Leuven, {tom.decroos, jesse.davis}@cs.kuleuven.be
                                                                   2
                                                                     SciSports, {l.bransen, j.vanhaaren}@scisports.com
arXiv:1802.07127v1 [stat.AP] 18 Feb 2018

                                                                                         February 21, 2018

                                                                                                 Abstract
                                                    Assessing the impact of the individual actions performed by soccer players during games is a cru-
                                                cial aspect of the player recruitment process. Unfortunately, most traditional metrics fall short in ad-
                                                dressing this task as they either focus on rare events like shots and goals alone or fail to account for the
                                                context in which the actions occurred. This paper introduces a novel advanced soccer metric for valu-
                                                ing any type of individual player action on the pitch, be it with or without the ball. Our metric values
                                                each player action based on its impact on the game outcome while accounting for the circumstances
                                                under which the action happened. When applied to on-the-ball actions like passes, dribbles, and shots
                                                alone, our metric identifies Argentine forward Lionel Messi, French teenage star Kylian Mbappé, and
                                                Belgian winger Eden Hazard as the most effective players during the 2016/2017 season.

                                           1    Introduction
                                           How will a player’s actions impact his or her team’s performances in games? This question is among
                                           the most relevant questions that needs to be answered when a professional soccer club is considering
                                           whether to sign a player. Nevertheless, the task of objectively quantifying the impact of the individual
                                           actions performed by soccer players during games remains largely unexplored to date. What compli-
                                           cates the task is the low-scoring and dynamic nature of soccer games. While most actions do not impact
                                           the scoreline directly, they often do have important longer-term effects. For example, a long pass from
                                           one flank to the other may not immediately lead to a goal but can open up space to set up a goal chance
                                           several actions down the line.
                                               To help fill the gap in objectively quantifying player performances, we propose a novel advanced
                                           soccer metric that assigns a value to any individual player action on the pitch, be it with or without
                                           the ball, based on its impact on the game outcome. Intuitively, our action values reflect the actions’
                                           expected influence on the scoreline. That is, an action valued at +0.05 is expected to contribute 0.05
                                           goals in favor of the team performing the action, whereas an action valued at -0.05 is expected to yield
                                           0.05 goals for their opponent. Unlike most existing advanced metrics, our proposed metric considers all
                                           types of actions (e.g., passes, crosses, dribbles, take-ons, and shots) and accounts for the circumstances
                                           under which each of these actions happened as well as their possible longer-term effects.
                                               Our metric was designed to take a step towards addressing three important limitations of most ex-
                                           isting advanced soccer metrics (Routley, 2015). The first limitation is that existing metrics largely ignore
                                           actions other than goals and shots. The soccer analytics community’s focus has very much been on the
                                           concept of the expected value of a goal attempt in recent years (Lucey et al., 2014; Caley, 2015; Altman,
                                           2015; Mackay, 2016; Aalbers, 2016; Mackay, 2017). The second limitation is that existing approaches
                                           tend to assign a fixed value to each action, regardless of the circumstances under which the action was
                                           performed. For example, many pass-based metrics treat passes between defenders in the defensive third
                                           of the pitch without any pressure whatsoever and passes between attackers in the offensive third under

                                                                                                     1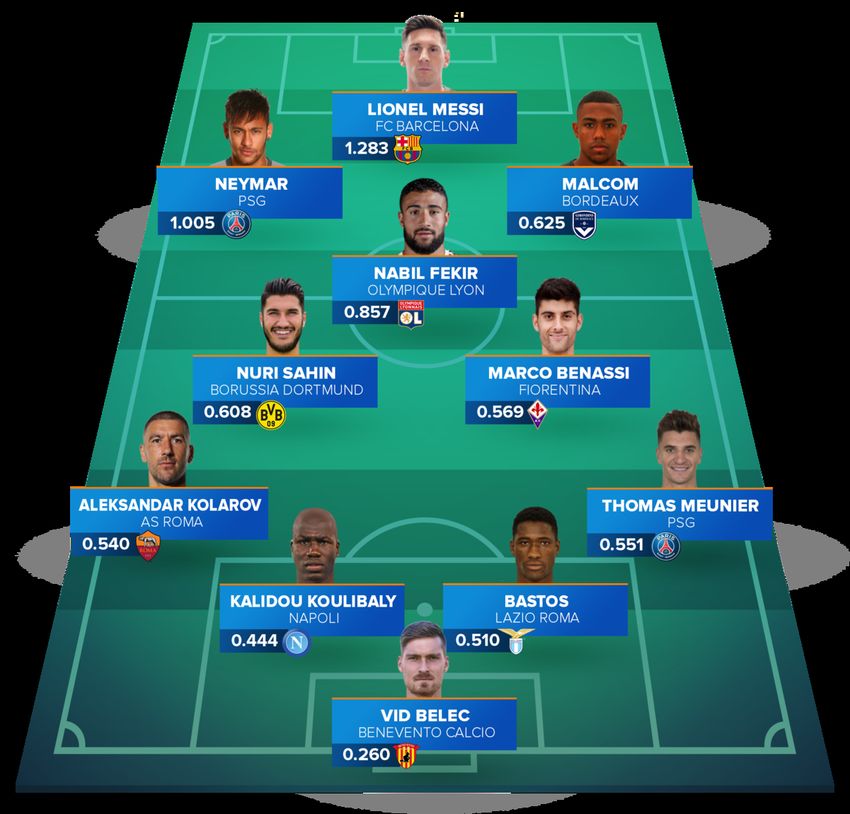
heavy pressure from the opponents similarly. The third limitation is that most metrics only consider
short-term effects and fail to account for an action’s effects a bit further down the line. These limitations
render many of the existing metrics virtually useless for player recruitment purposes.
    Using our metric, we analyzed the 2016/2017 campaign to construct a Team of the 2016/2017 Season.
When applied to on-the-ball actions like passes, dribbles, and shots alone, Barcelona’s Lionel Messi
unsurprisingly headlines the team as the highest-ranked player. His average action value per game last
season was 26% higher than his nearest competitor’s. Other members featuring on the team include
forward Kylian Mbappé then playing for AS Monaco, Real Madrid midfielder Isco, Manchester City
playmaker Kevin De Bruyne as well as Chelsea teammates Eden Hazard and Cesc Fàbregas. To identify
young talent, we also ranked the best players under 21 years old from the 2016/2017 season according
to our metric. Teenage star Mbappé, who moved to French giants Paris Saint-Germain last summer, tops
this list. He appears ahead of his fellow countrymen Ousmane Dembélé, who moved to Barcelona from
Borussia Dortmund over the summer, and midfielder Maxime Lopez of Olympique Marseille.
    In summary, this paper presents the following four contributions:
    1. SPADL: A powerful but flexible language for representing player actions, which is described in
       Section 2.
    2. HATTRICS: A general framework for valuing player actions based on their contributions to the
       game outcome, which is introduced in Section 3.
    3. HATTRICS-OTB: An algorithm for valuing on-the-ball player actions as a concrete instance of the
       general framework, which is outlined in Section 4.
    4. A number of use cases showcasing our most interesting results and insights, which are presented
       in Section 5.

2     SPADL: A language for representing player actions
Valuing player actions requires a dedicated language that is human-interpretable, simple and complete to
accurately define and describe these actions. The human-interpretability allows reasoning about what
happens on the pitch and verifying whether the action values correspond to soccer experts’ intuitions.
The simpleness reduces the chance of making mistakes when automatically processing the language.
The completeness enables to express all the information required to value actions in their full context.
   Based on domain knowledge and feedback from soccer experts, we introduce SPADL (Soccer Player
Action Description Language). SPADL represents each action as a tuple of nine attributes:
StartTime: the exact timestamp for when the action started;
EndTime: the exact timestamp for when the action ended;
StartLocation: the (x, y) location where the action started;

EndLocation: the (x, y) location where the action ended;
Player: the player who performed the action;
Team: the team of the player;
Type: the type of the action;

BodyPart: the body part used by the player for the action;
Result: the result of the action.
We distinguish between 21 possible types of actions including, among others, passes, crossed corners,
dribbles, runs without ball, throw-ins, tackles, shots, penalty shots, clearances, and keeper saves. These action
types are interpretable and specific enough to accurately describe what happens on the pitch yet general
enough such that similar actions have the same type.

                                                       2
Depending on the type of the action, we consider up to four different body parts and up to six
possible results. The possible body parts are foot, head, other, and none. The two most common results
are success or fail, which indicates whether the action had its intended result or not. For example, a pass
reaching a teammate or a tackle recovering the ball. The four other possible results are offside for passes
resulting in an off-side call, own goal, yellow card, and red card.
We represent a game as a sequence of action sets, where each action set describes the actions per-
formed by the players in between two consecutive touches of the ball. More formally, each action set A
consists of one on-the-ball action and n − 1 off-the-ball actions, where n is the total number of players
on the pitch. Each game is a sequence of action sets < A1 , A2 , . . . , Am >, where m is the total number of
touches of the ball.
In addition to being human-interpretable, simple and complete, SPADL has the added advantage of
being able to naturally unify both event data and tracking data collected by providers such as Wyscout,
Opta, and STATS. The representations used by these companies have multiple different objectives (e.g.,
providing information to the media or informing clubs) and are not necessarily designed to facilitate
data analysis. Furthermore, each representation uses a slightly different terminology when describing
the events that occur during a game. SPADL is an attempt to unify the existing description languages
into a common vocabulary that enables subsequent data analysis. The following sections operate on
data in the SPADL format.
3 HATTRICS: A framework for valuing player actions
Broadly speaking, most actions in a soccer game are performed with the intention of (1) increasing the
chance of scoring a goal, or (2) decreasing the chance of conceding a goal. Given that the influence of
most actions is temporally limited, one way to assess an action’s effect is by calculating how much it
alters the chances of both scoring and conceding a goal in the near future. We treat the effect of an
action on scoring and conceding separately as these effects may be asymmetric in nature and context
dependent.
In this section, we introduce the HATTRICS (Honest Attribution of Credit in Soccer) framework for
valuing actions performed by players. In our framework, valuing an action boils down to estimating the
probabilities that a team will score and concede a goal in the near future for both the game state before
the action was performed and the game state after the action was performed.
Now, we will more formally define our metric. For ease of exposition, we will use h to denote the
home team and v the visiting team, and will focus on the perspective of the home team. Given any
game state Si =< A1 , . . . , Ai >, we need to estimate the short-term probability of a home goal (hg) and
a visiting goal (vg), which we denote by:
Phg (Si ) = P (hg ∈ Fik |Si )
Pvg (Si ) = P (vg ∈ Fik |Si )
where Fik =< Ai+1 , . . . , Ai+k > is the sequence of k action sets that follow action set Ai , and k is a
user-defined parameter. These probabilities form the basis of our action-rating framework.
Valuing an action requires assessing the change in probability for both Phg and Pvg as a result of
action set Ai moving the game from state Si−1 to state Si .1 The change in probability of the home team
scoring can be computed as:
∆Phg = Phg (Si ) − Phg (Si−1 ).
This change will be positive if the action increased the probability that the home team will score. The
change can be computed in an analogous manner for Pvg as:
∆Pvg = Pvg (Si ) − Pvg (Si−1 ).
Finally, before combining these two terms, we must contend with the subtlety that the ball may
change possession as a result of Ai . To account for this, we always normalize the value to be computed
1 The challenge of distributing the payoffs of the joint actions that a group takes across the individuals constituting the group
goes beyond the scope of this paper but is a well-studied topic in the field of cooperative game theory (Driessen, 2013). The
Shapley value is one possible solution to this challenge and has been successfully applied to soccer already (Altman, 2016).
3from the perspective of the team that has possession after the ith action set. If the home team has
possession after action set Ai , then the value is calculated as:
V (Ai ) = ∆Phg − ∆Pvg
For this valuing scheme, higher scores represent more valuable actions so the change in Pvg is subtracted
from the change in Phg because it is advantageous for the home to decrease its chance of conceding. If
the visiting team had possession after action set Ai , the two terms would be swapped.
The HATTRICS framework provides a simple approach to valuing actions that is independent of
the representation used to describe the actions. The strength of the framework lies in the fact that it
transforms the subjective task of valuing an action into the objective task of predicting the likelihood
of a future event in a natural way. One possible limitation is that game-state transitions correspond to
on-the-ball actions, whereas some off-the-ball actions (e.g., a smart overlap from a wing-back) can span
several consecutive on-the-ball actions. As a result, accurately valuing such off-the-ball actions would
require the additional step of aggregating the values of the constituting subactions.
4 HATTRICS-OTB: An algorithm for valuing on-the-ball actions
In this section, we describe the HATTRICS-OTB (Honest Attribution of Credit in Soccer for On-the-Ball
Actions) algorithm for valuing on-the-ball player actions as an instantiation of our general framework.
As a data source, we consider play-by-play event data, which means that each action set contains exactly
one on-the-ball action and no other actions. We employ machine learning to estimate the probabilities
Phg and Pvg from the stream of actions. Consequently, we frame this as a binary classification problem
and train a probabilistic classifier to estimate the probabilities. Our implementation involves three key
tasks: (1) transforming the stream of actions into a feature-vector format, (2) selecting and training a
probabilistic classifier, and (3) aggregating the individual action values to arrive at a rating for a player.
4.1 Constructing features
Applying standard machine learning algorithms requires converting the sequence of action sets < A1 , A2 , . . . , Am >
describing an entire game into examples in the feature-vector format. Thus, one training example is con-
structed for each game state Si . A game state Si is labeled positive if the team possessing the ball after
action set Ai scored a goal within the next ten actions. A goal in this time frame could arise from either
a converted shot by the team possessing the ball after Ai or an own goal by the opposing team.
For each example, instead of defining features based on the entire current game state Si =< A1 , ..., Ai >,
we only consider the previous three action sets < Ai−2 , Ai−1 , Ai >. Approximating the game state in
this manner offers several advantages. First, most machine learning techniques require examples to be
described by a fixed number of features. Converting game states with varying numbers of actions, and
hence different amounts of information, into this format would necessarily result in a loss of informa-
tion. Second, considering a small window focuses attention on the most relevant aspects of the current
context. The number of action sets to consider in the approximation is a parameter of the approach, and
three sets was empirically found to work well as shown in Section 4.2.
Since each action set Ai only consists of one on-the-ball action ai in our data source, we denote the
actions we consider as < ai−2 , ai−1 , ai >. From these actions, we define features that will impact the
probability of a goal being scored in the near future. Based on the SPADL representation, we consider
three categories of features.
First, for each of the three actions, we define a number of categorical and real-valued features based
on information explicitly included in the SPADL representation. There are categorical features for an
action’s T ype, Result, and BodyP art. Similarly, there are continuous features for the (x, y)-coordinates
of its start location, the (x, y)-coordinates of its end location, and the time elapsed since the start of the
game.
Second, we define a number of complex features that combine information within an action and
across consecutive actions. Within each action, these include (1) the distance and angle to the goal for
both the action’s start and end locations, and (2) the distance covered during the action in both the x
and y directions. Between two consecutive actions, we compute the distance and elapsed time between
4the start position and time of an action, and the end position and time of the next action. These features
provide an intuition about the current speed of play in the game. Additionally, there is also a feature
indicating whether the ball changed possession between these two actions.
Finally, to capture the game context, we add as features (1) the number of goals scored in the game by
the team possessing the ball after action ai , (2) the number of goals scored in the game by the defending
team after action ai , and (3) the goal difference in the game after action ai .
4.2 Estimating probabilities
We investigated which learner to use as well as the number of actions prior to the action of interest to
consider. To properly evaluate our classifiers, we used play-by-play event data for Europe’s top five
competitions. We trained models on all game states for the 2012/2013 through 2014/2015 seasons and
predicted the goal probabilities for all game states for the 2015/2016 season.
First, we investigated which learner to use for this task. Logistic Regression is the prevalent method
in the soccer analytics community, while Random Forest and Neural Network are popular choices for
addressing machine-learning tasks. We compared the performance of these three learners as imple-
mented in the H2O software package2 on three commonly-used evaluation metrics in probabilistic clas-
sification (Ferri et al., 2009): (1) logarithmic loss, (2) area under the receiver operating characteristic
curve (ROC AUC), and (3) Brier score. A Random Forest classifier with 1000 trees won on all metrics and
achieved a ROC AUC of 79.7%. Furthermore, it was the best calibrated classifier as shown in Figure 1.
Our observation that Random Forest outperforms Logistic Regression on the task of probabilistically
predicting goals is in line with earlier work Decroos et al. (2017a).
1.0
0.8
0.6
Fraction of positives
0.4
Logistic Regression
0.2 Random Forest
Neural Network
0.0 perfect calibration
0.0 0.2 0.4 0.6 0.8 1.0
Mean predicted value
Figure 1: Calibration curves of the three classifiers under consideration. The probabilities produced by
the Random Forest model are calibrated better than the probabilities produced by the other two models.
Second, we investigated the number of previous actions to consider. Adding too few actions might
leave valuable contextual information unused, while adding too many actions can make the feature set
unnecessarily noisy. We trained five different Random Forest classifiers ranging the number of previous
actions from one through five as shown in Table 1. We found that three actions is the best number, which
is in line with earlier work by Mackay (2017).
2 https://www.h2o.ai
5Actions Logarithmic loss ROC AUC Brier score
1 0.0548 0.7955 0.0107
2 0.0546 0.7973 0.0107
3 0.0546 0.7977 0.0107
4 0.0546 0.7970 0.0107
5 0.0547 0.7965 0.0107
Table 1: Comparison of five Random Forest models taking into account a varying number of actions
prior to the action of interest. For the logarithmic loss and the Brier score a lower value is better, while
for the ROC AUC a higher value is better. The best results are in bold.
4.3 Rating players
To this point, our method assigns a value to each individual action. However, our method also allows
aggregating the individual action values into a player rating for multiple time granularities as well as
along several different dimensions. A player rating could be derived for any given time frame, where
the most natural ones would include a time window within a game, an entire game, or an entire season.
Regardless of the given time frame, we compute a player rating in the same manner. Since spending
more time on the pitch offers more opportunities to contribute, we compute the player ratings per 90
minutes of game time. For each player, we first sum the values for all the actions performed during the
given time frame, then divide this sum by the total number of minutes he played and finally multiply
this ratio by 90 minutes.
Players can also be compared along several different axes. First, players have different positions,
and the range of values for the rating may be position dependent. Therefore, comparisons could be
done on a per-position basis. Similarly, some players are versatile and what position they play may vary
depending on the game. Therefore, it may be interesting to examine a player’s rating for each position
he or she plays. Second, instead of summing over all actions, it is possible to compute a player’s rating
for each action type. This would allow constructing a player profile, which may enable identifying
different playing styles.
5 Use cases
In this section, we present a number of use cases to demonstrate the possible applications of our pro-
posed metric. We focus our analysis on the English Premier League, Spanish Primera Division, German
1. Bundesliga, Italian Serie A, and the French Ligue 1. We apply the HATTRICS-OTB algorithm to 9582
games played since the start of the 2012/2013 season. We only include league games and thus ignore
all friendly, cup, and European games. We train the predictive models on the games in the 2012/2013
through 2015/2016 seasons and report results for the 2016/2017 season as well as the ongoing 2017/2018
season until Sunday November 5th 2017. We represent each game as a sequence of roughly 1750 on-the-
ball-actions. The most frequently occurring actions in our dataset are passes (53%) and dribbles (24%).
In contrast, shots are much rarer and represent just 1.4% of the actions with only 11% of them resulting
in a goal.
The remainder of this section is structured as follows. Section 5.1 explains the intuition behind our
metric by means of Kevin De Bruyne’s goal for Manchester City against Arsenal on Sunday November
5th 2017. Section 5.2 provides insights into the distribution of the action values. Section 5.3 shows the
best possible line-up for the 2016/2017 season based on our metric. Section 5.4 discusses the five highest-
rated players born after January 1st 1997 for the 2016/2017 season. Section 5.5 identifies a number of
players who stood out at smaller clubs during the 2016/2017 season. Section 5.6 explains how our metric
can be used to compare players in terms of their playing styles. Section 5.7 shows how the performances
of Manchester City, Real Madrid, and Barcelona have evolved since the start of the 2016/2017 season.
Section 5.8 discusses how our metric is used by SciSports, a Dutch data analytics company providing
expertise to soccer clubs.
65.1 Intuition behind the action values
Figure 2 visualizes the goal from Manchester City midfielder Kevin De Bruyne against Arsenal on Sun-
day November 5th 2017. The table at the top of the figure shows the action values assigned to the shot
that resulted in the goal as well as the twelve prior actions.
ACTION PLAYER TYPE VALUE ACTION PLAYER TYPE VALUE
1 Sergio Agüero Take on 0.016 7 Leroy Sané Pass -0.006
2 Sergio Agüero Dribble 0.022 8 Fabian Delph Pass -0.003
3 Sergio Agüero Failed cross -0.045 9 Kevin De Bruyne Dribble 0.003
4 Laurent Koscielny Clearance 0.001 10 Kevin De Bruyne Pass 0.007
5 Kevin De Bruyne Failed shot 0.014 11 Fernandinho Pass 0.012
6 Petr Čech Keeper save 0.014 12 Kevin De Bruyne Dribble 0.040
13 Kevin De Bruyne Shot 0.888
0.014 6
-0.045
3 0.888
4
0.014
0.001 2 0.022 13
5 -0.006 7 12 0.040
1 0.016
11 0.012
8
9 10
-0.003 0.007
0.003
19' GOAL FROM
KEVIN DE BRUYNE
MANCHESTER CITY VS. ARSENAL
SUNDAY 5 NOVEMBER 2017
Figure 2: Visualization of Kevin De Bruyne’s 19th-minute goal for Manchester City against Arsenal
on Sunday November 5th 2017. The table at the top shows the values assigned to each of the actions
performed in the build-up to the shot.
The attack starts with Argentine forward Sergio Agüero who first takes on an opponent (Action 1),
then dribbles into the box (Action 2), and finally delivers a cross that fails to reach a teammate (Action 3),
which gets a negative value of -0.045. The clearance from Arsenal defender Laurent Koscielny (Action 4)
is collected by De Bruyne, who attempts a shot on target (Action 5). The Belgian midfielder sees his shot
saved by Arsenal goalkeeper Peter Cech (Action 6), whose save gets a positive value of 0.014. However,
Manchester City are able to recover the ball, which returns to De Bruyne following passes from Leroy
Sané (Action 7) and Fabian Delph (Action 8). De Bruyne first dribbles a bit towards the middle of
the pitch (Action 9) and sets up a one-two pass with teammate Fernandinho (Actions 10 and 11), then
dribbles into the box (Action 12), and finally sends the ball into the lower-right corner of the goal with a
powerful driven shot (Action 13). The dribble into the box and the shot get positive values of 0.040 and
0.888, respectively.
The attack leading to De Bruyne’s goal is a clear example of how our metric works. Actions increas-
ing a team’s chances of scoring (e.g., a dribble or pass to a more dangerous location on the pitch like
Actions 11 and 12) or decreasing the opponent’s chances of scoring (e.g., a clearance and a save by the
goalkeeper like Actions 4 and 6) receive positive values, whereas actions decreasing a team’s chances of
scoring like the failed cross from Agüero (Action 3) receive negative values. In this particular game, the
19th-minute goal from De Bruyne is the highest-valued action, while a 47th-minute foul from Arsenal’s
7Nacho Monreal causing a penalty is the lowest-valued action.
5.2 Distribution of the action values
Figure 3 shows the number of actions that players execute on average per 90 minutes and the average
value of their actions for those players who played at least 900 minutes during the 2016/2017 season.
Naturally, there is a tension between these two quantities. If a player performs a high number of actions,
then it is harder for each action to have a high value. The 15 highest-rated players according to our metric
are highlighted in red.
The grey dotted isoline shows the gap in total contribution between Messi and other players. This
isoline is curved since a player’s total contribution is computed as the average value per action (x-axis)
multiplied by the number of actions per 90 minutes (y-axis).
The plot shows that strikers like Harry Kane (Tottenham Hotspur), Luis Suárez (Barcelona), Kylian
Mbappé (AS Monaco), and Pierre-Emerick Aubameyang (Borussia Dortmund) are less involved in the
game as they perform a relatively low number of actions on average. However, the actions they do
perform tend to be highly valued. In contrast, players like Arjen Robben (Bayern Munich), Eden Hazard
(Chelsea), and Philippe Coutinho (Liverpool) perform more actions although the average value of their
actions is considerably lower. Cesc Fàbregas (Chelsea), Isco (Real Madrid), and James Rodrı́guez (Real
Madrid) perform more actions per 90 minutes than them while maintaining a higher average value per
action. Finally, as shown by the isoline and more traditional statistics,3 Lionel Messi is clearly in a class
of his own.
160
140 Fàbregas
120 IscoRodríguez
Coutinho
Number of actions HazardRobben Messi
per 90 minutes 100 Sánchez
Gomez
80
Salah
Mertens
60 Suárez Mbappé
Kane
40 Aubameyang
0.0000 0.0025 0.0050 0.0075 0.0100 0.0125 0.0150 0.0175
Value per action
Figure 3: Scatter plot that contrasts the average number of actions performed per 90 minutes with the
average value of these actions for each player who played at least 900 minutes during the 2016/2017
season. The 15 highest-rated players according to our metric are highlighted in red.
For nine positions on the pitch, Figure 4 shows the distribution of the average ratings per game for
3 https://fivethirtyeight.com/features/lionel-messi-is-impossible/
8those players who played at least 900 minutes during the 2016/2017 season. The highest-rated player
for each position is highlighted in red.
Messi
1.0
Mbappé
0.8
Isco De Bruyne Hazard
0.6 Piszczek
Average Suttner
game rating 0.4
Pickford Bonucci
0.2
0.0
0.2
Goalkeeper Central Left Right Central Attacking Left Right Central
Back Back Back Mid Mid Winger Winger Striker
Figure 4: Distribution of average per game rating for players who played at least 900 minutes in the
2016/2017 season.
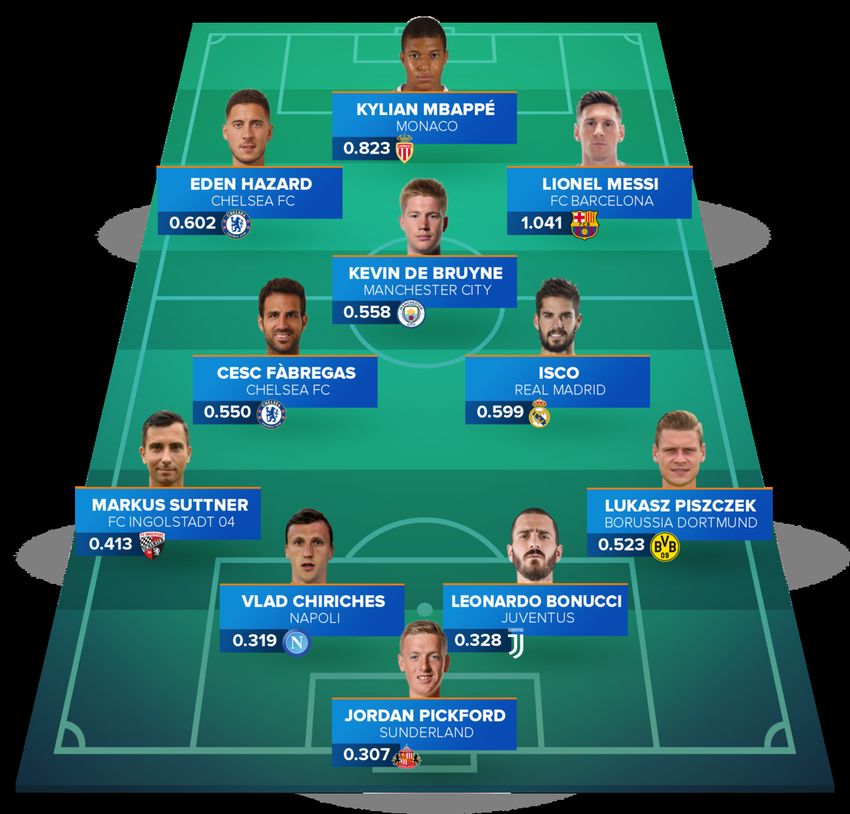
5.3 Selection of 2016/2017 team of the season
Figure 5 shows the best possible line-up for the 2016/2017 season according to our metric. For each
position, the line-up includes the highest-ranked player who played at least 900 minutes, which is the
equivalent of ten full games, in that particular position. The offensive line features the likes of Eden
Hazard (Chelsea), the inevitable Lionel Messi (Barcelona), and teenage star Kylian Mbappé, who joined
Paris Saint-Germain on a loan from AS Monaco last summer. The French striker will move to the French
giants on a permanent basis next summer for a transfer fee rumoured to be around 90 million euros.4
The midfield consists of Kevin De Bruyne (Manchester City), Isco (Real Madrid), and Cesc Fàbregas
(Chelsea), who were all key figures for their respective teams during the previous campaign. However,
the composition of the defensive line is somewhat more surprising. Serie A centre backs Vlad Chirices
(Napoli) and Leonardo Bonucci (Juventus) combine their strength with excellent passing abilities. Bun-
desliga wing-backs Markus Suttner (FC Ingolstadt 04) and Lukasz Piszczek (Borussia Dortmund) are
known for overlapping and providing support in offense. Goalkeeper Jordan Pickford got relegated
with Sunderland last season but moved to Everton over the summer nevertheless. These somewhat
surprising names in the defensive line reveal one limitation of HATTRICS-OTB. That is, the algorithm
only values on-the-ball actions, while defending is often more about preventing your opponent from
gaining possession of the ball by clever positioning and anticipation. More specifically, goalkeepers are
rewarded for their interventions but not punished for the goals they concede.
The inclusion of Eden Hazard in our Team of the 2016/2017 Season shows the strength of our metric at
identifying impactful players. The Belgian winger, who had a crucial role in Chelsea’s Premier League
title, is the seventh-highest rated player on our metric but ranks only 133rd in terms of goals and assists
per 90 minutes with 10 goals and 3 assists. Similarly, wing-back Lukasz Piszczek ranks 19th on our
metric but only appears in 292nd position for goals and assists per 90 minutes with 5 goals and 1 assist.
In contrast, notable omissions from the team are high-profile players like Robert Lewandowski (54th),
Álvaro Morata (61st), Edinson Cavani (77th), and Edin Dzeko (265th), who were all directly involved in
more than one goal or assist per 90 minutes in the 2016/2017 season.
4 https://www.transfermarkt.com/kylian-mbappe/profil/spieler/342229
9Figure 6 shows the best possible line-up for the 2017/2018 season up through November 5th 2017
according to our metric. For each position, the line-up includes the highest-ranked player who played
at least 450 minutes in that particular position. The average rating for the players for the 2017/2018
season (0.659) is significantly higher than the average rating for the players on the 2016/2017 season
(0.551). However, we expect the average rating to regress towards the average for last season as the
season progresses.
Appendix B lists the five highest-rated players in each position for the 2016/2017 season. Ap-
pendix C lists the five highest-rated players in each position for the 2017/2018 season until November
5th 2017.
Figure 5: The best possible line-up for the 2016/2017 season according to our metric. For each posi-
tion, the line-up includes the highest-ranked player who played at least 900 minutes in that particular
position.
10Figure 6: The best possible line-up for the 2017/2018 season until November 5th 2017 according to
our metric. For each position, the line-up includes the highest-ranked player who played at least 450
minutes in that particular position.
5.4 Identification of young talents
Table 2 shows the five highest-rated players born after January 1st 1997 who played at least 900 minutes
during the 2016/2017 season. Kylian Mbappé, who is recognized as one of the biggest talents in the
world, tops this list with a rating nearly twice as high as his nearest competitor. He has seamlessly
transitioned from Monaco to Paris Saint-Germain this season, and has continued to gain acclaim for
his play. Allan Saint-Maximin who played midfielder for Bastia in the French Ligue 1 last season is
second-ranked. His play earned him both a transfer to Nice after the season and plaudits from the
soccer intelligensia.5 Ousmane Dembélé is also a huge talent, who parlayed his outstanding season for
Borussia Dortmund into a summer move to FC Barcelona, where he was injured early in the season.
5 http://www.squawka.com/news/allan-saint-maximin-the-monaco-wonderkid-
you-havent-heard-of-yet-and-europes-take-on-king/919430
11Maxime Lopez and Malcom play in the Ligue 1 and remained with their respective clubs where they
continue to play well and are attracting significant interest from bigger clubs.
Rank Player Team Age Position Rating
1 Kylian Mbappé AS Monaco 18 Central striker 0.82
2 Allan Saint-Maximin Bastia 20 Winger 0.46
3 Ousmane Dembélé Borussia Dortmund 20 Winger 0.38
4 Maxime Lopez Olympique Marseille 19 Attacking midfielder 0.30
5 Malcom Girondins Bordeaux 20 Winger 0.26
Table 2: The highest-ranked players born after January 1st 1997 during the 2016/2017 season according
to our metric.
Next, we consider a slightly larger age range and also consider players under 23 years old. Figure 7
shows the 15-game moving average for our metric for Leroy Sané, Mikel Oyarzabal, and Karol Linetty.
Leory Sané was a big signing for Pep Guardiola in the summer of 2016, and is widely recognized for
his high level of play this season with Manchester City. Mikel Oyarzabal currently plays for mid-table
Primera Division team Real Sociedad. However, the 20-year-old winger, who debuted for the Spanish
national team last year, is being linked with big clubs throughout Europe. Karol Linetty is a 22-year-old
central midfielder playing for Sampdoria in Serie A. He is much less well known than the other two
players, but our metric suggests he is playing at a level commensurate with these more highly touted
youngsters, and hence the Pole may be one to watch.
0.5
Leroy Sané
0.4 Mikel Oyarzabal
Karol Linetty
0.3
Moving average
of rating per 90 0.2
0.1 Summer break
0.0
0.1
Jan-2017 Mar-2017 May-2017 Jul-2017 Sep-2017 Nov-2017
Figure 7: The 15-game moving average for our metric for Leroy Sané (Manchester City), Mikel Oyarza-
bal (Real Sociedad), and Karol Linetty (Sampdoria) since the start of the 2016/2017 season.
5.5 Identification of the players who stand out
One talent pipeline often exploited by larger clubs is identifying the players on less successful top di-
vision clubs whose skills have the potential to flourish in a more competitive environment. Thus, a
natural question to ask is: Can our player rating metric help identify promising talent toiling at lesser
clubs that larger clubs could target in the transfer market? When scouting such players from an objective
perspective, one challenge is that the value of a metric often will partially reflect the team context. In
this case, that means being surrounded by less-talented players, which may adversely affect a player’s
rating. Therefore, to find players that stand out compared to their teammates’ performances, we look at
the highest-ranked players on teams who finished outside the top 5 in their respective league. Table 3
lists the players who stood out at smaller clubs during the 2016/2017 season.
12Rank Player Team Position Rating
1 Junior Stanislas Bournemouth Winger 0.58
2 Dimitri Payet West Ham United Winger 0.55
3 Iago Aspas Celta de Vigo Central striker 0.52
4 Max Kruse SV Werder Bremen Central striker 0.50
5 Ryad Boudebouz Montpellier Attacking midfielder 0.47
6 Fin Bartels SV Werder Bremen Central striker 0.46
7 Allan Saint-Maximum Bastia Winger 0.46
8 Ross Barkley Everton Winger 0.44
9 Romelu Lukaku Everton Central striker 0.44
10 Federico Viviani Bologna Central midfielder 0.43
Table 3: The highest-ranked players on teams who finished outside the top 5 in their respective league
during the 2016/2017 season according to our metric.
Table 3 contains a number of interesting names. Junior Stanislas plays winger for Bournemouth in
the English Premier League, and he is especially strong at shooting. Bournemouth performed excep-
tionally well in the 2016/2017 season, finishing 9th after finishing 16th the previous season. Another
interesting player is Ryad Boudebouz, an attacking midfielder for Montpellier last season. He has since
been transferred to Real Betis, but was on the wish list for a number of other clubs as well. The list
also contains a number of recognized talents such as Dimitri Payet, who was a key performer for France
at EURO 2016, Romelu Lukaku, who moved to Manchester United after the 2016/2017 season and is
playing well there, and Ross Barkley, who moved to Chelsea in the previous winter transfer window.
5.6 Characterization of playing styles
Clubs are beginning to consider player types during the recruitment process in order to focus on identi-
fying those players who best fit a team’s preferred style of play (e.g., short passes and high defending vs.
long balls and defensive play). Currently, scouts and experts are typically tasked with judging playing
style. These experts’ time is almost always the limiting resource in the player recruitment process, which
makes it difficult to consider the entire pool of players. Therefore, advanced metrics offer the potential
to help select a set of players that are worthy of additional attention. The metrics can be used to assess
a player’s ability at performing different types of actions. With our metric, this can be accomplished by
computing a player’s total value per 90 minutes for each type of action.
To showcase this use case, we analyze the playing styles of Lionel Messi, Harry Kane, and Kylian
Mbappé, who are all counted among the best forward players in the world. Figure 8 shows the total
contributions per 90 minutes for the passes, crosses, dribbles, and shots performed by these three play-
ers. Messi rates excellent at all four aspects and is an allrounder. In comparison to Messi, Kane rates
poorly at passing, dribbling and particularly crossing. However, he outperforms Messi in shooting and
is clearly a finisher, which is also reflected in the fact that he has scored 23 goals while providing only
one assist in the ongoing season. In comparison to Messi, Mbappé only rates poorly at passing and even
outperforms him in crossing.
13Messi Messi
Kane Kane
Mbappé Mbappé
0.00 0.05 0.10 0.15 0.20 0.25 0.01 0.00 0.01 0.02
Total pass value per 90 minutes Total cross value per 90 minutes
Messi Messi
Kane Kane
Mbappé Mbappé
0.0 0.1 0.2 0.3 0.4 0.0 0.1 0.2 0.3 0.4 0.5
Total dribble value per 90 minutes Total shot value per 90 minutes
Figure 8: Overview of the total contribution per 90 minutes for different types of actions for Lionel
Messi, Harry Kane, and Kylian Mbappé.
As another use case, consider FC Barcelona’s attempts to offset the loss of Neymar by acquiring
Borussia Dortmund’s Ousmane Dembélé and Liverpool’s Philippe Coutinho. Figure 9 compares Dembélé,
Coutinho and Neymar’s total values per 90 minutes for four action types. According to our metric,
both Dembélé and Coutinho’s passes receive a much higher value than Neymar’s. Dembélé is the best
crosser, with Neymar and Coutinho receiving nearly identical values for this skill. Neymar is a supe-
rior dribbler, and is ranked as the third best dribbler out of all players we analyzed in the 2016/2017
season. However, Dembélé is also exceptionally strong at dribbling and is ranked as the tenth best drib-
bler, whereas Coutinho is ranked thirty fourth. From a stylistic perspective, this breakdown suggests
that Dembélé was a reasonable target in that he comes close to replicating Neymar’s signature skill of
dribbling.
14Dembélé Dembélé
Coutinho Coutinho
Neymar Neymar
0.00 0.05 0.10 0.15 0.00 0.01 0.02 0.03 0.04
Total pass value per 90 minutes Total cross value per 90 minutes
Dembélé Dembélé
Coutinho Coutinho
Neymar Neymar
0.0 0.1 0.2 0.3 0.00 0.05 0.10 0.15
Total dribble value per 90 minutes Total shot value per 90 minutes
Figure 9: Overview of the total contribution per 90 minutes for different types of actions for Neymar,
Ousmane Dembélé, and Philippe Coutinho.
5.7 Evolution of team performances
Figure 10 shows the evolution of the game ratings for Manchester City, Real Madrid, and Barcelona
computed as a 15-game moving average since the start of the 2016/2017 season. We compute a team’s
game rating by summing the values for all the team’s actions, which corresponds to summing the ratings
for all the team’s players in a particular game. The average game rating for Manchester City has been
steadily increasing since the end of the 2016/2017 season, which was their first under the management
of Pep Guardiola. Manchester City seem unbeatable and topped the Premier League table with 43 points
from a possible 45 in their opening 15 games of the 2017/2018 season.
In contrast, Real Madrid had a poor start to the 2017/2018 season and ranked only fourth in the
Primera Division after 14 games with 28 points from a possible 42. Their Portuguese star player Cris-
tiano Ronaldo seems to be completely out of shape and does not appear near the top of our rankings.
Rivals Barcelona finished their 2016/2017 season on a high with seven consecutive victories in their final
league games of the season. The Blaugrana also had an excellent start to their 2017/2018 season but have
been struggling to convincingly win games more recently. The evolution of their game ratings suggests
Barcelona might have been overperforming and are now regressing towards their regular level.
15Manchester City
4.0 Real Madrid
Barcelona
Moving average 3.5 Summer break
of game rating
3.0
2.5
2.0
Jan-2017 Mar-2017 May-2017 Jul-2017 Sep-2017 Nov-2017
Figure 10: The evolution of the game ratings for Manchester City, Real Madrid, and Barcelona computed
as a 15-game moving average since the start of the 2016/2017 season. A team’s game rating is computed
by summing the values for all its actions.
Figure 11 shows the average contribution per game for the goalkeepers, defenders, midfielders, and
strikers of Barcelona, Real Madrid, and Manchester City during the 2016/2017 season. Barcelona’s front
line, which consisted of Neymar, Luis Suárez, and Lionel Messi in most games, was responsible for the
largest share of their average contribution per game. In contrast, Real Madrid’s midfielders contributed
more than their strikers, while Manchester City’s midfielders and strikers contributed roughly equally.
Barcelona
0.6 Real Madrid
Manchester City
0.5
Average contribution 0.4
per game
0.3
0.2
0.1
0.0
Goalkeepers Defenders Midfielders Strikers
Figure 11: The average contribution per game for the goalkeepers, defenders, midfielders, and strikers
of Barcelona, Real Madrid, and Manchester City during the 2016/2017 season.
Similarly, Figure 12 shows the average contribution per game for each line of Barcelona, Real Madrid,
and Manchester City during the 2017/2018 season. Despite their loss of Neymar to Paris Saint-Germain,
Barcelona still have the strongest attack by far. Real Madrid have seen their average contribution per
game go down in midfield and offense, while Manchester City have seen notable increases in both those
lines.
160.6 Barcelona
Real Madrid
Manchester City
0.5
0.4
Average contribution
per game
0.3
0.2
0.1
0.0
Goalkeepers Defenders Midfielders Strikers
Figure 12: The average contribution per game for the goalkeepers, defenders, midfielders, and strikers
of Barcelona, Real Madrid, and Manchester City during the 2017/2018 season.
5.8 Deployment in the soccer industry
The SciSports Datascouting department leverages our action values for providing data-driven advice
to soccer clubs and soccer associations with respect to player recruitment and opponent analysis. Until
recently, the SciSports datascouts almost exclusively relied upon more traditional metrics and statistics
as well as the company’s SciSkill Index, which ranks all professional soccer players in the world in
terms of their actual and expected future contributions to their teams’ performances. The SciSkill Index
provides intuitions about the general level of a player, whereas our action values offer more insights
into how each player contributes to his team’s performances. While our action values are currently only
available for internal use by the SciSports datascouts, they will also be made available in the SciSports
Insight6 online scouting platform.
6 Related work
Although the valuation of player actions is an important task with respect to player recruitment and
valuation, this subject has remained virtually unexplored in the soccer analytics community due to the
challenges resulting from the dynamic and low-scoring nature of soccer. The approaches from Nørstebø
et al. (2016) for soccer, Routley (2015) for ice hockey, and Cervone et al. (2014) for basketball come
closest to our framework. They address the task of valuing individual actions by modeling each game
as a Markov game (Littman, 1994). In contrast to Nørstebø et al. (2016) and Routley (2015), which divide
the pitch into a fixed number of zones, our approach models the precise spatial locations of each action.
Unlike Cervone et al. (2014), which is restricted to valuing only three types of on-the-ball actions, our
approach considers any relevant on-the-ball action during a game. However, our definitions of player
actions, action sets and games are similar to those used by these works as well as earlier research for
soccer (Rudd, 2011; Hirotsu et al., 2002), American football (Goldner, 2012), and baseball (Tango et al.,
2007).
Most of the related work on soccer either focuses on a limited number of player-action types like
passes and shots or fails to account for the circumstances under which the actions occurred. Decroos
et al. (2017b), Knutson (2017), and Gregory (2017) address the task of valuing the actions leading up to
a goal attempt, whereas Bransen (2017) addresses the task of valuing individual passes. The former ap-
6 https://insight.scisports.com
17proaches naively assign credit to the individual actions by accounting for a limited amount of contextual
information only, while the latter approach is limited to a single type of action only.
Furthermore, this work is also related to the work on expected-goals models, which estimate the
probability of a goal attempt resulting into a goal (Lucey et al., 2014; Caley, 2015; Altman, 2015; Mackay,
2016; Aalbers, 2016; Mackay, 2017). In our framework, computing the expected-goals value of a goal
attempt boils down to estimating the value of the game state prior to the goal attempt.
7 Conclusion
This paper introduced an advanced soccer metric named HATTRICS-OTB that quantifies the perfor-
mances of players during games. Our metric values any individual player action on the pitch based on
its expected influence on the scoreline. In contrast to most existing metrics, our metric offers the benefits
that it (1) values all types of actions (e.g., passes, crosses, dribbles, and shots), (2) bases its valuation
on the game context, and (3) reasons about an action’s possible effect on the subsequent actions. Intu-
itively, the player actions that increase a team’s chance of scoring receive positive values while those
actions that decrease a team’s chance of scoring receive negative values.
We presented HATTRICS-OTB as a concrete instantiation of our more general action-valuing frame-
work named HATTRICS for use with play-by-play event data. Several illustrative use cases based on
an analysis of the data for the top five European leagues highlighted the inner workings of HATTRICS-
OTB. Furthermore, we also proposed a language for representing play-by-play event data that is de-
signed with the goal of facilitating data analysis.
A limitation of HATTRICS-OTB is its focus on valuing on-the-ball actions whereas defensive skill
often manifests itself through positioning and anticipation abilities that are used to deny certain action
possibilities. Therefore, including full optical tracking data would be an interesting direction for future
research.
Acknowledgements
Tom Decroos is supported by the Research Foundation-Flanders (FWO-Vlaanderen). Jesse Davis is par-
tially supported by the KU Leuven Research Fund (C22/15/015) and FWO-Vlaanderen (G.0356.12, SBO-
150033).
References
Bart Aalbers (2016). Expected Goals Model 2.0. SciSports.
URL http://www.scisports.com/news/2016/expected-goals-model-2-0
Daniel Altman (2015). Beyond Shots: A New Approach to Quantifying Scoring Opportunities. OptaPro
Analytics Forum.
URL http://northyardanalytics.com/Dan-Altman-NYA-OptaPro-Forum-2015.pdf
Daniel Altman (2016). Finding the Weak Link.
URL http://www.northyardanalytics.com/blog/2016/01/18/
finding-the-weak-link
Lotte Bransen (2017). Valuing Passes in Football Using Ball Event Data. Master’s thesis, Erasmus University
Rotterdam.
URL https://thesis.eur.nl/pub/41346
Michael Caley (2015). Premier League Projections and New Expected Goals. Cartilage Free Captain.
URL https://cartilagefreecaptain.sbnation.com/2015/10/19/9295905/
premier-league-projections-and-new-expected-goals
18Dan Cervone, Alexander D’Amour, Luke Bornn, and Kirk Goldsberry (2014). POINTWISE: Predicting
Points and Valuing Decisions in Real Time with NBA Optical Tracking Data. In MIT Sloan Sports
Analytics Conference.
Tom Decroos, Vladimir Dzyuba, Jan Van Haaren, and Jesse Davis (2017a). Predicting Soccer Highlights
from Spatio-Temporal Match Event Streams. In Proceedings of the AAAI Conference on Artificial Intelli-
gence, pages 1302–1308.
Tom Decroos, Jan Van Haaren, Vladimir Dzyuba, and Jesse Davis (2017b). STARSS: A Spatio-temporal
Action Rating System for Soccer. In ECML/PKDD 2017 Workshop on Machine Learning and Data Mining
for Sports Analytics.
Theo Driessen (2013). Cooperative Games, Solutions and Applications. Springer Science & Business Media.
César Ferri, José Hernández-Orallo, and R Modroiu (2009). An Experimental Comparison of Perfor-
mance Measures for Classification. Pattern Recognition Letters, 30(1):27–38.
Keith Goldner (2012). A Markov Model of Football: Using Stochastic Processes to Model a Football
Drive. Journal of Quantitative Analysis in Sports, 8(1).
Sam Gregory (2017). How We Assign Credit in Football. OptaPro Blog.
URL http://www.optasportspro.com/about/optapro-blog/posts/2017/
blog-how-we-assign-credit-in-football/
Nobuyoshi Hirotsu, Michael Wright, et al. (2002). Using a Markov Process Model of an Association
Football Match to Determine the Optimal Timing of Substitution and Tactical Decisions. Journal of the
Operational Research Society, 53(1):88–96.
Ted Knutson (2017). Introducing xGChain. StatsBomb IQ Services.
URL http://www.statsbombservices.com/introducing-xgchain
Michael Littman (1994). Markov Games as a Framework for Multi-Agent Reinforcement Learning. In
Proceedings of the International Conference on Machine Learning.
Patrick Lucey, Alina Bialkowski, Mathew Monfort, Peter Carr, and Iain Matthews (2014). Quality vs.
Quantity: Improved Shot Prediction in Soccer Using Strategic Features from Spatiotemporal Data. In
MIT Sloan Sports Analytics Conference.
Nils Mackay (2016). Introducing My Expected Goals Model. Mackay Analytics.
URL http://mackayanalytics.nl/2016/02/01/introducing-my-expected-goals-model/
Nils Mackay (2017). Predicting Goal Probabilities for Possessions in Football. Master’s thesis, Vrije Univer-
siteit Amsterdam.
URL https://beta.vu.nl/nl/Images/werkstuk-mackay_tcm235-849981.pdf
Olav Nørstebø, Vegard Rødseth Bjertnes, and Eirik Vabo (2016). Valuing Individual Player Involvements
in Norwegian Association Football. Master’s thesis, Norwegian University of Science and Technology.
URL https://brage.bibsys.no/xmlui/bitstream/handle/11250/2433841/15584_
FULLTEXT.pdf
Kurt Douglas Routley (2015). A Markov Game Model for Valuing Player Actions in Ice Hockey. Master’s
thesis, Simon Fraser University.
URL https://www.caiac.ca/sites/default/files/publications/routley_msc_
thesis.pdf
Sarah Rudd (2011). A Framework for Tactical Analysis and Individual Offensive Production Assessment
in Soccer Using Markov Chains. In New England Symposium on Statistics in Sports.
URL http://nessis.org/nessis11/rudd.pdf
Tom Tango, Mitchel Lichtman, and Andrew Dolphin (2007). The Book: Playing the Percentages in Baseball.
Potomac Books, Inc.
19A Action types
Table 4 provides an overview of the action types in the dataset alongside their descriptions.
Action type Description Successful? Special result
Pass Normal pass in open play Reaches teammate Offside
Cross Cross into the box Reaches teammate Offside
Throw-in Throw-in Reaches teammate -
Crossed corner Corner crossed into the box Reaches teammate Offside
Short corner Short corner Reaches teammate Offside
Crossed free-kick Free kick crossed into the box Reaches teammate Offside
Short free-kick Short free-kick Reaches team mate Offside
Take on Dribble past opponent Keeps possession -
Foul Foul Always fail Red or yellow card
Tackle Tackle on the ball Regains possession Red or yellow card
Interception Interception of the ball Always success -
Shot Shot attempt not from penalty or free-kick Goal Own goal
Shot from penalty Penalty shot Goal Own goal
Shot from free-kick Direct free-kick on goal Goal Own goal
Save by keeper Keeper saves a shot on goal Always success -
Claim by keeper Keeper catches a cross Does not drop the ball -
Punch by keeper Keeper punches the ball clear Always success -
Pick-up by keeper Keeper picks up the ball Always success -
Clearance Player clearance Always success -
Bad touch Player makes a bad touch and loses the ball Always fail -
Dribble Player dribbles at least 3 meters with the ball Always success -
Run without ball Player runs without the ball Always success -
Table 4: Overview of the action types in the data set alongside their descriptions. The Success? column
specifies the condition the action needs to fulfill to be considered successful, while the Special column
lists additional possible result values.
B Five best-ranked players per position for the 2016/2017 season
This section lists the five best-ranked players per position for the 2016/2017 season.
20CENTRAL STRIKERS SEASON 16/17
PLAYER TEAM RATING
1 Kylian Mbappé Monaco 0.823
2 Harry Kane Tottenham Hotspur 0.626
3 Papu Gomez Atalanta 0.609
4 Dries Mertens Napoli 0.608
5 Alexis Sánchez Arsenal 0.588
WINGERS SEASON 16/17
PLAYER TEAM RATING
1 Lionel Messi Barcelona 1.041
2 Arjen Robben FC Bayern Munchen 0.729
3 Eden Hazard Chelsea 0.602
4 Mohamed Salah AS Roma 0.584
5 Junior Stanislas Bournemouth 0.580
MIDFIELDERS SEASON 16/17
PLAYER TEAM RATING
1 Isco Real Madrid 0.599
2 Kevin De Bruyne Manchester City 0.558
3 Cesc Fàbregas Chelsea 0.550
4 Éver Banega Internazionale 0.529
5 David Silva Manchester City 0.498
21WING BACKS SEASON 16/17
PLAYER TEAM RATING
1 Lukasz Piszczek Borussia Dortmund 0.523
2 Markus Suttner FC Ingolstadt 04 0.413
3 Aleix Vidal Barcelona 0.391
4 Marcelo Real Madrid 0.384
5 Christian Fuchs Leicester City 0.378
CENTRE BACKS SEASON 16/17
PLAYER TEAM RATING
1 Leonardo Bonucci Juventus 0.328
2 Vlad Chiriches Napoli 0.319
3 Thiago Silva PSG 0.317
4 Aleksandar Kolarov Manchester City 0.316
5 Daniele Rugani Juventus 0.303
GOALKEEPERS SEASON 16/17
PLAYER TEAM RATING
1 Jordan Pickford Sunderland 0.307
2 Tom Heaton Burnley 0.278
3 Oliver Baumann TSG 1899 Hoffenheim 0.266
4 Ørjan Nyland FC Ingolstadt 04 0.263
5 Benjamin Lecomte Lorient 0.255
C Five best-ranked players per position for the 2017/2018 season
This section lists the five best-ranked players per position for the 2017/2018 season.
22CENTRAL STRIKERS SEASON 17/18
PLAYER TEAM RATING
1 Lionel Messi Barcelona 1.283
2 Sergio Agüero Manchester City 0.884
3 Falcao Monaco 0.823
4 Antonio Sanabria Real Betis 0.688
5 Cédric Bakambu Villarreal 0.669
WINGERS SEASON 17/18
PLAYER TEAM RATING
1 Neymar PSG 1.005
2 Memphis Depay Lyon 0.661
3 Goncalo Guedes Valencia 0.645
4 Malcom Bordeaux 0.625
5 Leroy Sané Manchester City 0.598
MIDFIELDERS SEASON 17/18
PLAYER TEAM RATING
1 Nabil Fekir Lyon 0.857
2 Luis Alberto Lazio Roma 0.681
3 Enis Bardhi Levante 0.617
4 Nuri Sahin Borussia Dortmund 0.608
5 Paulo Dybala Juventus 0.601
23WING BACKS SEASON 17/18
PLAYER TEAM RATING
1 Thomas Meunier PSG 0.551
2 Aleksandar Kolarov AS Roma 0.540
3 Ben Davies Tottenham Hotspur 0.446
4 Faouzi Ghoulam Napoli 0.426
5 Philipp Max FC Augsburg 0.394
CENTRE BACKS SEASON 17/18
PLAYER TEAM RATING
1 Bastos Lazio Roma 0.510
2 Kalidou Koulibaly Napoli 0.444
3 Nacho Monreal Arsenal 0.413
4 Willi Orban RB Leipzig 0.406
5 Sokratis Borussia Dortmund 0.402
GOALKEEPERS SEASON 17/18
PLAYER TEAM RATING
1 Vid Belec Benevento Calcio 0.260
2 Alexander Schwolow SC Freiburg 0.255
3 Lukás Hrádecky Eintracht Frankfurt 0.252
4 Kasper Schmeichel Leicester City 0.248
5 Alisson AS Roma 0.243
24You can also read