Addressing increased customer demand requirements in the Gillieston Heights area - PROJECT ASSESSMENT REPORT - Ausgrid
←
→
Page content transcription
If your browser does not render page correctly, please read the page content below

Addressing increased
customer demand
requirements in the
Gillieston Heights area
PROJECT ASSESSMENT REPORT

SEPTEMBER 2019
Contents
     EXECUTIVE SUMMARY ....................................................................................................... 3
     1       INTRODUCTION ......................................................................................................... 4
             1.1 Purpose of this document ................................................................................. 4
             1.2 Contact details................................................................................................... 4
     2       DESCRIPTION OF IDENTIFIED NEED ...................................................................... 5
             2.1 Overview of Gillieston Heights Area ................................................................. 5
             2.2 Description of capacity constraint ..................................................................... 5
             2.3 2019/20 requirement ......................................................................................... 6
             2.4 2020/21 and 2021/22 requirement .................................................................... 7
             2.5 Customer Demand Characteristics ................................................................... 9
             2.6 Proposed preferred network option ................................................................. 11
     3       DEMAND MANAGEMENT ASSESSMENT .............................................................. 12
             3.1 Initial cost benefit analysis .............................................................................. 12
     4       ASSESSMENT OF DM OPTIONS ............................................................................ 13
             4.1 Options considered ......................................................................................... 13
             4.2 Preferred option .............................................................................................. 13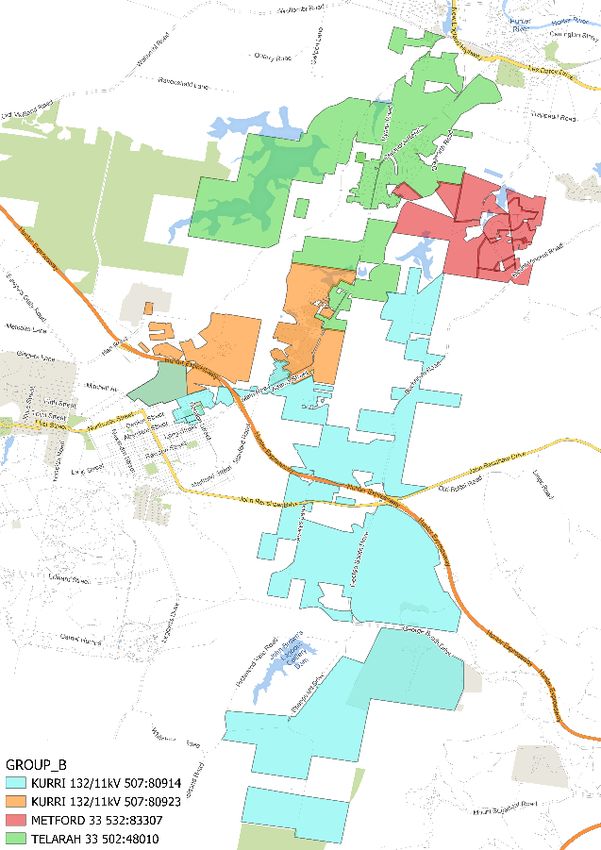
Executive Summary

This Project Assessment Report has been prepared by Ausgrid and represents the final step in
Ausgrid’s assessment of options for ensuring the growing customer demand in the Gillieston Heights
supply area is addressed in the most economic manner.
Ausgrid identified an emerging network constraint associated with three interconnected 11kV feeders
(Metford 83307, Telarah 48010 and Kurri 80923). The proposed preferred network option involves
the installation of new underground cables, reconductoring and augmentation of identified sections of
overhead lines in the Gillieston Heights area for an estimated cost of $695,000.
A preliminary assessment indicated there was potential to use demand management techniques to
defer the proposed supply-side solution. In early May 2019, Ausgrid issued a Request for Proposals
(RFP) seeking market submissions to address the identified need. Only one submission was
received, which was assessed as being non-viable.
Following the unsuccessful market engagement process, Ausgrid assessed the feasibility of several
internally developed solutions based upon past demand management trials and projects. Assessed
options included power factor correction, non-residential demand response and residential air-
conditioner (AC) load control.
A one-year deferral of the network investment using residential air conditioner load control was found
to offer a viable, cost efficient alternative and was selected as the preferred solution. And while
deferral of the network investment for more than one year was not determined to be cost effective, the
option for further deferral of the investment will be considered in early 2020 before committing to the
network investment.
Ausgrid intends to deliver the demand management solution in 2019. In particular, we intend to make
offers to customers in September 2019 so as to ensure that air conditioner load control equipment is
installed and operational November 2019 for availability in Summer 2019/20.
1          Introduction

This Project Assessment Report (PAR) has been prepared by Ausgrid to report on the assessment of
an identified network need in the Gillieston Heights area in the Maitland LGA of NSW.
Ausgrid identified an emerging network constraint associated with three interconnected 11kV feeders
(Metford 83307, Telarah 48010 and Kurri 80923). Over the last decade the region surrounding
Gillieston Heights has changed from a non-urban to urban planning region due to significant
residential growth. Growth in this area is expected to continue from development of available
residential lots over the next six years.
A preliminary assessment indicated there was potential to use demand management techniques to
defer the proposed supply-side solution. In early May 2019, Ausgrid issued a Request for Proposals
(RFP) seeking market submissions to address the identified need.

1.1        Purpose of this document
The purpose of this Project Assessment Report is to:

      •   Describe the identified need;
      •   Detail the demand management options considered;
      •   Present the results of the cost benefit assessment; and
      •   Identify the preferred option.

1.2        Contact details
Any queries relating to this Project Assessment Report or the demand management project should be
addressed to:
Craig Tupper
Manager, Demand Management & Forecasting
Ausgrid
GPO Box 4009
Sydney 2001
Or
email to: demandmanagement@ausgrid.com.au
2 Description of Identified Need
2.1 Overview of Gillieston Heights Area
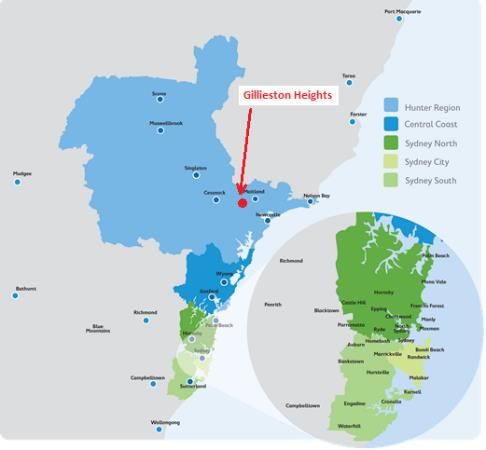
The image below shows Ausgrid’s network area and the approximate location of Gillieston Heights.
Image 1: Gillieston Heights location
2.2 Description of capacity constraint
Electricity demand is forecast to increase in the Gillieston Heights area. The forecast growth is
attributed to several residential developments which are driving capacity constraints on three (3) of
the 11kV distribution feeders in the area.
The following table shows the forecast capacity constraints for each of the three feeders based upon
Ausgrid’s planning criteria.
Table 1 – Annual Forecast Capacity Constraints for affected feeders (kVA)
Year Year Year Year Year
Forecast Capacity Constraints (kVA)
2019/20 2020/21 2021/22 2022/23 2023/24
Metford zone substation feeder 83307 419 965 1511 2057
Telarah zone substation feeder 48010 381 914 1448 1981
Kurri zone substation feeder 80923 190 786 1381 1976 2571Due to the interconnectivity of the local electricity network, outages on one feeder can be supported
by the surrounding feeders. Consequently, the forecast capacity constraint is not the sum of the
forecast capacity constraint for all feeders.
A summary of the demand reductions required to defer network augmentation is presented in table 2
below. As the required demand reduction is a function of the location of the actual customer demand
reductions, the required demand reductions are presented as a range.
Table 2 – Demand reductions required
Number of years deferred Demand reduction required (kVA)
1 190
2 790 - 1000
3 1400 - 1700
2.3 2019/20 requirement
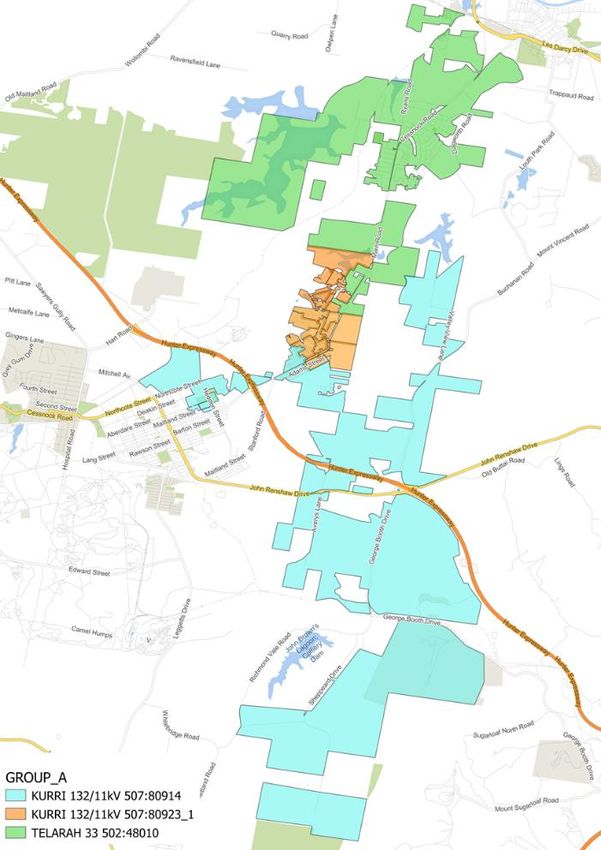
The Kurri zone substation feeder 80923 is the only feeder with a forecast capacity constraint in
2019/20. To support a one-year deferral, a 190kVA reduction in maximum demand is required from
the customers located in the area identified as the Group A region detailed in the table and image
following.
Table 3 – Group A region – customer characteristics
Residential Non-residential
Number of customers 2,840 84
Annual total consumption (MWh) 18,859 7,133
Annual consumption (MWh/customer) 7 85
Number of customers with solar power 613
Percentage of customers with solar power 21%
Total solar power capacity (kW) 2,596
Average solar capacity (kW/customer) 4.2
Number of customers with battery systems 15 0
Number of customers with smart meters 347 16
Percentage of customers with smart meters 9% 30%Image 2: Group A region map - 2019/20 network need area 2.4 2020/21 and 2021/22 requirement
In 2020/21 and beyond, there is a forecast capacity constraint on each of the three feeders. Due to
interconnections of feeders, demand management can be implemented on a broader group of
customers to achieve the required load reduction.
In 2020/21, we estimate that a customer demand reduction of about 790-1000kVA across all relevant
feeders (customers identified as group B) can delay network upgrades for another year. For 2021/22,
we estimate that a customer demand reduction of about 1400-1700kVA across all relevant feeders
(customers identified as group B) can delay network upgrades for a further year.
Customers in group B are located on feeders 48010, 80923 and 80914 and a restricted group of
customers supplied from feeder 83307. Customers in group B consist of those customers in group A,
plus an additional set of customers.
The customers in the Group B region are described in Table 4 below.
Table 4 – Group B region – customer characteristics

                                                     Residential         Non-residential
 Number of customers                                    3,054                   94
 Annual total consumption (MWh)                         21,315                10,557
 Annual consumption (MWh/customer)                         7                    112
 Number of customers with solar power                                  672
 Percentage of customers with solar power                              21%
 Total solar power capacity (kW)                                      2,946
 Average solar capacity (kW/customer)                                   4.4
 Number of customers with battery systems                 16                     0
 Number of customers with smart meters                   311                    19
 Percentage of customers with smart meters               10%                   27%

The Group B region is shown in image 3 following.
Image 3: Group B region map - 2020/21 and 2020/21 network need area 2.5 Customer Demand Characteristics
To illustrate the annual and daily trends for customer demand in the Gillieston Heights, load data for
the relevant feeders are presented below.
Figure 1 below shows the combined demand on the four feeders, to give an indication of the seasonal
timing of peak demands. Note that peak demand, and therefore the requirement to defer the
maximum, occurs on [hot] summer days.

Figure 1 – 2018/19 annual demand – all 11kV feeders combined

                20

                18

                16

                14
  Demand (MW)

                12

                10

                 8

                 6

                 4

                 2

                 0
                     14-07-2018

                     26-11-2018
                           Date
                     11-04-2018
                     21-04-2018
                     02-05-2018
                     12-05-2018
                     23-05-2018
                     02-06-2018
                     12-06-2018
                     23-06-2018
                     03-07-2018

                     24-07-2018
                     03-08-2018
                     14-08-2018
                     24-08-2018
                     04-09-2018
                     14-09-2018
                     25-09-2018
                     05-10-2018
                     15-10-2018
                     26-10-2018
                     05-11-2018
                     16-11-2018

                     06-12-2018
                     17-12-2018
                     27-12-2018
                     07-01-2019
                     17-01-2019
                     28-01-2019
                     07-02-2019
                     17-02-2019
                     28-02-2019
                     10-03-2019
                     21-03-2019
                     31-03-2019
Figure 2 following displays the demand profile for each of the four feeders for a peak day during the
2018/19 summer period. This chart shows that maximum demand on all feeders is coincident on the
four feeders, representing the mainly residential load where demand peaks in the early evening on
hot days. Analysis on the demand during the maximum demand days in 2018/19 show that peak
loads largely fall between 5pm and 8pm.
Figure 2 – 2018/19 peak day demand
6.0
Fdr 48010
Fdr 80914
5.0
Fdr 80923
Fdr 83307
4.0
MW
3.0
2.0
1.0
0.0
04:00
21:00
00:00
01:00
02:00
03:00
05:00
06:00
07:00
08:00
09:00
10:00
11:00
12:00
13:00
14:00
15:00
16:00
17:00
18:00
19:00
20:00
22:00
23:00
The load distribution curve (Figure 3 below) for each feeder highlights the ‘peakiness’ of the
customers demand on each feeder. The load duration curve is constructed by sorting the feeder’s 15-
minute electricity data from highest to lowest.
Figure 3 – load duration curves from Gillieston Heights feeders
6.0
Fdr 48010
5.0 Fdr 80914
Fdr 80923
Fdr 83307
4.0
MW
3.0
2.0
1.0
0.0
0% 10% 20% 30% 40% 50% 60% 70% 80% 90% 100%
Percentage of time
2.6 Proposed preferred network option
The proposed preferred network option involves the installation of new underground cables,
reconductoring and augmentation of identified sections of overhead lines in the Gillieston Heights
area for an estimated cost of $695,000.3 Demand Management Assessment
3.1 Initial cost benefit analysis
The funds available for non-network solutions were determined by Ausgrid based on technical and
financial modelling of the likely costs and benefits of implementing non-network solutions to defer
capital expenditure. The net present value of all costs and benefits associated with deferring the
proposed network solution for either 1, 2 or 3 years were compared against the without-deferral case
to determine the fund available for DM. The assessment was carried out using NPV analysis over a
20 year time horizon and included the following costs and benefits which accrue to customers:
• Benefit: Avoided unserved energy (reduced involuntary load shedding) due to reducing grid-
supplied demand for the deferral scenarios and implementation of the proposed preferred
supply option based on a VCR of $40,000/MWh;
• Benefit: Terminal (depreciated) value of capital assets in year 20 based on an assumed
nominal asset life of 40 years;
• Benefit: An estimated option value where for every year of deferral, the capital cost of the
supply-side solution decreases by 5%;
• Cost: Capital cost of proposed preferred supply option; and
• Cost: Estimated costs of demand response (DR).
The table below summarises the outcomes of the cost benefit assessment that was included in the
Request for Proposals (RFP), to achieve 1, 2 or 3 years deferral of the supply-side project. The
present value (PV) figures below were based on a discount rate of 3.86% used in NPV analysis.
MVA Timing of PV of PV of Est DM
Reduction DM DM Estimated cost Funds
Deferral
Required reduction Budget DM cost as % available
Years
available ($) of ($/kVA/yr)
($) budget
1 0.2 2019/20 $54,000 $35,000 64% $282
2 0.8 2020/21 $103,000 $126,000 122% $66
3 1.4 2021/22 $149,000 $261,000 175% $36
The estimated cost of non-network alternatives was estimated to be 64%, 122% and 175% of the
available funds for 1, 2 and 3 year deferral scenarios, respectively. Based on this assessment,
Ausgrid determined that demand management could potentially defer the proposed preferred network
option.
Further, taking into account both the MVA reduction required and DM budget available, Ausgrid
considered a 1 year deferral as the most attractive deferral scenario as it offered the highest NPV of
around $329,000 when compared against a “do-nothing” scenario. Applying sensitivity analysis over
key inputs and assumptions in the cost benefit assessment for a 1 year deferral, namely the cost of
the proposed preferred supply option and option value to account for uncertainty, resulted in $37,000
to $66,000 as an available project budget range.4 Assessment of DM options
This section describes the credible demand management (non-network) options considered.
4.1 Options considered
Option 1 –Residential behavioural demand response
In early May 2019, Ausgrid issued a Request for Proposals (RFP) seeking market submissions to
address the identified need using the procurement portal Tenderlink. Only one submission was
received in response.
Option 1 proposed a residential behavioural demand response type solution. The proposal did not
include the costs for activities such as marketing and customer acquisition, smart meter installation,
customer incentive payments and project management.
These additional costs increased the total cost to about 220% of the upper limit of the available
project budget. This assessment uses an updated discount rate of 3.22% based on Ausgrid’s 2019-24
regulatory determination.
Based on this assessment, Option 1 was considered not economically viable.
Option 2 – Customer power factor correction
Of the 84 non-residential customers in the affected network area, around 4 are on a kVA demand
tariff. Analysis of customer interval data indicates there is no technical or commercial potential since
all customers on a kVA demand tariff have power factors over 0.96.
Option 3A – Residential air-conditioner demand response
The feeder demand profiles strongly indicates high levels of ownership of air conditioners in the area.
Ausgrid past CoolSaver trials indicated that the use of residential air-conditioning (AC) load control to
supply the necessary demand reductions was potentially feasible and cost effective. This solution
involves the following:
• Offer incentives (upfront sign-on bonus and post-season payment) to customers in the
affected network area to participate in the load control program;
• Install Demand Response Enabling Devices (DREDs) on participating customer air-
conditioner (AC) units; and
• When required, activate the power saving modes on the AC units for participating customers
via a ripple control signal to the DREDs from Ausgrid’s control room (same system used to
control ½ million residential hot water heaters).
Option 3B – Residential battery demand response
A total of about 15 customer battery systems were identified as connected to the Ausgrid network in
the affected area with one identified as participating in a Virtual Power Plant (VPP). While the
potential demand reductions from leveraging the available battery systems are small, the cost might
be low considering the current operation of the Ausgrid VPP project.
4.2 Preferred option
A proposed project based upon Option 3 was developed and estimated to have a project cost of
$49,000 to $64,000 including purchase and installation of DREDs, marketing, customer incentive
payments and project management. This solution principally involves the use of residential air
conditioner demand response, with the potential for a small element of support from residential
battery demand response.This option is expected to deliver net present benefits in the range $290,000 to $460,000 when compared against a “do-nothing” scenario. These NPV figures use an updated discount rate of 3.22% based on Ausgrid’s 2019-24 regulatory determination. Based on cost-benefit assessment, Ausgrid considers this solution to be an efficient non-network option to reduce load at risk on the relevant 11kV feeders for the upcoming summer 2019/20, deferring the proposed supply-side solution until summer 2020/21. And while deferral of the network investment for more than one year was not determined to be cost effective, the option for further deferral of the investment will be considered in early 2020 before committing to the network investment. Option 3 is the preferred option and, accordingly, Ausgrid is proceeding with development of this project as an eligible demand management proposal under the DMIS guidelines.
You can also read