ADVENTURE TOURISM DEVELOPMENT INDEX 20202020 - Adventure Travel Trade ...
←
→
Page content transcription
If your browser does not render page correctly, please read the page content below
ADVENTURE TOURISM
DEVELOPMENT INDEX
         A2020
           TDI
            2020

             POWERED BY

 ADVENTURE TRAVEL
  T R A D E A S S O C I AT I O N
                                   1
INTRODUCTION
    Welcome to the 2020 edition of the Adventure                 tourism industry in a post-Covid-19 world will require
    Tourism Development Index (ATDI), a joint initiative         coordination, planning and shared responsibility
    of The George Washington University International            between many stakeholders: destination manag-
    Institute of Tourism Studies (GW) and the Adventure          ers, business owners, policy makers and the local
    Travel Trade Association (ATTA). The ATDI is a tool          community.
    for anyone working in tourism development, but es-
    pecially for Destination Management Organizations            Readers of the 2020 ATDI are invited to analyze not
    (DMOs) or other public institutions working on               only the adventure tourism competitiveness of their
    tourism. The ATDI assesses the potential and                 destinations but also its overall resilience. In partic-
    readiness of countries to compete in the global              ular, Pillar 3, Health; Pillar 7, Entrepreneurship and
    adventure tourism market based on their scores in            Pillar 8, Humanitarian, provide important insight into
    ten pillars. The pillars measure country-level perfor-       a destination’s readiness to weather a public health
    mance in areas relevant to planners, policy makers           crisis. It is likely that elements measured within
    and tourism entrepreneurs.                                   these pillars, such as the number of hospital beds
                                                                 per resident, will become real concerns of future
    The analysis for this year’s report occurs while the         travelers when they select destinations.
    world is in the midst of a global pandemic caused by
    the rapid spread of Covid-19 (coronavirus). The virus        To more deeply explore the sustainability dimension
    has effectively caused a total shutdown of the glob-         of adventure tourism competitiveness worldwide,
    al tourism industry. From Buenos Aires to Beijing,           GW and ATTA partnered with the Global Sustainable
    hotels have closed, guides are out of work, opera-           Tourism Council (GSTC). The GSTC manages sus-
    tors are laying off staff and airlines are requesting        tainable tourism standards (the GSTC Criteria) and
    government bailouts.                                         provides international accreditation for sustainable
                                                                 tourism. The GSTC Global Destination Sustainability
    The United Nations World Tourism Organization                Report is provided as a companion to this report
    (UNWTO) forecasts a 20-30% drop in international             and analyzes 24 destinations that have applied the
    tourist arrivals in 2020 compared to 2019 figures.           GSTC Destination Criteria and Indicators. These
    The magnitude of this fall is unprecedented com-             geographically diverse destinations vary in their
    pared to recent past crises. For instance, the UNW-          level of tourism development. When used as a com-
    TO reports that international tourist arrivals declined      panion piece to the ATDI, the GSTC analysis pro-
    by 4% in 2009 during the global economic crisis and          vides additional insights into destination sustainabil-
    0.4% during the SARS outbreak in 2003.                       ity challenges and opportunities. While the ATDI is
                                                                 focused on country-level competitiveness insights,
    The World Travel and Tourism Council (WTTC) fore-            the GSTC-D report is regional and local in scope.
    casts that the crisis will cost fifty million tourism jobs   An in-depth side-by-side analysis of the ATDI and
    worldwide, with Asia being hit the hardest and los-          the GSTC-D is featured throughout the document. In
    ing thirty million tourism jobs. The UNWTO expects           addition to the ATDI, we hope you will also review
    that the unprecedented decrease in international             the companion report, GSTC Global Destination
    tourist arrivals will translate into a decline in inter-     Sustainability Report, which presents a snapshot of
    national tourism receipts of between US$300-450              common destination sustainability challenges and
    billion, which represents one-third of the US$1.5            good practices.
    trillion generated in 2019.
                                                                 As our world faces increasingly severe crises—due
    The coronavirus pandemic demonstrates the urgent             to climate change, health pandemics, terrorism
    need for a sustainable leadership approach—one               and other mega-threats—only destinations that are
    that focuses on resiliency, resourcefulness and              healthy and have a solid sustainable management
    efficiency. Now more than ever, destination manag-           plan in place are likely to remain competitive in the
    ers, business owners and other sector leaders must           long-term.
    demonstrate critical thinking skills and leadership
    approaches to survive through the current crisis and
    prepare for recovery. Building a resilient and healthy
2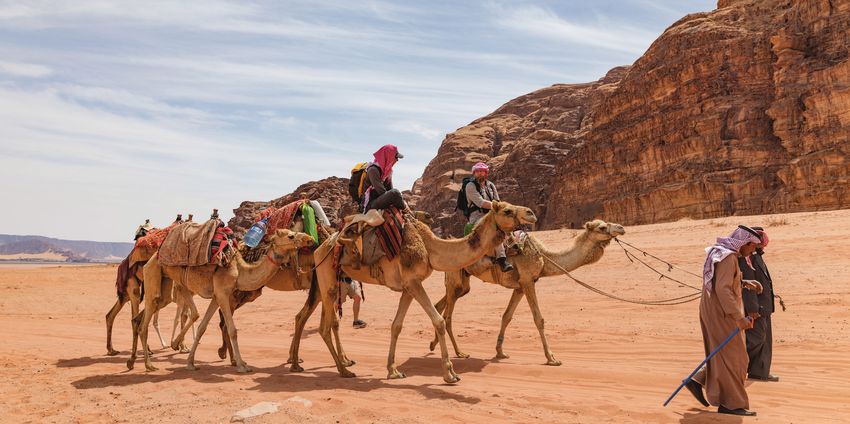
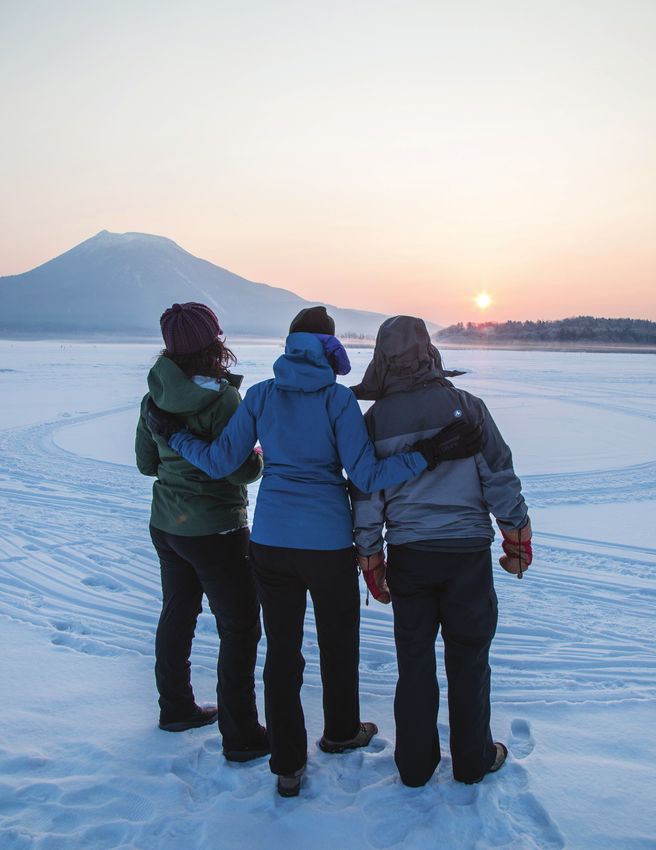
The coronavirus pandemic
                           demonstrates the urgent need for a
                            sustainable leadership approach—
                                one that focuses on resiliency,
                               resourcefulness and efficiency.

© ATTA / Kristen Kellogg
                                                                  3
ABOUT THE ATDI
          The ATDI examines ten factors (10 pillars of Adventure Market Competitiveness) in three categories:

      SAFE & WELCOMING                             ADVENTURE                           READINESS
       Sustainable Development                   Entrepreneurship                      Humanitarian
                Safety                          Adventure Resources                    Infrastructure
          Natural Resources                                                          Cultural Resources
                Health                                                                     Image

     The ATDI measures elements of tourism development that destination managers can change, as well as some
     that are simply out of their hands (one cannot create more coastline, for example). A country’s scores can help
              tourism managers and developers grapple with the challenge of honing in on where to focus.

     Ultimately, what the ATDI demonstrates is that adventure tourism competitiveness relies on an interconnected
     web of factors, none of which are the remit of any one agency or department. Rather, tourism competitiveness
    requires a comprehensive approach across government ministries, with private sector collaboration. This coordi-
                  nation can be referred to as ‘tourism governance,’ and takes practical form in policy.

                                     The ATDI is a tool for tourism destination stakeholders to measure
                                     their adventure competitiveness against competing destinations,
                                     allowing them to identify strengths and weaknesses for the develop-
                                     ment of a strong adventure market.

            How to                   From year to year the country rankings in the ATDI shift based on
                                     individual country scores in each of the categories. In addition to
            Use the                  country rank, countries are encouraged to consider the cluster in
                                     which they fall. Clusters are based on the groupings of countries with
                                     similar competitive scores such that the countries in the same cluster
              Index                  represent a competitive set. There are three clusters: High, Medium
                                     and Low. In the data sheet, posted at www.adventureindex.travel, the
                                     mean score is highlighted in blue. Countries in the top quartile are
                                     part of the “High” cluster and are highlighted in green. Countries in
                                     the bottom quartile are part of the “Low” cluster and are highlighted
                                     in yellow. Countries ranked “Medium” or “Low” should aim to move
                                     into the ‘high cluster.’

          © ATTA / Kristen Kellogg                                                                            © ATTA / Hassen Salum

4
TOP TEN COUNTRIES FOR
         ADVENTURE TRAVEL
The ATDI’s top ten list, as per table 1 highlights countries showing strong potential for adventure tourism competitiveness
Recall that the ATDI does not capture visitor numbers and is not a ranking for volume of tourists.

Table 1: Top Ten Ranked Countries in 2020 and 2018

                           DEVELOPED COUNTRY                                    DEVELOPING COUNTRIES
                                RANKINGS                                              RANKINGS
                       2020                     2018                          2020                         2018
     1                 Iceland                  Iceland                  Czech Republic               Czech Republic
     2              Switzerland              Switzerland                       Chile                        Israel
     3             New Zeland                  Germany                   Slovak Republic                  Estonia
     4               Germany                New Zealand                      Slovenia                 Slovak Republic
     5                Norway                   Norway                          Israel                      Poland
     6                 Finland                 Sweden                         Estonia                       Chile
     7                Sweden                   Canada                         Poland                      Romania
     8                Canada                    Finland                      Bulgaria                     Bulgaria
     9               Denmark               United Kingdom                    Romania                      Slovenia
    10                Australia                Australia                    Costa Rica                     Jordan

© ATTA / Kristen Kellogg

                                                                                                                              5
Notable Movement in the Top Ten 2018 - 2020:
    Developed Countries:
    •   For the third year in a row, Iceland claims the top spot as the most competitive destination in the world. Iceland scores
        especially high in Adventure Activity Resources and is viewed positively by our expert panel.

    •   Switzerland has the top score in Pillar 1, Sustainable Development due to its low unemployment rate and high score in
        Environmental Protection Index. It ranks high in almost all other pillars, though its Adventure Activity score is compar-
        atively low (and decreased this year) due to an increase of species in danger according to the International Union for
        Conservation of Nature (IUCN).

    •   Due to its score in Natural Resources and Adventure Activity resources, the United Kingdom fell out of the top ten,
        while Denmark moved up three spots to number nine.

    Developing Countries
    •   For the fourth year in a row, the Czech Republic maintains its position as the most competitive adventure market within
        the developing country set. The Czech Republic doesn’t dominate in any one pillar, but rather scores consistently well
        across the board, with no notable weak points.

    •   Israel dropped from second to fifth in the developing country set. This is due to a decrease in Natural Resources score
        caused by an increase in population density as well as expert opinion. Israel has one of the highest population densi-
        ties within the Organization for Economic Co-operation and Development (OECD), with 410 people per square kilome-
        ter.

    •   Costa Rica enters the top ten for the first time since 2013, due to increases in expert perception in regards to safety and
        culture.

    •   Jordan drops ten spots mainly due to the score in Pillar 4, Natural Resources. The country experienced a seven point
        increase in the rate of urbanization (from 83% to 90%), and people per square meter (from 106 to 112); these changes
        impacted its Pillar 4 score.

    Key Findings:
    •   Nations around the world are increasing the amount of protected marine and terrestrial areas. Expanded protected
        area management systems have the add-on benefit of protecting the habitats of many endangered species.

    •   Countries that have instituted policies designed to mitigate and adapt to climate change are seeing the impacts in their
        Environmental Performance Index scores and ultimately in their Pillar 1, Sustainable Development scores. Island nations,
        such as Barbados and Seychelles, are making the most progress in this area.

    •   The worst performing countries are predominantly poor countries, in a post-conflict or conflict situation,such as Su-
        dan and Somalia. While tourism is not a priority for rulers in these countries, it is worth noting that many many popular
        adventure tourism destinations, such as Rwanda, Croatia and Slovenia, have had relatively recent civil wars and used
        tourism as a tool for economic development, job creation and rebuilding post-conflict.

    •   The Corruption Perception Index indicates that corruption weakens democratic institutions. In early 2020 (and as this
        report is being written), the world is grappling with the Covid-19 virus that is closing borders and suspending tourism. In
        Pillar 3, Health, the ATDI measures the number of physicians, hospital beds and nurses and midwives per 1000 people,
        because a healthy population is an important element of adventure competitiveness. In the wake of the pandemic, the
        quality and availability of medical resources in a destination will probably increase in importance for travelers.
6
METHODOLOGY
The ATDI scorecard is the only country-level ranking index for adventure tourism that incorporates data from non-subjective
 sources, offering a perspective to complement what surveys and expert opinion about individual destinations can reveal.
 Using data from a wide variety of indicators and a diversity of sources including GDP, population density statistics, protect-
 ed areas, the Environmental Performance Index, the World Resources Institute, Foreign and Commonwealth Travel Warn-
 ings, in addition to survey data from industry experts, the ATDI provides policymakers and tourism planners with a unique
                                          look at the adventure tourism opportunity.

    Countries recognized by the United Nations are benchmarked in the ATDI and are represented in two groups: Developed
       Countries and Developing Countries. ATDI 2020 includes 28 Developed Countries and 163 Developing Countries.

The ATDI uses a combination of third-party data and expert opinions. The composition of each pillar is provided in the Excel
                           Workbook, available for download on www.adventureindex.travel.

Countries with missing data points were given a score equivalent to the average of their geographical region where it made
                                     sense,1 otherwise they received a score of one.

However, if more than five data points were missing the country was dropped from the ATDI calculations. Twenty-one coun-
                                 tries (11% of the total) had at least one missing data point.

                                          Methodology Changes:
    In 2020, one methodology change was made in Pillar 8. While previously countries were given a score of 1 if they were not
                       ranked in the Happy Planet Index (HPI), this year a regional average was inputted.

    It is also worth noting that the Yale Environmental Performance Index (EPI) included changes to its methodology that result-
     ed in reduced scores for nearly all countries in Pillar 1, which incorporates EPI scores. An indicator was removed (‘Environ-
    mental Risk’) and a new one was introduced (‘Heavy Metals’ which calculates lead exposure). Furthermore, the indicator on
     tree cover loss changed from a 14-year average to a five-year moving average to better understand the responsiveness of
                                               trends in deforestation to policy decisions.

                                                          Expert Panel
   ATDI uses a panel of industry experts to help determine pillar scores for specific components of the index. Experts are
  people with more than five years of experience in the adventure travel industry. They are able to comment on any of the
countries that they have visited in the past five years. One expert may comment on several countries. The ATDI uses a mov-
                   ing average of expert survey results. Each country has at least three expert responses.

In 2020, there were 360 experts on the panel; 41 percent were women and 59 percent were men. On average, experts had
              15 years of experience in tourism and 12 years in adventure tourism. ATDI experts consisted of:

           41%                    57.6%                              9.1%                          18.5%                              27%
                                   Tour                              Travel                       Developer                            Other
          59%                     Operator                           Writer

•      Other: tourism development consultant, travel advisor and writer, travel agent, travel marketer, etc.

1
 There are three indicators where we do not take regional averages: expert opinion (if the country has never received an expert opinion; this has hap-
pened, for example with the island nation of Niue), percentage of protected area and Economic Freedom Index).
                                                                                                                                                         7
Adventure Tourism Defined
     Adventure tourism contains essential elements that make up the entire experience (nature, activity, and culture), which are
      used by the travel trade to understand if a specific product can be classified as ‘adventure travel.’ These elements come
    together to deliver specific types of experiences for travelers who are motivated by goals such as transformation, challenge
                                                             and wellness.

    The left side of the chart above illustrates the essential components of an adventure travel trip: nature, culture and activity.
       Adventure travel providers will note how the individual elements come together to deliver an overall experience under-
     scoring the importance of considering the components of a trip as individual ingredients, and also staying attuned to how
    they all fit together. This might mean considering carefully the sequencing of activities, the duration, and the time given for
     talking about or reflecting on the experience. As well, the components adventure travel are located within the concept of
      ‘impact.’ For developers of adventure travel products, impact is an important consideration: considering and planning for
     impact is a basic, foundational concern; all travel providers are operating in an environment in which they have impact on
                                                          the places they visit.

     From the traveler’s perspective, on the right side of the graphic, research indicates that adventure travel is motivated by a
     variety of longings and desires that influence how they consume and emotionally process their trip. Travelers are seeking
    mental and physical wellness, novel and unique experiences, challenge—whether physical or cultural—and often, ultimately:
    transformation. Travelers are also keenly aware of their impact, and have a desire to have a positive impact on the environ-
                                                        ment and communities.

    To meet the definition of adventure travel, a trip must take an individual outside of his or her regular environment for more
    than 24 hours—and for no longer than one year—and include at least two of the following three experiences: participation
    in a physical activity, a visit to a natural environment and a culturally immersive experience. (Trips longer than one year are
                                               not considered ‘travel’ in the research context).

     From an activity perspective, the traveler perception of ‘adventure’ is always shifting. A sampling of activities associated
     with adventure travel could include things like: joining an archeological expedition; backpacking; bird watching; camping,
       caving; climbing; getting to know the locals; hiking; horseback riding; kayaking; whitewater rafting; learning a new lan-
      guage; orienteering; joining a research expedition or safari; sailing, scuba diving; snorkeling; skiing and snowboarding;
                                                      surfing; trekking and many others.

8
BIG MOVERS
In the developed country set, there were no significant movements in ranking. The two countries which made big move-
ments, Liechtenstein and Monaco, were missing data points and benefited from increased regional averages, such as
the Environmental Performance Index.

However, it is worth noting that the United States and Belgium dropped from the middle tier down to the bottom tier of
countries.

      United States
The United States lost nearly two points in Pillar 4, Natural Resources and in Pillar 5, Cultural Resources, both as a result
of low scores from the expert panel. This might be a reaction to the United States recently downgrading or downsizing
protected areas, including the Bears Ears and Grand Staircase-Escalante national monuments.2 It is worth nothing that the
United States has one World Heritage Site, Everglades National Park, that is categorized as being ‘in danger,’ (an indicator
for Pillar 5).

      Belgium
Belgium has never scored particularly high on the ATDI, but this year dropped to 21st place. This was due to a loss of 2.6
points in Pillar 4, Natural Resources, caused by a slight increase in population density and a drop in expert opinion.

Within the developing country set, a few countries made noticeable jumps in rank.

      Slovenia
In 2014, Slovenia launched the Slovenia ‘Green Scheme of Slovenian Tourism,’ a certification tool for both destinations and
providers to encourage and increase sustainable tourism development in the destination. While not directly connected to
an ATDI pillar, these efforts contribute to strengthening the enabling environment for adventure tourism, which is illustrated
by a five-point increase in rank from Slovenia from ninth place to fourth place. This was due in part to two point five increas-
es in Pillar 8, Humanitarian, caused by an increased number of NGOs operating in the country. Slovenia also increased by
0.4 points in Pillar 2, Safety, due to an increase in the CPI score.

      Sudan
Since a transition government came into place in Sudan in early 2019, more tourists are visiting the country, not least to
explore its pyramids, which were built by the Nubians. The country has reduced visa and travel restrictions and is hoping to
increase the number of tourists in the coming years. On the ATDI, Sudan moved up in the index from 159 to 142. For the first
time, Sudan was included in the Economic Freedom Index. The country scores low (45/100), but this score is better than the
regional average that was previously inputted. In Sudan, government spending is high, but rule of law, regulatory efficiency
and open markets score poorly. Sudan also increased ten points in the Environmental Performance Index, with particularly
high scores in ecosystem vitality, including forest coverage and fisheries.

2
 Kroner, R. E. G., Qin, S., Cook, C. N., Krithivasan, R., Pack, S. M., Bonilla, O. D., ... & He, Y. (2019). The uncertain future of protected lands and
waters. Science, 364(6443), 881-886.
                                                                                                                                                          9
Dominica
     Dominica jumped ten points from 22nd to thirteenth position in 2020. Tourism represents 11% of GDP for the island nation,
     but often suffers from setbacks due to natural disasters. The increase in score came from a 1.34-point jump in Pillar 5, Cul-
     tural Resources, which can be attributed to an increase in marine and territorial areas under conservation.

          Barbados
     Barbados moved up 11 places from rank number 32 to 21. Barbados made small gains in several pillars, namely Pillar 1,
     Sustainable Development due to an increase in its EPI score. The increase in score comes from improvement in the areas
     of ‘Climate and Energy.’ In 2019, Barbados launched the ‘Barbados National Energy Policy,’ a ten-year framework designed
     to achieve 100% renewable energy and to become a carbon-neutral state. It is possible that this change in rank is an early
     success from changes implemented through this policy.

          Costa Rica
     Costa Rica increased its ranking by nine places, moving from number 19 to number ten. Costa Rica improved its score on
     the Corruption Perception Index by two points, which is reflected in the ATDI score of Pillar 2, Safety.

          Serbia
     Serbia increased 13 places from 39th place to 26th place in 2020. Serbia improved its score on the Corruption Perception
     Index, which increased its score in Pillar 2, Safety. Unemployment dropped by 5% (to 10% overall), increasing Serbia’s score
     in Pillar 1, Sustainable Development.

          Micronesia
     The Federated States of Micronesia moved up 24 places from 66th place to 43rd place. Slight increases across the board
     helped Micronesia improve its rank. For example, a slight increase in the Corruption Perception Index resulted in gains in
     Pillar 2, Safety. An improvement in expert opinion led to a one point increase in Pillar 4, Natural Resources. In Pillar 8, Micro-
     nesia benefits from a strong regional average, which is imputed as it is not ranked on this index.

          Seychelles
     Seychelles was ranked 53rd in 2018, and moves up to 30th position in 2020, a jump of 23 places. Seychelles made mas-
     sive improvements in the Environmental Performance Index, ranking first in the ‘Climate and Energy’’ category and 39th
     overall. Similar to Barbados, Seychelles has prioritized mitigating climate change through new policies; for example, innova-
     tive approaches to decarbonization, transitions to renewable energy sources and reduction of greenhouse gas emissions.
     The Seychelles has done commendable work in bringing back species from the brink of extinction, including the Seychelles
     magpie-robin and the Seychelles scops owl. Finally, the Seychelles launched a new marine spatial plan in 2018, putting an
     additional 210,000 square kilometer marine area under formal conservation. This is reflected in an increase in Pillar 5, which
     incorporates protected areas.

10
ATDI Pillars & Rankings per Pillar
This section provides a description of each of the ATDI’s ten pillars and the top three ranked nations in developing and
developed categories.
1. Government Policy that Supports
Sustainable Development
Government policies that support and foster sustainable and rural tourism development are crucial to adventure tourism
market competitiveness because they safeguard the destination’s natural, heritage and cultural resources and provide a
positive investment climate for the private sector. When public and private sector actions are coordinated, the private sector
flourishes, attracting investment and development to a region.
High environmental performance and low unemployment create a favorable climate for sustainable development, and gov-
ernment policies are an important factor in driving country performance in these areas. Two indicators are measured in this
pillar:
1. The Environmental Performance Index
2. Unemployment per country (as percentage of total labor force)
The highest scores in sustainable development are Switzerland, Denmark and Malta. The highest developing country
scores are Israel, Qatar and Belarus (only Belarus was in the top three in 2018). Unemployment rates stayed mostly steady
and therefore shifts in Pillar 1 scores can be attributed to changes in the EPI scores. The chart below shows the top 3 devel-
oped and developing countries in the category of Government Policy that Supports Sustainable Development.
TOP SCORES FOR GOVERNMENT POLICY THAT SUPPORTS SUSTAINABLE DEVELOPMENT
8.79 8.71 9.17 8.6 8.6 8.73 7.46 7.77 7.72 8.24 8.24 8.4 8.49 8.49 8.39 7.56 9.07 8.23
Developed Countries Developing Countries
11Overall, scores stayed mostly consistent in Pillar 1, with the notable exceptions of Congo, Djibouti and Angola which
dropped by three points due to drops in their Environmental Performance Index scores. Singapore dropped by 1.12 points,
to rank 5th in the pillar (last year, Singapore placed 2nd). This is due to a dramatic drop in its EPI score, which can be
attributed to a drop in Air Quality, for which it ranked 134th and Biodiversity and Habitat for which they ranked 175th. The
top performers have unemployment rates under 7% (with Qatar boasting 0.7% unemployment) and have top scores in both
components of the Environmental Performance Index: Environmental Health and Ecosystem Vitality. The EPI notes that the
top performing nations are those that have made long-term commitments to protecting public health, natural resources and
GHG emissions from economic activity.3
Several developed nations such as Singapore and Iceland scored lower in the EPI in 2018 than in previous years, and this
can be attributed to small changes in methodology. An indicator was removed (‘Environmental Risk’) and a new one was
introduced (‘Heavy Metals’ which calculates lead exposure). Furthermore, the indicator on tree cover loss changed from a
14-year average to a five-year moving average to better understand the responsiveness of trends in deforestation to policy
decisions.
2. Safety and Security
This pillar evaluates how safe it is to travel in a country. Countries with high levels of transparency and low or no travel
warnings are safer for travelers. Lower levels of corruption are also a sign of a more secure country. The Safety Pillar is
made up of two indicators and an expert opinion question:
1. The Corruption Perceptions Index
2. Foreign and Commonwealth Travel Warnings
Expert Opinion: Your perception of this destination as safe and secure for travel is: (respondents are given a Likert scale
of Very bad (-3) to Very good (+3)).
The top overall scores for safety and security are three developed nations: Denmark, New Zealand and Switzerland. In the
developing country ranking, the top scorers are: Singapore, Estonia and United Arab Emirates.
TOP SCORES FOR SAFETY AND SECURITY
8.37 8.37 8.8 8.39 8.39 8.78 8.21 8.71 8.7 8.06 8.06 8.64 7.11 8.48 7.79 7.14 7.94 7.78
Developed Countries Developing Countries
3
2018 EPI Report: Results. (2018). Retrieved from https://epi.envirocenter.yale.edu/2018/report/category/hlt
123. Health
The Health Pillar attempts to gauge the level of healthcare available in a country. This pillar assumes that a healthy local
population is more able to foster and nurture new businesses, and to care for its resources responsibly. Availability of good
healthcare is also important to adventure travelers. Sadly, the appearance of the Covid-19 virus in 2020 provides a use-
ful example of the relevance of the Health Pillar to adventure travel. In the coming years, it will be interesting to see how
COVID-19 impacts these countries compared to others.
The Health Pillar is made up of three indicators from the World Health Organization:
1. Hospital beds (per 1000 people)
2. Physicians (per 1000 people)
3. Midwives and nurses (per 1000 people)
A high proportion of beds and health care professionals suggests higher levels of healthcare.
Data for Pillar 3 is pulled from the World Health Organization statistics.
There were no major shifts in score from the previous ATDI, indicating that numbers of beds, physicians, midwives and
nurses mostly held steady over the last two years. While in most pillars, we see developed countries claiming the highest
scores overall, in Pillar 3, Cuba actually ranks second overall with a score of 7.25.
TOP SCORES FOR HEALTH
9.89 8.55 8.55 3.19 6.69 6.69 8.28 6.61 6.61 7.23 7.33 7.25 6.41 6.66 6.66 8.55 6.28 6.28
Developed Countries Developing Countries
134. Natural Resources
Adventure travelers want untrammeled and well-managed natural resources. Destinations with unusual or rare natural
resources, which are well-managed and not exploited, will earn high praise from adventure travelers and be more likely to
sustain market competitiveness.
The Natural Resources Pillar is made up of four indicators and an expert opinion question:
From the World Resources Institute:
1. Urban Concentration
2. Population Density
From CIA World Factbook:
3. Kilometers of coastline
4. Ratio of coast to total area
Expert Opinion: Your perception regarding the variety of natural resources in this destination is: (respondents are given
a Likert scale of Very bad (-3) to Very good (+3)).
Each year, the ATDI adjusts for Canada’s extremely large coastline. To keep it in proportion with the rest of the world, it is
rated at 5,500 instead of its actual score. There is limited movement in the Natural Pillars score, because coastline is un-
changeable and population density also shifts slowly.
TOP SCORES FOR NATURAL RESOURCES
7.92 6.44 7.79 7.42 7.42 7.27 7.43 7.4 7.25 8.08 8.11 7.8 7.31 7.03 6.97 7.06 7.03 6.97
Developed Countries Developing Countries
In 2020, some of the biggest movement can be seen in Pillar 4, Natural Resources, despite the fact this indicator comprises
scores that are either immovable (coastline) or slow to change (population density). In fact, the shifts are caused by the fifth
indicator in this pillar, expert opinion. Underscoring how natural disasters will affect travelers’ view of adventure tourism
destinations, Australia’s score dropped slightly due to a lower rating by experts. The expert survey took place in late 2019
when wildlifes featured heavily in the news, and this likely impacted their opinion.
14 The top scorers benefit from low population density or low urbanization, as well as strong responses from expert opinions.5. Cultural Resources
Adventure travelers value the opportunity to interact with local culture in a meaningful way. Destinations which encourage
local people to preserve their culture—even as modern influences continue to shape and evolve local customs—fare well
with adventure travelers.
The Cultural Resources Pillar is made up of three indicators and an expert opinion question:
1. UNESCO World Heritage Sites
2. UNESCO World Heritage Sites in danger
3. Protected Area as a % of Total Land
Expert Opinion: Your perception of this destination as culturally rich is: (respondents are given a Likert scale of Very bad
(-3) to Very good (+3)).
Rationale: A high number of World Heritage sites and a high number of protected areas indicate a high number of cultural
resources
TOP SCORES FOR CULTURAL RESOURCES
7.7 6.64 8.10 8.72 8.65 6.27 8.44 7.76 6.08 4.3 4.42 7.71 6.6 6.32 6.58 6.48 6.63 6.57
Developed Countries Developing Countries
For many years, Germany, Italy and France have scored in the top three in this pillar—but this year, as smaller countries give
increasingly large portions of their terrestrial and marine territory protected status, the top scores have shifted and Monaco
takes the top rank.
The data used for protected areas is not updated every year. When it is updated (as it was this year), it causes significant
shifts in Pillar 5 scores. Increasing the area under conservation is a priority for many governments, as they seek to protect
endangered species, biodiversity and primary forests. Protected Planet wrote in 2018, “that significant progress has been
made to accelerate protection of biodiversity on land and in the ocean,” with 15% of the earth’s land surface and inland
waters protected, and just above 7% of the global ocean protected.
15© ATTA / Hassen Salum
6. Adventure Activity Resources
In this pillar the ATDI recognizes a destination’s competitiveness relative to its ability to support adventure sports, which
span a range of constantly evolving outdoor, nature-based activities—from bird watching to mountaineering; whitewater
rafting to rock climbing; caving to paragliding. Destinations with resources lending themselves to the development of a par-
ticular sport, for example cliffs excellent for ice climbing or forests with a wealth of bird species, may find themselves with
an opportunity for sustained competitive advantage.
The Adventure Activity Resources Pillar is made up of two indicators:
1. Threatened Species
2. Forests, Grasslands, Drylands
A low number of threatened species and the presence and growth of forests, grasslands and drylands indicate resources
for adventure activities. In the Adventure Activity Resources Pillar ATDI makes an assumption that a country which is sup-
porting endangered species, and also has a large percentage of forests, grasslands and drylands intact is handling its other
adventure assets well and therefore has strong potential for adventure tourism through the preservation of these assets.
TOP SCORES FOR ADVENTURE ACTIVITY RESOURCES
9.76 9.8 9.28 8.75 8.9 8.08 8.75 8.92 8.06 9.16 9.51 8.94 8.31 9.51 8.94 8.32 8.52 8.9
Developed Countries Developing Countries
This is one of the few pillars where developing countries outperform developed nations. While Iceland maintains the top
score, the 15 next best countries are from the developing world. Over time, the countries in the top three have maintained
consistent scores, indicating no sharp increases or decreases in endangered species or forests, grasslands and drylands.
167. Entrepreneurship
The backbone of the adventure industry is small businesses, led by passionate entrepreneurs who continuously innovate
their product. Favorable business climates for entrepreneurship make it easy for small and medium sized tourism business-
es to start up.
The Entrepreneurship Pillar is comprised of one indicator:
1. Index of Economic Freedom
This indicator assesses 10 economic freedoms: Business Freedom, Trade Freedom, Fiscal Freedom, Government Size,
Monetary Freedom, Investment Freedom, Financial Freedom, Property Rights, Freedom from Corruption, and Labor Free-
dom—which combined indicate the level of the barriers to entry for new entrepreneurs.
TOP SCORES FOR ENTREPRENEURSHIP
9.16 9.35 9.46 9.2 9.29 9.19 9.25 9.22 9.08 10 10 10 8.16 8.4 8.73 8.62 8.89 8.62
Developed Countries Developing Countries
The Economic Freedom Index finds that economic freedoms correlate with increased prosperity and healthier populations
that live longer and who are better stewards of the environment. This reinforces the web-like nature of adventure tourism
competitiveness—success factors are inextricably linked together.
For the third year in a row, Singapore scores a perfect score in this pillar, and the top scoring countries remain the same.
In general, they have the same things in common. They score well in the ‘Rule of Law’ category, which measures indicators
such as property rights, government integrity and judicial effectiveness—these elements give investors confidence. With
the exception of Singapore, they score relatively poorly on ‘Government Size’ which looks at indicators for government
spending and tax burden.
178. Humanitarian
The Humanitarian Pillar is concerned with human development in a country and its link to the desire for adventure travel-
ers to enjoy authentic, unscripted experiences. Adventure travelers frequently seek out opportunities to volunteer in the
destinations they visit. Tour operators find themselves looking for non-governmental organization (NGO) and aid organiza-
tion partners through which they can offer their visitors a short-term opportunity to contribute to relevant causes and also
have the chance to see real people in unmanufactured situations. As the trend toward volunteer tourism and its appeal to
adventure travelers continues to build, the ATDI acknowledges that destinations with volunteering opportunities available
to adventure travelers are competitive in the larger market for adventure tourism.
Pillar 8 points to destination resilience in two ways. First, NGOs provide critical assistance to responding to crisis and recon-
stituting in the aftermath. Second, national response to any crisis will have an impact on the wellbeing of people in the des-
tination, which is reflected in the Happy Planet Index as ‘life expectation.’ Countries that provide meaningful economic relief
packages to companies and individuals will likely result in more positive outlook and general life satisfaction. How countries
respond to the current pandemic may influence their Pillar 8 scores in future ATDI reports.
The Humanitarian Pillar is made up of three indicators:
1. Happy Planet Index (HPI)
2. NGO Density
3. NGO Presence
Rationale: The factors measured by the HPI (life expectancy, life expectation and ecological footprint), in combination with
the density of NGOs and NGO presence, suggest involvement of organizations working in humanitarian development and
the level of a country’s human development.
TOP SCORES FOR HUMANITARIAN
4.13 4.21 6.34 6.84 6.87 5.86 5.33 5.31 5.61 4.3 4.42 5.65 3.72 3.72 5.59 7.7 6.64 5.55
Developed Countries Developing Countries
This year, an entirely new set of countries rank in the top three in Pillar 8. Shifts in this pillar were caused by an updated
data set of NGOs, which also affected the second indicator, which is the density of NGOs in each nation. The Happy Planet
Index has not been updated since 2016, so that indicator remains unchanged. Palau scores highest among developing
countries, and has emerged as a leader in sustainable tourism through its innovative ‘Palau Pledge’ and policies to protect
its natural assets, like banning suntan lotion to protect coral reefs.
189. Tourism Infrastructure
Adventure travelers, unlike mainstream tourists, are often less sensitive to deficiencies in hard tourism infrastructure, but
perhaps more sensitive than other travelers when it comes to soft tourism infrastructure. While hard infrastructure may take
substantial capital investment and years to develop, the soft infrastructure required by adventure travelers can often be
developed with comparatively little capital outlay.
Tourism infrastructure includes:
» Hard infrastructure, such as roads, airports, lodging facilities, and trails
» Soft infrastructure, such as trail maps
» Accessible information on heritage and culture
» Ground operators and outfitters
» Training programs for adventure tourism providers such as guides, interpreters, and ecolodges
This pillar uses data from one expert opinion question:
Expert Opinion: Your perception of the availability of appropriate infrastructure for adventure travel in this destination is:
(respondents are given a Likert scale of Very bad (-3) to Very good (+3)).
TOP SCORES FOR INFRASTRUCTURE
7.86 7.7 7.7 7.79 7.63 7.63 7.63 7.49 7.49 7.85 7.59 7.59 7.68 7.52 7.52 7.4 7.23 7.23
Developed Countries Developing Countries
When pillars rely solely on expert opinion, there is little movement in ranking or scores because the ATDI takes a three-year
moving average. Therefore, the top three in each set are the same as in ATDI 2018. The scores reflect experts’ opinions
that the infrastructure is appropriate for adventure tourists. It is an example of how components of adventure tourism com-
petitiveness can be separated—for example, while South Africa is perceived as having good infrastructure for adventure
tourism development by our experts, it scores poorly in regards to safety. Tourists will consider these and additional factors
when making a decision, which is why the interconnected web of factors must be addressed by policy makers, instead of
just one pillar or another.
1910. Image
A country’s image can be one of the most malleable aspects of market competitiveness, but it is also frequently misman-
aged as a way of guiding sustainable market development. An image for sustainability and adventure opportunity will
attract travelers who value these aspects. Through their visitation and expenditures, these visitors will support the country’s
ongoing sustainable development strategies. The ATDI examines a destination’s adventure travel image.
This pillar uses data from one expert opinion question:
Expert Opinion: Your perception of this destination as an adventure tourism destination is: (respondents are given a
Likert scale of Very bad (-3) to Very good (+3)).
TOP SCORES FOR IMAGE
7.98 7.84 7.3 7.73 7.57 7.46 7.63 7.52 7.43 8.05 7.9 7.69 7.93 7.75 7.68 7.86 7.59 7.56
Developed Countries Developing Countries
Canada and Micronesia are new to the top three set, having replaced Iceland and Yemen respectively. A high score in this
pillar indicates that experts have a positive perception of the destination as an adventure destination. The top six countries
have traditionally targeted adventure tourists. The scores also suggest that targeted marketing pays off. New Zealand,
Australia and Canada are known to invest heavily in market research and have a long history of messaging to adventure
tourists through innovative segmentation strategies; for example Canada uses its Explorer Quotient methodology. Countries
also benefit from launching new campaigns. For example, Nepal launched a new brand and tag-line, ‘Lifetime Experiences,’
with a focus on the variety of products in Nepal. They have also recently launched Visit Nepal 2020, with a slew of promo-
tional activities (although the principal ambition is reaching two million international visitors). The developing countries in
the top three have received significant amounts of donor aid to develop adventure tourism, and this is surely known by the
expert community.
© ATTA / Hassen Salum © ATTA / Hassen Salum
20REGIONAL OUTLOOK
The ATDI provides two rankings, one each for developed and developing countries. In this section, the table
below considers rankings from a regional perspective. This may be useful for destinations seeking to understand
how they compare to their closest neighbors.
Table 2 indicates the ranking of the top five countries by region for 2020.
Table 2: Top Five Countries Ranked by Region for 2020
EAST ASIA EASTERN EUROPE SUB-SAHARAN EUROPE & LATIN AMERICA & MIDDLE EAST &
SOUTH ASIA
& PACIFIC & CENTRAL ASIA AFRICA NORTH AMERICA THE CARIBBEAN NORTH AFRICA
1 New Zealand Croatia Bhutan Botswana Iceland Chile Israel
2 Australia Georgia Nepal Seychelles Switzerland Costa Rica Jordan
United
3 Japan Montenegro Maldives Mauritius Germany Dominica
Arab Emirates
4 South Korea Turkey India Rwanda Norway Uruguay Morocco
5 Mongolia Serbia Sri Lanka Cape Verde Finland Barbados Qatar
Key takeaways:
• The number one position in each geographic subregion are destinations that have invested significantly in
the adventure segment of their brand and rank high in Pillar 10, Image.
• Even within these top performers, Pillar 3, Health Scores, can be very low. This might become an increasingly
important consideration for travelers and operators who are marketing in a post-pandemic context. In addi-
tion, these indicators suggest an inability to respond to any future public health crises.
• Georgia and Jordan, both ranked second in their region, have been supported by development agencies
programs focused on adventure tourism development. Development agencies select sectors that improve
social performance, create jobs and lift communities out of poverty.
21ATDI RANKINGS THIS YEAR
Developed Countries
RANK COUNTRY RANK COUNTRY
1 ICELAND 15 FRANCE
2 SWITZERLAND 16 NETHERLANDS
3 NEW ZEALAND 17 JAPAN
4 GERMANY 18 LUXEMBURG
5 NORWAY 19 SPAIN
6 FINLAND 20 MALTA
7 SWEDEN 21 BELGIUM
8 CANADA 22 ITALY
9 DENMARK 23 UNITED STATES
10 AUSTRALIA 24 PORTUGAL
11 AUSTRIA 25 CYPRUS
12 MONACO 26 GREECE
13 UNITED KINGDOM 27 LIECHTENSTEIN
14 IRELAND 28 ANDORRA
Developing Countries
RANK COUNTRY RANK COUNTRY RANK COUNTRY RANK COUNTRY
1 CZECH REPUBLIC 42 BAHAMAS 83 TAJIKISTAN 124 ZIMBAWE
TRINIDAD Y
2 CHILE 43 MICRONESIA 84 125 GAMBIA
TOBAGO
SLOVAK
3 44 PALAU 85 VANUATU 126 BURUNDI
REPUBLIC
RUSSIAN
4 SLOVENIA 45 86 ALGERIA 127 LESOTHO
FEDERATION
5 ISRAEL 46 BELIZE 87 EGYPT 128 TONGA
6 ESTONIA 47 PHILIPPINES 88 JAMAICA 129 BURKINA FASO
7 POLAND 48 MAURITIUS 89 ECUADOR 130 CAMEROON
8 BULGARIA 49 BAHRAIN 90 GHANA 131 MYANMAR
9 ROMANIA 50 MEXICO 91 IRAN 132 BENIN
BOSNIA &
10 COSTA RICA 51 UKRAINE 92 133 MALI
HERZEGOVINA
ST. VINCENT
MARSHALL
11 CROATIA 52 & THE GRENA- 93 134 HONDURAS
ISLANDS
DINES
22 12 KOREA REP 53 KAZAKHSTAN 94 GUYANA 135 TIMOR-LESTERANK COUNTRY RANK COUNTRY RANK COUNTRY RANK COUNTRY
13 DOMINICA 54 BRAZIL 95 NICARAGUA 136 YEMEN
14 BHUTAN 55 RWANDA 96 INDIA 137 GUINEA
EQUATORIAL
15 HUNGARY 56 OMAN 97 SRI LANKA 138
GUINEA
16 LATVIA 57 MACEDONA FYR 98 MALAYSIA 139 MADAGASCAR
17 URUGUAY 58 BELARUS 99 KIRIBATI 140 MAURITANIA
BRUNEI
18 GEORGIA 59 100 LEBANON 141 GUINEA-BISSAU
DARASSALAM
19 MONTENEGRO 60 CAPE VERDE 101 INDONESIA 142 SUDAN
20 JORDAN 61 SAUDI ARABIA 102 GABON 143 MOZAMBIQUE
DOMINICAN
21 BARBADOS 62 103 KENYA 144 AFGHANISTAN
REPUBLIC
UNITED ARAB
22 63 COLOMBIA 104 SURINAME 145 NIGER
EMIRATES
ANTIGUA &
23 TURKEY 64 ST. LUCIA 105 146 TOGO
BARBUDA
WEST BANK &
24 LITHUANIA 65 CHINA 106 GRENADA 147
GAZA
25 BOTSWANA 66 NAMIBIA 107 TANZANIA 148 LIBERIA
26 SERBIA 67 NEPAL 108 CAMBODIA 149 SIERRA LEONE
SOLOMO
27 ALBANIA 68 ZAMBIA 109 150 ERITREA
ISLANDS
28 MOROCCO 69 TUNISIA 110 BOLIVIA 151 KOREA
29 PERU 70 SAMOA 111 PAKISTAN 152 LYBIA
SAO TOME & SYRIAN ARAB
30 SEYCHELLES 71 LAO PDR 112 153
PRINCIPE REPUBLIC
31 PANAMA 72 VIETNAM 113 ETHIOPIA 154 HAITI
32 MONGOLIA 73 MOLDOVA 114 MALAWI 155 ANGOLA
33 QATAR 74 SENEGAL 115 VENEZUELA 156 CONGO
PAPAU NEW CENTRAL AFRI-
34 SINGAPORE 75 EL SALVADOR 116 157
GUINEA CAN REPUBLIC
35 THAILAND 76 SOUTH AFRICA 117 SWAZILAND 158 NIGERIA
36 ARMENIA 77 SAN MARINO 118 PARAGUAY 159 DJIBOUTI
37 FIJI 78 UZBEKISTAN 119 UGANDA 160 CHAD
38 ARGENTINA 79 GUATEMALA 120 COTE D’IVOIRE 161 REP CONGO
KYRGYZ ST. KITTS &
39 80 121 COMOROS 162 IRAQ
REPUBLIC NEVIS
40 AZERBAIJAN 81 CUBA 122 BANGLADESH 163 SOMALIA
41 KUWAIT 82 MALDIVES 123 TURKMENISTAN 23Adventure Tourism Development Index & Global Sustainable
Tourism Criteria for Destinations: Complementary Tools
The ATDI and the GSTC-D are complementary tools that when used together can provide a country with a holistic
snapshot of adventure tourism competitiveness and health of its tourism destinations. The ATDI provides policy
makers with high level direction that can be useful in aligning national tourism priorities and investments, while
the GSTC-D offers leaders at the local level guidance needed to define definitive, destination-specific strategies.
Together, these tools can help destination managers, travel companies and other destination stakeholders more
effectively support sustainable tourism development and management.
Whereas the ATDI distills complex issues (such as sustainable development policy or nature and culture resourc-
es) as they relate to a country’s adventure tourism competitiveness into a single score, the GSTC provides a look
at destination sustainability at a granular level, offering destination managers a detailed examination of local mar-
ket sustainability health, using a set of 100 sustainability indicators. We invite you to review the companion piece,
GSTC Global Destination Sustainability Report, to read more about the good practices and shared challenges
associated with sustainable destination management worldwide.
Over the years the ATDI has served as a reference for governments from a diverse set of countries from Latin
America to Asia and Scandinavia to help inform national tourism strategies; similarly the GSTC-D is also in use in
many countries around the world, such as Indonesia, Republic of Korea, and Colombia—which have all adopted
the GSTC-D criteria as a national standard—no country has yet to integrate both tools in charting a sustainable
development course.
ATDI
National Adventure Tourism
Competitiviness Ranking
Figure 1: ATDI & GSTC-D as
Complementary Destination Tools GSTC-D
Local Destination
Sustainability
Snapshot
24The table below provides a side-by-side comparison of the ATDI and GSTC.
Table 3: Comparison of ATDI & GSTC-D
ATDI GSTC-D
Assess destination competitiveness
GOALS for adventure tourism
Assess destination sustainability
Sub-national
*can be applied at the national-level,
LEVEL OF ANALYSIS Country-level
but it is uncommon
Self- or Independent destination
assessment
Scorecard
ASSESSMENT Country-level ranking Report card that uses a traffic light
system to flag destination risks and
good practices
Uses output indicators of measure-
ment (quantitative) Uses input, or process, indicators of
measurement (qualitative)
Consists of 10 categories that are
INDICATORS measured by 20 indicators and ex- Includes nearly 40 criteria that are
pert opinion on 5 topics that range measured by over 100 indicators.
from safety and security to infra-
structure.
Uses third-party databases and Uses local level data and local ex-
DATA expert opinion pert insights
1. Policies that support sustainable 1. Destination policy and planning
development 2. Community involvement and
2. Safety and security benefits
3. Health 3. Management of natural and cul-
4. Natural resources tural assets
ASSESSMENT
5. Cultural resources 4. Environmental issues
CATEGORIES 6. Adventure activity resources
7. Entrepreneurship
8. Humanitarian
9. Tourism infrastructure
10. Brand
25Continuous Improvement of the ATDI
The side-by-side analysis of the GSTC-D and ATDI highlights the complementary nature of these
two tools. The ATDI provides a country-level ranking on competitiveness for adventure tourism,
and GSTC-D reveals a local level snapshot of destination sustainability. Both competitiveness and
sustainability are interrelated and critical for overall destination success.
This comparison is helping to inform the ATTA and GW’s thinking about specific ways to improve
the ATDI so that it can provide deeper insights about the long-term health or sustainability of ad-
venture travel at a national level. The need for sustainable and effective destination management
and leadership is more urgent today than ever before as the Covid-19 global pandemic rages and
we face existential threats associated with climate change. The hope is that destination managers,
adventure travel companies and other stakeholders will work together to bring back tourism from
the unprecedented shock and transformation brought on by the global pandemic. This unique
moment in history provides us with an opportunity to not only rebuild the destination and maintain
its competitiveness but to address the larger issues that will enable it to grow sustainably and
thrive over time.
26CONCLUSION
This report helps destinations understand their adventure tourism competitiveness, as well as
track their competitiveness over time. Understanding the factors that lead to competitiveness,
as well as specific strengths and weaknesses, can help policy makers develop better plans and
strategies, align and collaborate more closely with important partners in both the public and pri-
vate sector.
In this edition of the ATDI, there are reasons to be optimistic about the future of adventure tourism.
Countries are increasing their share of protected marine and terrestrial areas, efforts to mitigate
climate change are working, and many countries have increased economic freedoms and ex-
panded support to entrepreneurs. At the same time, corruption around the world is increasing, the
extinction rate is increasing, and big cities, especially in the developing world are becoming more
densely populated—all indicators that reduce competitiveness.
As competitiveness indicators move up and down, and they do so slowly, unpredictable shocks
can bring entire tourism economies to a standstill. The current public health crisis is an example
of such a shock, that very few, if any, tourism managers prepared for.
The pandemic has been called ‘the great equalizer,’ and in tourism perhaps there is some truth
to that. In the aftermath of the Covid-19 pandemic, every destination in the world will be in the
same position: working to restart tourism in a way that is safe, conscious of the new reality and
new concerns of travellers but also delivers jobs to their communities. The need for sustainable
leadership—focusing on resiliency, resourcefulness and efficiency—is more urgent today than
ever before. Designing new sustainability initiatives, economic relief plans and marketing cam-
paigns will be an opportunity to increase competitiveness as well as long-term resilience. Both
competitiveness and sustainability are interrelated and critical for overall destination success. The
GSTC-D Criteria and Indicators, which is a complementary tool to the ATDI, can assist destination
managers to create real change from the ground up and put destinations on a more sustainable
path. Competing in a post-pandemic world will require innovation, flexibility, and determination—
luckily, these are precisely the things that characterize our adventure tourism industry.
© ATTA / Rupert Shanks
27© ATTA / Josiah Holwick 28
You can also read