Aerospace in Washington - Economic Impacts and Workforce Analysis March 2019 Prepared by: Aerospace Works ...
←
→
Page content transcription
If your browser does not render page correctly, please read the page content below
Aerospace in Washington
Economic Impacts and Workforce Analysis

March 2019

                               Prepared by:

                              Prepared for: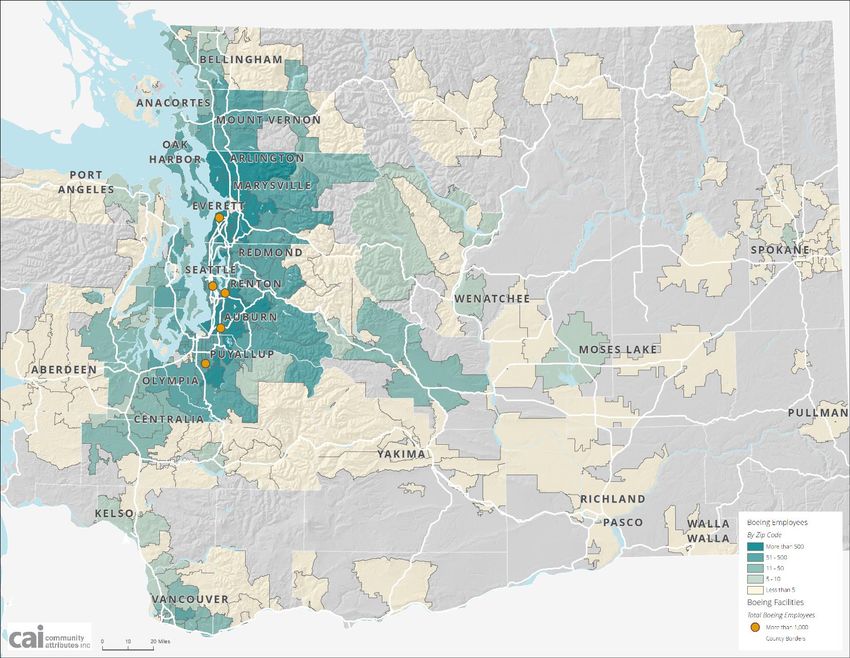
Community Attributes Inc. tells data-rich stories about communities
            that are important to decision makers.

                                                         President and CEO:
                                                               Chris Mefford

                                                                   Analysts:
                                                             Madalina Calen
                                                         Spencer Cohen, PhD
                                                               Diana Haring
                                                            Michaela Jellicoe

                                                  Community Attributes Inc.
                                                 500 Union Street, Suite 200
                                                  Seattle, Washington 98101

                                              www.communityattributes.com
EXECUTIVE SUMMARY
Aerospace Economic Impacts
The aerospace industry in Washington, anchored by The Boeing Company,
continues to be a major pillar of the statewide economy, and a leading source
of employment and wealth creation across the state. Key findings from this
study are as follows:
• In 2018, the aerospace industry generated an estimated $71 billion in
gross revenues in Washington state. Revenues appear to have
increased since 2017, thereby sustaining a trend of much higher
revenues relative to prior years. From 2002 to 2011, statewide
revenues averaged $40 billion. From 2012 through 2018, revenues
averaged $68 billion (all inflation adjusted, 2018 dollars).
• In 2018, Washington state’s aerospace workforce is estimated to have
reached 83,400 workers, about the same or down slightly from the
average annual employment in 2017, industry wide. These workers
were employed across 199 establishments. Jobs at Boeing increased in
2018, adding 4,000 jobs, which may portend industry wide gains
continuing into 2019. Since 2002, when the number of aerospace
workers were at 75,700, there have been numerous ups and downs in
the aerospace industry globally, which were reflected over the years in
the ups and downs of the aerospace workforce in Washington.
• Total estimated aerospace labor compensation in 2018 totaled $12.4
billion, very slightly down from 2017. In 2018, the average annual
wage paid per worker was $116,770 (compared to roughly, and an
estimated $63,000 across all industries and all workers in Washington
in 2018).
• The total economic impact of the aerospace industry in Washington
state in 2018 included 223,700 jobs, $20.5 billion in labor income, and
$94.4 billion in business revenues. Between 2012 and 2018, the total
economic impact of aerospace has increased from $80.6 billion, in 2018
dollars, to $94.4 billion. Total labor compensation impacts decreased
from $21.1 billion (2018 $) to $20.5 billion. Total jobs have decreased,
reflecting productivity gains in the industry in Washington.
Aerospace Workforce Supply and Demand
Across the Washington state aerospace industry, more than 62,300
employees work in 56 core aerospace industry occupations. These core
occupations represent only a portion of total employment within the
aerospace industry. Overall employment within the aerospace industry
includes employment in other occupations that are commonly found in other
industries, as well. Core aerospace industry occupation employment is
projected to grow at a compound annual growth rate of 0.8% between 2021
and 2026. In total, annual openings in core aerospace industry occupations
AEROSPACE WORKS FOR WA PAGE i
ECONOMIC IMPACT STUDY MARCH 2019are projected to total more than 6,000 per year between 2021 and 2026.
Annual openings include new jobs created due to growth as well as job
openings created by existing employees exiting employment to retire, move or
change occupations.
Annual openings are those openings that are projected to be filled annually
and do not account for job openings that go unfilled. In 2018, across
Washington, there were an average of more than 150,500 job postings per
month, according to Help Wanted Online data from The Conference Board.
Key aerospace occupation groups had thousands of job postings monthly.
Engineering occupations averaged nearly 3,900 job postings per month.
Production occupations, including supervisors, assemblers and fabricators,
and metal and plastic workers had an average of nearly 2,000 job postings
per month.
The Aerospace Workforce Supply and Demand Dashboard presented below
shows occupations in the aerospace industry grouped by minimum education
level required for entry and ranked by average annual openings within the
industry from 2021 to 2026. In some cases, the actual education required by
Washington state employers may be different from the minimum education
level categories defined by the Bureau of Labor Statistics.
Overall findings include the following:
• Between 2021 and 2026 Washington is forecasted to have a net
shortage of 2,651 among core aerospace occupations annually.
• Among 56 core aerospace occupations, 39 are projected to experience an
undersupply of qualified workers from Washington annually.
• Core aerospace occupations span a wide diversity of skills ranging from
aerospace engineers to machinists to software developers and computer
numerically controlled machine tool programmers.
• Aircraft structure, surfaces, rigging and systems assemblers in the
aerospace industry are forecasted to have an annual shortage of 800
workers, the largest projected talent gap in the industry. Qualified
candidates from Washington are projected to fill just 22% of annual
openings.
• Several occupations are forecasted to experience large surpluses in
local workforce supply: industrial engineering technicians;
architectural and engineering managers; industrial production
managers; and electro-mechanical technicians are each projected to
experience surpluses greater than 100 qualified candidates annually.
AEROSPACE WORKS FOR WA PAGE ii
ECONOMIC IMPACT STUDY MARCH 2019Washington Aerospace Workforce Supply and Demand Dashboard
On-the-Job Training
Annual Average Demand and Supply Occupation Employment CAGR Annual Demand and Supply, 2021-2026
All Occupations by Education Ranked by Annual Openings (2021-2026) 2016 2026 2016-2026 Scale: 0 - 1,237 annual openings in sector Gap
1 Aircraft Structure, Surfaces, Rigging, 12,166 10,664 -1.3% Demand
1,031
Demand 1,031
3,000 (800)
2,772 and Systems Assemblers Supply
231
Supply 231
2 Inspectors, Testers, Sorters, Samplers, 12,042 12,020 0.0% Demand
Demand
507 507
(407)
2,500 and Weighers Supply
Supply
100 100
Demand 2,772 3 Production, Planning, and 10,449 11,325 0.8% Demand
Demand
255 255
(228)
Supply 796 Expediting Clerks Supply
Supply
27 27
2,000 Demand
UI Claims 381 4 Machinists 10,700 11,090 0.4% Demand
225 225
(185)
Graduates 415 Supply
Supply
40 40
1,500 1 5 Tool and Die Makers 2,064 1,872 -1.0% Demand
130
Demand 130
(69)
1 Supply
61
Supply 61
381 UI Claims 6 Painters, Transportation Equipment 2,571 2,911 1.2% Demand
Demand
102 102
1,000 796 (83)
415 Graduates Supply
Supply
19 19
7 Computer-Controlled Machine Tool 1,753 1,629 -0.7% Demand
Demand
94 94
415 (4)
500 Graduates Operators, Metal and Plastic Supply
90
Supply 90
8 Industrial Machinery Mechanics 7,053 7,514 0.6% Demand
Demand
92 92
381 UI (82)
Supply
Supply
10 10
Claims
0 9 Fiberglass Laminators and 1,338 1,305 -0.2% Demand
Demand
54 54
Demand Supply (42)
Fabricators Supply
Supply
12 12
Associate Degree or Postsecondary Award
Annual Average Demand and Supply Occupation Employment CAGR Annual Demand and Supply, 2021-2026
All Occupations by Education Ranked by Annual Openings (2016-2026) 2016 2026 2016-2026 Scale: 0 - 756 annual openings in sector Gap
1 Aircraft Mechanics and Service 5,561 5,343 -0.4% Demand
257
Demand 257
1,400 1,224 (56)
Technicians Supply
201
Supply 201
1,200
919
2 First-Line Supervisors of Production 15,198 16,012 0.5% Demand
190
Demand 190
1,000 (164)
and Operating Workers Supply
26
Supply 26
800 1,003
Demand 919
Graduates
3 Avionics Technicians 2,466 2,398 -0.3% Demand
144
Demand 144
600 (108)
Supply 1,224 Supply
36
Supply 36
400
UI Claims 221 4 Industrial Engineering Technicians 2,185 2,016 -0.8% Demand
118
Demand 118
221 UI 1,003 512
Graduates
200 Supply
630
Supply 630
Claims
0 1 5 Mechanical Drafters 2,231 2,215 -0.1% Demand
91
Demand 91
Demand Supply 4
1 Supply
95
Supply 95
Bachelor's Degree
Annual Average Demand and Supply Occupation Employment CAGR Annual Demand and Supply, 2021-2026
All Occupations by Education Ranked by Annual Openings (2018-2023) 2016 2026 2016-2026 Scale: 0 - 479 annual openings in sector Gap
1 Logisticians 6,498 6,587 0.1% Demand
399
Demand 399
2,500 (355)
Supply
44
Supply 44
2,307 2 Industrial Engineers 7,719 8,461 0.9% Demand
330
Demand 330
(304)
Supply
26
Supply 26
Demand 2,307 3 Aerospace Engineers 6,816 6,194 -1.0% Demand
274
Demand 274
45
Supply 1,323 Supply
319
Supply 319
UI2,000
Claims 444 4 Purchasing Agents, Except 9,306 9,603 0.3% Demand
245
Demand 245
(227)
Graduates 879 Wholesale, Retail, and Farm Prod Supply
18
Supply 18
1 5 Software Developers, Systems 15,674 20,972 3.0% Demand
176
Demand 176
(128)
1 Software Supply
48
Supply 48
444 UI Claims 6 Electrical Engineers 6,426 6,976 0.8% Demand
122
Demand 122
(88)
879 Graduates Supply
34
Supply 34
1,500
7 Mechanical Engineers 7,928 8,688 0.9% Demand
102
Demand 102
1,323 (64)
Supply
38
Supply 38
8 Operations Research Analysts 3,415 4,194 2.1% Demand
90
Demand 90
(81)
Supply
9
Supply 9
9 Architectural and Engineering 4,729 4,983 0.5% Demand
87
Demand 87
276
1,000 Managers Supply
363
Supply 363
10 Financial Analysts 6,987 8,502 2.0% Demand
81
Demand 81
(69)
Supply
12
Supply 12
11 Computer Network Architects 6,627 8,052 2.0% 74
Demand
Demand 74
(12)
879 62
Supply
Supply 62
500
Graduates 12 Financial Specialists, All Other 3,423 3,918 1.4% 60
Demand
Demand 60
(46)
14
Supply
Supply 14
13 Materials Engineers 1,056 993 -0.6% 56
Demand
Demand 56
(44)
444 UI 12
Supply
Supply 12
Claims 14 Industrial Production Managers 2,741 2,841 0.4% 52
Demand
Demand 52
155
207
Supply
Supply 207
0 15 Engineers, All Other 3,440 3,647 0.6% 50
Demand
Demand 50
Demand Supply (17)
33
Supply
Supply 33
AEROSPACE WORKS FOR WA PAGE iii
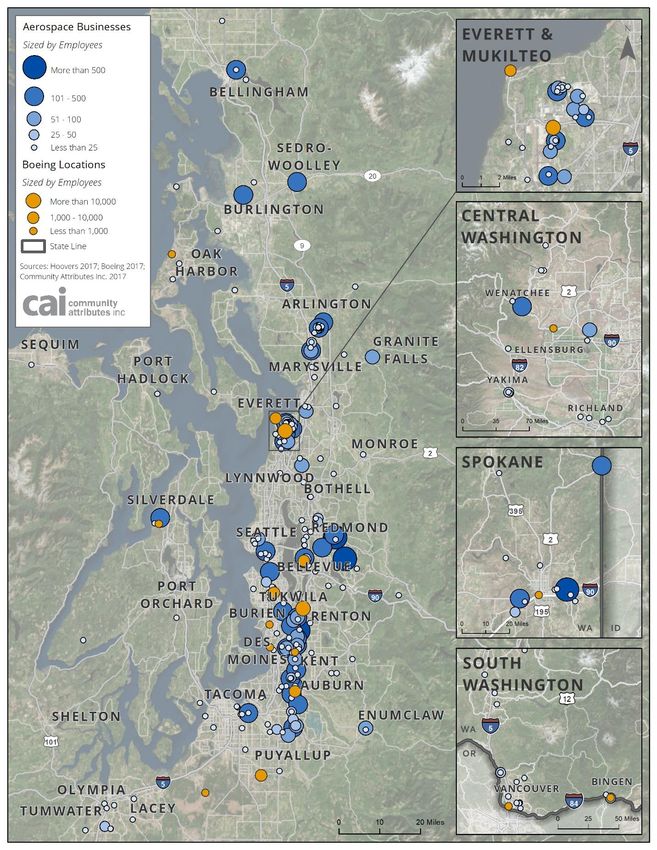
ECONOMIC IMPACT STUDY MARCH 2019Local and Regional Impacts
The large numbers of statewide impacts sometimes overshadow an
understanding of how local communities benefit from aerospace and its
employees that live and shop in their communities. Aerospace workers live
relatively near their workplaces. Worker residences are concentrated in
Western Washington counties, up and down nearly the entirety of the I-5
corridor, including many workers living on the eastern side of I-5 counties.
Everett, Marysville, Arlington and surrounding rural areas rank highest in
worker residents, working out of facilities north of Seattle. Renton area and
Kent industrial valley workers are more dispersed throughout urban areas in
Western Washington.
Spending patterns of Aerospace workers in their places of residence provide
an understanding of local impacts from Aerospace.
Everett-Lynnwood
In the Everett and Lynnwood area, Aerospace workers and spending support
a tremendous amount of business activity. These workers support the
equivalent of three car dealerships, or a total of 1,800 cars each year
purchased by aerospace workers. Typical dining out patterns, assuming most
of their spending is local to them, support $76 million in sales at restaurants
and drinking places, which equates to nearly 1,300 restaurant workers and
89 individual restaurants. Additional retail spending by aerospace workers
supports nearly 900,000 square feet of retail space, nearly $300 million in
retail sales.
North Everett to Arlington
Northward from Everett into Arlington, aerospace workers support the
equivalent of one to two car dealerships, or a total of 600 cars each year
purchased by aerospace workers. Dining patterns support an estimated $24
million in sales at restaurants and drinking places, which equates to more
than 400 restaurant workers and roughly 28 individual restaurants.
Additional retail spending by Aerospace workers supports nearly 270,000
square feet of retail space and nearly $87 million in retail sales. The
equivalent of 27 doctors and dentist offices are supported as well, summing
to 600 jobs.
Auburn-Renton
From Auburn to Renton, aerospace workers support the equivalent of two car
dealerships, or a total of 800 cars per year purchased by aerospace workers.
Typical dining out patterns, assuming half of their spending is local to them,
supports $37 million in sales at restaurants and drinking places, which
AEROSPACE WORKS FOR WA PAGE iv
ECONOMIC IMPACT STUDY MARCH 2019equates to more than 600 restaurant workers and roughly 43 individual
restaurants. Additional retail spending by Aerospace workers supports more
than 400,000 square feet of retail space, $130 million in retail sales. The
equivalent of 51 doctors and dentist offices are supported by aerospace
workers, totaling nearly 900 jobs.
Pierce and South King County.
In Pierce County communities, and the southern portion of King County,
aerospace workers support the equivalent of one to three car dealerships, or a
total of 1,200 cars per year purchased by Aerospace workers. Typical dining
out patterns, assuming half of their spending is local to them, supports $54
million in sales at restaurants and drinking places, which equates to more
than 900 restaurant workers and roughly 63 individual restaurants. Retail
spending by aerospace workers supports nearly 600,000 square feet of retail
space, nearly $200 million in retail sales. In terms of healthcare, aerospace
workers support the equivalent of 55 doctors and dentist offices, or a total of
1,300 jobs.
AEROSPACE WORKS FOR WA PAGE v
ECONOMIC IMPACT STUDY MARCH 2019blank AEROSPACE WORKS FOR WA PAGE vi ECONOMIC IMPACT STUDY MARCH 2019
CONTENTS
Introduction .................................................................................................................... 1
Direct Aerospace Activities in Washington State ............................................................ 3
Economic and Fiscal Impacts .......................................................................................... 7
Aerospace Workforce Supply and Demand ...................................................................... 9
Local and Regional Impacts........................................................................................... 23
Summary and Conclusions ............................................................................................ 31
Appendix A. Workforce Supply and Demand Detailed Methodology and Analysis ........ 33

AEROSPACE WORKS FOR WA                                                                                                PAGE vii
ECONOMIC IMPACT STUDY                                   MARCH 2019
blank

AEROSPACE WORKS FOR WA                PAGE viii
ECONOMIC IMPACT STUDY    MARCH 2019
INTRODUCTION

     Background and Purpose
        The aerospace industry is a major driver of economic activity in Washington
        state. Anchored by The Boeing Company and supported by an extensive
        supply chain, the aerospace industry is a key source of innovation, economic
        growth and wealth. Aerospace Works for Washington (AWW) is a non-profit
        coalition of elected, business and community leaders dedicated to ensuring
        Washington state remains a leader in aerospace. To advance this mission,
        AWW commissioned analysis and metrics updating previous aerospace
        industry assessments in 2013, 2015 and 2016 to provide strategic decision-
        making support for aerospace activities statewide.

        This study provides a data-rich assessment of the aerospace industry’s
        impact on the state economy, as well as an assessment of aerospace workers
        impacts on the communities where the live. Analysis includes both the direct
        activities of the aerospace industry and the secondary impacts of the industry
        through upstream business-to-business transactions and worker
        expenditures on good and services throughout the economy. Additionally, this
        study examines in detail workforce supply and demand in the aerospace
        industry in Washington.

     Methods and Data
        This report uses data published by state and federal agencies, as well as
        company-wide employment and revenue data made available by The Boeing
        Company. Employment, wage and establishment count data for aerospace
        and related industries were procured from the Washington State
        Employment Security Department, while the Washington State Department
        of Revenue was the source for gross business income for aerospace. Implicit
        price deflators were sources from the St. Louis Federal Reserve Bank.
        Figures for 2018 were based the latest available data (though October) and
        modeled estimates for revenues and wages and employment data through
        2018 from The Boeing Company.

        The Washington State Input-Output Model was used to evaluate the
        statewide economic impacts of the aerospace industry, including indirect and
        induced impacts.

        Workforce supply and demand analysis draws from data published by the
        Washington State Employment Security Department, the Bureau of Labor
        Statistics (BLS) and the National Center for Education Statistics (NCES).
        Specifically, the following data sources form the foundation of the modeling:

AEROSPACE WORKS FOR WA                                                         PAGE 1
ECONOMIC IMPACT STUDY              MARCH 2019
• Occupational estimates and forecasts from the Washington
State Employment Security Department (ESD) and the
Bureau of Labor Statistics. This data provides current estimates
and forecasted demand for occupations in Washington and
associated educational requirements, as well as occupational wages.
Occupational forecasts include openings created by retirements and
separations. For this reason, average annual openings are larger
than the average of net jobs created over a period of time.
• Washington unemployment insurance claims. This data, also
published by ESD, provides monthly unemployment claims and the
previous occupations of the claimant by occupation code.
• Educational attainment data from the National Center for
Education Statistics’ Integrated Postsecondary Education
System (IPEDS). IPEDS provides the number of graduates by
educational program, defined according to the Classification of
Instructional Programs, for Washington’s higher education
institutions as well as a table of equivalence used to translate
educational programs and occupations.
In general, this data provides measures of demand and supply by occupation
across industries. The occupations are defined in accordance with the Bureau
of Labor Statistics Standard Occupational Classification system and
industries are delineated using definitions from the North American Industry
Classification System.
Organization of Report
• Direct Aerospace Activities in Washington State. Describes the
employment, occupations and establishments that compose Washington’s
aerospace industry, as well as the wages and business revenues
generated by the industry.
• Economic and Fiscal Impacts. Analyzes the total economic and fiscal
impacts supported by aerospace in Washington.
• Aerospace Workforce Supply and Demand. Analyzes the
occupational demand and supply in Washington’s aerospace industry and
examines how local supply is expected to meet occupational demand in
Washington.
• Local and Regional Impacts. Provides an assessment, leveraging data
and modeling tools, of the varied impacts of aerospace to cities and
communities across the state.
• Summary and Conclusions. Summarizes the key findings on the direct,
economic and fiscal impacts of aerospace in Washington and the
workforce pipeline for the industry’s workforce.
AEROSPACE WORKS FOR WA PAGE 2
ECONOMIC IMPACT STUDY MARCH 2019DIRECT AEROSPACE ACTIVITIES IN WASHINGTON STATE
Employment and Establishments
In 2018, the aerospace industry directly employed an estimated 83,400
workers in Washington state, based on a monthly average for 2018. This
represents a slight decline of 700 jobs from 2017 and is below a recent peak
of 96,100 jobs in 2013 (Exhibit 1). The Boeing Company employed 69,800
workers in Washington state as January 1, 2019, the first increase in six
years (Exhibit 2).1
Since 2003, Boeing’s Washington state employment has increased 14%
relative to its total global employment. In 2018, Boeing’s workforce in
Washington state was roughly 47% of their global companywide employment,
up from 33% in 2003. News reports indicate the 2017 layoffs at Boeing, the
majority of which were voluntary, have concluded. According to The Boeing
Company, 4,000 jobs were added at its Washington state operations in 2018.
Exhibit 1. Aerospace Employment in Washington State, 1990-2018
Sources: Washington State Employment Security Department, 2019; Community Attributes
Inc., 2019.
1Employment for The Boeing Company in Washington state and statewide
aerospace employment are not perfectly comparable, since the former represents
employment as January 1, 2019, whereas Washington statewide employment
represents a 12-month average from January to December of 2018. In December
2018, there were a reported 85,400 workers employed in the aerospace industry in
Washington statewide, a 3,800 increase over January 2018.
AEROSPACE WORKS FOR WA PAGE 3
ECONOMIC IMPACT STUDY MARCH 2019Exhibit 2. Boeing Employment in Washington State, 2003-2018
Sources: The Boeing Company, 2019; Community Attributes Inc., 2019.
Aerospace establishments represent places of employment for companies
defined in federal employment data as “aerospace.” In some cases, a single
company may have more than one establishment in Washington state, such
as multiple production lines or offices. Despite the ups and downs of
aerospace employment in recent years, the establishment count has
increased each year since 2012 except for in 2016, dropping from 185 to 183.
In 2018, based on the first two quarters of available data, aerospace
establishments in Washington state averaged 199 (Exhibit 3).
Exhibit 3. Aerospace Establishments
Sources: U.S. Bureau of Labor Statistics, 2019; Community Attributes Inc., 2019.
AEROSPACE WORKS FOR WA PAGE 4
ECONOMIC IMPACT STUDY MARCH 2019Wages
The aerospace industry generated a total of $12.4 billion in annual wages
(Exhibit 4), including benefits such as employer-provided health insurance.
Adjusted for inflation, total annual compensation, in aggregate across all
aerospace workers, declined slightly from a peak of $14.5 billion in 2014. At
the state level, aerospace workers averaged an annual wage (excluding
benefits) of $116,770 (Exhibit 5) in 2018. The statewide average annual
wage for aerospace workers in 2017 was $117,700. For comparison, the
overall statewide average annual wage was $62,100. The statewide aerospace
industry average wage also declined from $121,500 in 2014, which may in
part reflect an increase in retirements and greater share of the workforce
earlier in their careers since 2014 due to an aging workforce.
Exhibit 4. Aerospace Total Labor Compensation, Including Benefits, in
Washington State, 2003-2018 (2018 $)
*Estimate for 2018 based on available data.
Sources: U.S. Bureau of Labor Statistics, 2019; Community Attributes Inc., 2019.
AEROSPACE WORKS FOR WA PAGE 5
ECONOMIC IMPACT STUDY MARCH 2019Exhibit 5. Aerospace Average Annual Wage in Washington State,
2003-2018 (2018 $)
*Estimate for 2018 based on available data.
Sources: U.S. Bureau of Labor Statistics, 2019; Community Attributes Inc., 2019.
Business Revenues
Revenues from the aerospace industry in 2018 remained high by historic
standards—gross business income in 2018 was more than double that of 2004
($31.5 billion, in 2018 dollars). In 2018, the aerospace industry directly
generated $70.6 billion in gross business income (Exhibit 6).
Exhibit 6. Aerospace Business Revenues in Washington State,
2003-2018 (2018 $)
*Estimate for 2018 based on available data.
Sources: Washington State Department of Revenue, 2019; Community Attributes Inc., 2019.
AEROSPACE WORKS FOR WA PAGE 6
ECONOMIC IMPACT STUDY MARCH 2019ECONOMIC AND FISCAL IMPACTS
Due to its large employment footprint and high wages, aerospace has a
significant widespread economic impact across the state. Total economic
impacts represent both the direct footprint of the aerospace industry as well
as additional jobs, labor income and business revenues supported through
upstream business-to-business transactions (indirect impacts) and worker
household income expenditures (induced impacts). In this report, economic
impacts were computed using the Washington State Input-Output (I-O)
Model published by the Washington State Office of Financial Management.
In 2018, the aerospace industry directly employed 83,400 workers, paid $12.4
billion in labor income (including benefits) and generated an estimated $70.6
billion in business revenues. These activities, in turn, supported a total of
223,700 jobs across the state economy, $20.5 billion in labor income, and
$94.4 billion in business revenues through multiplier effects (Exhibit 7).
Exhibit 7. Economic Impacts of Aerospace in Washington, 2018
Direct Indirect Induced Total
Jobs 83,400 25,900 114,400 223,700
Total Compensation (mils 2018 $) $12,381.3 $1,948.9 $6,133.6 $20,463.8
Business Revenue (mils 2018 $) $70,589.4 $5,674.0 $18,100.5 $94,363.9
Sources: Office of Financial Management, 2019; Washington State Employment Security
Department, 2019; Community Attributes Inc., 2019.
These impacts can be translated into economic multipliers. For example, each
dollar of direct revenue in aerospace supports $1.30 in total economic activity
across the state economy. Likewise, every job in aerospace is associated with
a total of 2.7 jobs across the state (Exhibit 8).
Exhibit 8. Economic Multipliers, 2018
Type Multiplier
Total output per $ final demand 1.3
Total jobs per direct job 2.7
Total compensation per $ direct income 1.7
Total jobs per $ mil final demand 3.2
Source: Office of Financial Management, 2019; Community Attributes Inc., 2019.
Between 2012 and 2018, the total economic impact of aerospace has
increased from $80.6 billion, in 2018 dollars, to $94.4 billion. Total labor
compensation impacts decreased from $21.1 billion (2018 $) to $20.5 billion.
The average annual wage among all jobs supported by aerospace has
increased from $83,100 in 2012 to $91,500 (2018 $). Between 2012 and 2018
the average annual compensation among direct aerospace jobs has increased
from $133,700 to $148,500, including benefits. (Exhibits 9 and 10)
AEROSPACE WORKS FOR WA PAGE 7
ECONOMIC IMPACT STUDY MARCH 2019Exhibit 9. Direct Aerospace Industry Economic Impacts, Washington,
2012 to 2018
2012 2014 2015 2016 2018
Jobs 94,200 93,400 93,800 90,800 83,400
Total Compensation (mils 2018 $) $12,598 $13,838 $12,998 $12,517 $12,381
Business Rev enue (mils 2018 $) $54,509 $60,020 $69,835 $67,845 $70,589
Note: past direct revenue and employment estimates presented above do not exactly match
historic data presented in earlier sections of this report due to subsequent state agency data
revisions.
Sources: Washington Aerospace Partnership, 2013, 2015 and 2016; Community Attributes Inc,
2018, 2019.
Exhibit 10. Total Aerospace Industry Economic Impacts, Washington,
2012 to 2018
2012 2014 2015 2016 2018
Jobs 253,400 267,200 252,800 242,800 223,700
Total Compensation (mils 2018 $) $21,054 $23,080 $21,661 $21,192 $20,464
Business Rev enue (mils 2018 $) $80,611 $88,161 $96,301 $93,955 $94,364
Sources: Washington Aerospace Partnership, 2013, 2015 and 2016; Community Attributes Inc,
2018, 2019.
As a major employer and operator in the state, the aerospace industry and
Boeing make sizable direct and secondary impacts to the state in the form of
taxes. In 2018, the aerospace industry made estimated direct tax payments—
including B&O, sales & use and other tax categories—of $192.3 million. The
total fiscal impact of the aerospace industry, including taxes paid by
businesses associated with aerospace through indirect and induced impacts,
summed to an estimated $567.1 million in 2018 (Exhibit 11).
Exhibit 11. Estimated Direct and Total Fiscal Impacts of Aerospace,
Washington State, 2018
Direct Secondary Total
B&O $152.1 $103.3 $255.5
Sales & Use Taxes $40.1 $241.4 $281.6
Other $0.0 $30.1 $30.1
Total $192.3 $374.8 $567.1
Source: Office of Financial Management, 2019; Washington State Department of Revenue,
2019; Community Attributes Inc., 2019.
AEROSPACE WORKS FOR WA PAGE 8
ECONOMIC IMPACT STUDY MARCH 2019AEROSPACE WORKFORCE SUPPLY AND DEMAND
The most recent forecasts produced by the Washington State Employment
Security Department project declines in overall aerospace employment
through 2026. The current outlook for workforce demand and supply provides
an important element in helping industry and regional leaders to address
future workforce challenges.
Core occupations represent the primary skills within the aerospace industry.
Exhibits 12 and 13 present these core aerospace occupations in Washington.
These occupations were selected based on their relatively high concentration
within the aerospace industry and the number of employees in total within
the aerospace industry in Washington.
These core occupations represent only a portion of total employment within
the aerospace industry. However, these occupations are highlighted because
they represent the primary skills that define employment within the
industry. Overall employment within the aerospace industry includes
employment in other occupations that are not core to the industry.
Additionally, core aerospace occupations are also present in industries other
than aerospace throughout Washington.
Aerospace occupations fall within a range of SOC codes, with the highest
concentrations among production and architecture and engineering, with
more than 40,800 out of 62,300 employees within the aerospace industry,
representing more than 65% of aerospace employment within Washington.
Additionally, overall these occupations have the highest concentration within
the aerospace industry of total occupational employment, 40% for production
occupations and 41% for architecture and engineering. (Exhibit 12)
Aerospace occupations cover a diverse set of skills and experience. Across
Washington, the occupation with the highest concentration in the industry
are aircraft structure, surfaces, rigging and systems assemblers, this is also
the occupation with the most employment within the aerospace industry.
Other prominent production occupations within the Washington industry
include inspectors, testers, sorters, samplers and weighers; machinists; first-
line supervisors of production and operating workers; and tool and die
makers, each with more than 1,000 jobs in Washington. The aerospace
industry also employs a diversity of architecture and engineering
occupations. The industry employs nearly 5,000 aerospace engineers, as well
as more than 1,000 each of industrial engineers; electrical engineers;
industrial engineering technicians; and mechanical engineers. (Exhibit 12)
AEROSPACE WORKS FOR WA PAGE 9
ECONOMIC IMPACT STUDY MARCH 2019Exhibit 12. Aerospace Architecture and Engineering Occupations and
Production Occupations, Estimated Employment in Industry and Total
Employment, Washington, 2018
Employment Employment in Total Share in
SOC Occupation
in Industry Other Industries Employment Industry
Aircraft Structure, Surfaces, Rigging, and Systems
51-2011 10,901 259 11,160 98%
Assemblers
51-9061 I nspectors, Testers, Sorters, Samplers, and Weighers 3,906 7,140 11,046 35%
51-4041 Machinists 1,943 7,873 9,815 20%
First-Line Superv isors of Production and Operating
51-1011 1,671 12,270 13,941 12%
Workers
51-4111 Tool and Die Makers 1,450 444 1,893 77%
Computer-Controlled Machine Tool Operators,
51-4011 969 639 1,608 60%
Metal and Plastic
51-9122 Painters, Transportation Equipment 734 1,624 2,358 31%
51-2091 Fiberglass Laminators and Fabricators 447 780 1,227 36%
Cutting, Punching, and Press Machine Setters,
51-4031 355 1,541 1,895 19%
Operators, and Tenders, Metal and Plastic
Grinding, Lapping, Polishing, and Buffing Machine
51-4033 Tool Setters, Operators, and Tenders, Metal and 331 672 1,004 33%
Plastic
51-2031 Engine and Other Machine Assemblers 296 608 904 33%
51-9191 Adhesiv e Bonding Machine Operators and Tenders 286 294 580 49%
Computer Numerically Controlled Machine Tool
51-4012 256 101 357 72%
Programmers, Metal and Plastic
Coating, Painting, and Spraying Machine Setters,
51-9121 151 1,287 1,438 11%
Operators, and Tenders
Milling and Planing Machine Setters, Operators, and
51-4035 113 186 298 38%
Tenders, Metal and Plastic
51-6093 Upholsterers 78 392 471 17%
51-4194 Tool Grinders, Filers, and Sharpeners 76 181 257 30%
Lathe and Turning Machine Tool Setters, Operators,
51-4034 40 108 149 27%
and Tenders, Metal and Plastic
Rolling Machine Setters, Operators, and Tenders,
51-4023 38 310 348 11%
Metal and Plastic
Heat Treating Equipment Setters, Operators, and
51-4191 25 64 89 28%
Tenders, Metal and Plastic
Production Occupations Subtotal 24,066 36,772 60,838 40%
17-2011 Aerospace Engineers 4,964 1,288 6,252 79%
17-2112 I ndustrial Engineers 3,784 3,297 7,081 53%
17-2071 Electrical Engineers 1,465 4,430 5,895 25%
17-3026 I ndustrial Engineering Technicians 1,417 587 2,004 71%
17-2141 Mechanical Engineers 1,226 6,047 7,272 17%
17-3013 Mechanical Drafters 990 1,056 2,047 48%
17-2131 Materials Engineers 769 200 969 79%
17-2199 Engineers, All Other 625 2,531 3,156 20%
17-2072 Electronics Engineers, Except Computer 527 3,149 3,677 14%
17-3012 Electrical and Electronics Drafters 402 420 822 49%
17-3021 Aerospace Engineering and Operations Technicians 255 124 379 67%
17-3027 Mechanical Engineering Technicians 143 808 951 15%
17-3025 Env ironmental Engineering Technicians 121 312 433 28%
17-3024 Electro-Mechanical Technicians 70 63 133 53%
Architecture and Engineering Occupations Subtotal 16,758 24,311 41,070 41%
Employment figures are estimated based on the latest available data through June 2018 .
Sources: Bureau of Labor Statistics, 2019; Washington State Employment Security
Department, 2019; Community Attributes Inc., 2019.
AEROSPACE WORKS FOR WA PAGE 10
ECONOMIC IMPACT STUDY MARCH 2019Other SOC codes prominent within the aerospace industry include business
and financial operations occupations; installation, maintenance and repair
occupations; computer and mathematical occupations; management
occupations; transportation and material moving occupations; life, physical,
and social science occupations; healthcare practitioners and technical
occupations; protective service occupations; and office and administrative
support occupations. These occupations represent nearly 35% of total
aerospace occupational employment, at roughly 21,500 jobs. Overall nearly
25% of total employment within these occupations is represented in the
aerospace industry alone. (Exhibit 13)
The diversity in aerospace employment extends beyond production and
architecture and engineering occupations. The industry also employs more
than 3,600 logisticians and more than 3,300 aircraft mechanics and service s
technicians. Other occupations with more than 1,000 employees include
purchasing agents; production, planning and expediting clerks; avionics
technicians; software developers; and architectural and engineering
managers. Occupations with high concentrations within the aerospace
industry that exemplify the diversity of skills include materials engineers;
computer numerically controlled machine tool programmers; aerospace
engineering and operations technicians; and materials scientists. (Exhibits
12 and 13)
AEROSPACE WORKS FOR WA PAGE 11
ECONOMIC IMPACT STUDY MARCH 2019Exhibit 13. All Other Aerospace Occupations, Estimated Employment in
Industry and Total Employment, Washington, 2018
Employment Employment in Total Share in
SOC Occupation
in Industry Other Industries Employment Industry
13-1081 Logisticians 3,644 2,316 5,961 61%
Purchasing Agents, Except Wholesale, Retail, and
13-1023 2,475 6,061 8,536 29%
Farm Products
13-2051 Financial Analysts 650 5,759 6,409 10%
13-2099 Financial Specialists, All Other 524 2,615 3,140 17%
Business and Financial Operations Occupations
Subtotal 7,294 16,752 24,046 30%
49-3011 Aircraft Mechanics and Serv ice Technicians 3,302 1,799 5,101 65%
49-2091 Av ionics Technicians 1,728 534 2,262 76%
49-9041 I ndustrial Machinery Mechanics 878 5,591 6,470 14%
Electrical and Electronics Repairers, Commercial
49-2094 301 1,149 1,450 21%
and I ndustrial Equipment
Installation, Maintenance, and Repair Occupations
Subtotal 6,210 9,074 15,283 41%
15-1133 Softw are Dev elopers, Systems Softw are 1,473 12,904 14,378 10%
15-2031 Operations Research Analysts 904 2,229 3,133 29%
15-1143 Computer Netw ork Architects 716 5,363 6,079 12%
15-1122 I nformation Security Analysts 263 1,933 2,196 12%
15-2021 Mathematicians 34 110 144 24%
Computer and Mathematical Occupations Subtotal 3,390 22,540 25,930 13%
11-9041 Architectural and Engineering Managers 1,038 3,300 4,338 24%
11-3051 I ndustrial Production Managers 634 1,880 2,514 25%
Management Occupations Subtotal 1,672 5,180 6,852 24%
53-7021 Crane and Tow er Operators 192 1,070 1,261 15%
53-2012 Commercial Pilots 157 826 983 16%
53-2022 Airfield Operations Specialists 43 224 267 16%
Transportation and Material Moving Occupations
Subtotal 392 2,119 2,512 16%
43-5061 Production, Planning, and Expediting Clerks 2,043 7,542 9,585 21%
29-9011 Occupational Health and Safety Specialists 257 2,278 2,535 10%
19-2032 Materials Scientists 145 124 270 54%
33-9021 Priv ate Detectiv es and I nv estigators 92 519 611 15%
All Occupations 62,321 127,211 189,531 33%
Employment figures are estimated based on the latest available data through June 2018.
Sources: Bureau of Labor Statistics, 2019; Washington State Employment Security
Department, 2019; Community Attributes Inc., 2019.
There are more than 62,300 workers employed in aerospace core occupations
in Washington state. Aerospace core occupational employment represents a
third of all employment (127,200) in these occupations across the state
economy. Total employment among Washington aerospace occupations is
more than 189,500 employees, of which more than 127,200 work outside the
aerospace industry. (Exhibit 13)
Aerospace occupations provide their workers with higher-than-average
wages, overall the annual median wage across Washington was $44,440 in
2017. Among all core aerospace occupations, the occupation with the highest
median wage are architecture and engineering managers, followed by
industrial production managers. Out of 56 core aerospace occupations nine
have median wages higher than $100,000, 24 have 90th percentile wages
higher than $100,000. Additionally, among all core aerospace occupations,
AEROSPACE WORKS FOR WA PAGE 12
ECONOMIC IMPACT STUDY MARCH 2019just ten have median wages less than the overall median wage in
Washington. (Exhibits 14 and 15)
Exhibit 14. Aerospace Occupations Median Wage and 90 th Percentile
Wage, On-the-Job Training, Washington, 2017
90th
Employment Median
SOC Occupation Percentile
in Industry Wage
Wage
53-2012 Commercial Pilots 157 $101,940 $85,030
53-7021 Crane and Tow er Operators 192 $70,880 $72,210
53-2022 Airfield Operations Specialists 43 $66,480 $63,230
Computer-Controlled Machine Tool Operators,
51-4011 969 $62,940 $57,810
Metal and Plastic
49-9041 I ndustrial Machinery Mechanics 878 $58,930 $56,280
33-9021 Priv ate Detectiv es and I nv estigators 92 $63,990 $54,520
51-9061 I nspectors, Testers, Sorters, Samplers, and Weighers 3,906 $57,860 $52,520
51-4194 Tool Grinders, Filers, and Sharpeners 76 $55,360 $52,490
51-9122 Painters, Transportation Equipment 734 $58,350 $50,610
Milling and Planing Machine Setters, Operators, and
51-4035 113 $57,370 $50,420
Tenders, Metal and Plastic
51-4041 Machinists 1,943 $51,020 $49,070
43-5061 Production, Planning, and Expediting Clerks 2,043 $49,140 $45,380
51-2031 Engine and Other Machine Assemblers 296 $47,580 $43,840
Lathe and Turning Machine Tool Setters, Operators,
51-4034 40 $46,550 $42,040
and Tenders, Metal and Plastic
51-6093 Upholsterers 78 $44,530 $41,080
51-9191 Adhesiv e Bonding Machine Operators and Tenders 286 $46,570 $41,050
51-2091 Fiberglass Laminators and Fabricators 447 $44,460 $39,950
Heat Treating Equipment Setters, Operators, and
51-4191 25 $47,170 $39,740
Tenders, Metal and Plastic
Cutting, Punching, and Press Machine Setters,
51-4031 355 $43,770 $39,660
Operators, and Tenders, Metal and Plastic
Rolling Machine Setters, Operators, and Tenders,
51-4023 38 $42,960 $39,290
Metal and Plastic
Coating, Painting, and Spraying Machine Setters,
51-9121 151 $36,500 $34,360
Operators, and Tenders
Grinding, Lapping, Polishing, and Buffing Machine
51-4033 Tool Setters, Operators, and Tenders, Metal and 331 $36,490 $33,780
Plastic
Aircraft Structure, Surfaces, Rigging, and Systems
51-2011 10,901 * *
Assemblers
Computer Numerically Controlled Machine Tool
51-4012 256 * *
Programmers, Metal and Plastic
51-4111 Tool and Die Makers 1,450 * *
* indicates data is suppressed by the U.S. Bureau of Labor Statistics in order to comply with
nondisclosure rules. Employment figures are estimated based on the latest available data
through June 2018.
Sources: U.S. Bureau of Labor Statistics, 2018; Washington State Employment Security
Department, 2019; Community Attributes Inc., 2019.
On-the-job training, associate degree or postsecondary award, bachelor’s
degree and master’s degree or higher are categories used to break core
occupations into key groupings. These categories are based on Bureau of
Labor Statistics minimum education requirements for entry. These education
levels are set at a national level and may not be fully reflective of the hiring
practices in Washington, or within individual companies. Additionally, the
education level breakouts are attached to the occupation, actual openings for
AEROSPACE WORKS FOR WA PAGE 13
ECONOMIC IMPACT STUDY MARCH 2019these occupations may have different requirements, and the talent pool for
these occupations may have a greater level of education than indicated by the
minimum education level. These minimum education levels are used to group
occupations by the relative level of education and training required for entry.
Exhibit 15. Aerospace Occupations Median Wage and 90 th Percentile
Wage, Associate Degree or Postsecondary Award or Higher, Washington,
2017
90th
Employment Median
SOC Occupation Percentile
in Industry Wage
Wage
Associate degree or Postsecondary Award
17-3012 Electrical and Electronics Drafters 402 $89,990 $92,870
17-3021 Aerospace Engineering and Operations Technicians 255 $92,980 $88,410
17-3024 Electro-Mechanical Technicians 70 $76,830 $83,760
17-3013 Mechanical Drafters 990 $80,010 $81,940
17-3025 Env ironmental Engineering Technicians 121 $69,470 $71,690
Electrical and Electronics Repairers, Commercial
49-2094 301 $72,220 $70,850
and I ndustrial Equipment
First-Line Superv isors of Production and Operating
51-1011 1,671 $73,020 $68,390
Workers
49-3011 Aircraft Mechanics and Serv ice Technicians 3,302 $68,180 $66,300
17-3027 Mechanical Engineering Technicians 143 $64,000 $62,400
17-3026 I ndustrial Engineering Technicians 1,417 * *
49-2091 Av ionics Technicians 1,728 * *
Bachelor's degree
11-9041 Architectural and Engineering Managers 1,038 $154,140 $148,230
11-3051 I ndustrial Production Managers 634 $126,440 $117,370
15-1133 Softw are Dev elopers, Systems Softw are 1,473 $117,810 $117,280
17-2072 Electronics Engineers, Except Computer 527 $107,060 $109,280
17-2071 Electrical Engineers 1,465 $110,360 $107,570
15-1122 I nformation Security Analysts 263 $106,040 $105,420
17-2112 I ndustrial Engineers 3,784 $106,730 $104,230
17-2199 Engineers, All Other 625 $101,260 $102,530
15-1143 Computer Netw ork Architects 716 $104,890 $92,830
17-2141 Mechanical Engineers 1,226 $95,870 $89,170
13-1081 Logisticians 3,644 $89,120 $88,280
15-2031 Operations Research Analysts 904 $91,740 $87,800
13-2051 Financial Analysts 650 $85,860 $79,090
29-9011 Occupational Health and Safety Specialists 257 $78,980 $75,910
Purchasing Agents, Except Wholesale, Retail, and
13-1023 2,475 $71,700 $67,650
Farm Products
13-2099 Financial Specialists, All Other 524 $74,130 $66,910
17-2011 Aerospace Engineers 4,964 * *
17-2131 Materials Engineers 769 * *
19-2032 Materials Scientists 145 * *
Master's degree or higher
15-2021 Mathematicians 34 $114,400 $116,190
* indicates data is suppressed by the U.S. Bureau of Labor Statistics in order to comply with
nondisclosure rules. Employment figures are estimated based on the latest available data
through June 2018.
Sources: U.S. Bureau of Labor Statistics, 2018; Washington State Employment Security
Department, 2019; Community Attributes Inc., 2019.
AEROSPACE WORKS FOR WA PAGE 14
ECONOMIC IMPACT STUDY MARCH 2019Demand Analysis
Total demand2 for occupations matching the workforce needs of aerospace 3 in
Washington are projected to average nearly 19,600 annual openings between
2021 and 2026. Looking at the aerospace industry specifically, aerospace
occupations are forecasted to have more than 6,000 openings between 2021
and 2026, with the most openings found in the aircraft structure, surfaces,
rigging and systems assemblers occupation at more than 1,000 average
annual openings. The occupation with the second highest forecasted demand
is inspectors, testers, sorters, samplers and weighers, with more than 500
openings annually between 2021 and 2026. (Exhibit 16)
Forecasted occupational openings are sourced from the occupational
projections developed by the Washington State Employment Security
Department (ESD). Average annual openings include both openings
generated by growth and openings generated by separations. Separations are
created when workers leave an occupation for a different occupation or exit
the labor force. Thus, average annual openings include openings created by
growth, retirements and workers moving to different occupations.
Occupations with very low and negative growth rates have average annual
openings generated exclusively by separations. Aircraft structure, surfaces,
rigging, and systems assemblers is projected to decline in overall employment
between 2021 and 2026, however, this occupation is also projected to have
more than 1,000 openings annually, driven by retirements and other
separations.
Total demand does not account for job openings that go unfilled annually. In
2018, there were an average of more than 150,500 job postings monthly
across Washington, according to Help Wanted Online data from The
Conference Board. Occupations with high projected demand also have
significant job postings monthly. Computer specialist occupations, which
include software developers averaged nearly 16,300 job postings monthly in
2018. Engineering occupations averaged nearly 3,900 job postings monthly.
Production occupations also had significant numbers of job postings in 2018.
Supervisors of production workers averaged more than 800 job postings each
month. Assemblers and fabricators, which includes aircraft structure,
surfaces, rigging and systems assemblers, had nearly 470 job postings each
month. Metal and plastic workers averaged nearly 690 job postings monthly.
2 Total demand may be underestimated, as the occupational projections used by the
Employment Security Department represent the point of equilibrium between
employment demand and supply. Thus, employment projections do not account for
unmet demand or unfilled jobs.
3 Total demand for occupations covers demand across all industries in Washington
and includes but is not limited to the aerospace industry.
AEROSPACE WORKS FOR WA PAGE 15
ECONOMIC IMPACT STUDY MARCH 2019All other production workers averaged nearly 1,400 job postings each month
in 2018.
Exhibit 16. Washington Aerospace Occupational Demand per Year, 2021
and 2026
Average Average Annual
Estimated Estimated
Annual Openings in CAGR
SOC Occupation Employment Employment
Openings Industry (2021-2026)
2021 2026
(2021-2026) (2021-2026)
15-1133 Softw are Dev elopers, Systems Softw are 18,568 20,972 1,722 176 2.5%
First-Line Superv isors of Production and Operating
51-1011 15,688 16,012 1,585 190 0.4%
Workers
51-9061 I nspectors, Testers, Sorters, Samplers, and Weighers 11,926 12,020 1,433 507 0.2%
43-5061 Production, Planning, and Expediting Clerks 10,881 11,325 1,195 255 0.8%
51-4041 Machinists 10,888 11,090 1,137 225 0.4%
Aircraft Structure, Surfaces, Rigging, and Systems
51-2011 10,932 10,664 1,055 1,031 -0.5%
Assemblers
Purchasing Agents, Except Wholesale, Retail, and
13-1023 9,414 9,603 846 245 0.4%
Farm Products
13-2051 Financial Analysts 7,897 8,502 800 81 1.5%
49-9041 I ndustrial Machinery Mechanics 7,313 7,514 674 92 0.5%
13-1081 Logisticians 6,412 6,587 653 399 0.5%
15-1143 Computer Netw ork Architects 7,357 8,052 627 74 1.8%
17-2112 I ndustrial Engineers 7,991 8,461 617 330 1.1%
17-2141 Mechanical Engineers 8,291 8,688 605 102 0.9%
17-2071 Electrical Engineers 6,652 6,976 492 122 1.0%
49-3011 Aircraft Mechanics and Serv ice Technicians 5,376 5,343 397 257 -0.1%
11-9041 Architectural and Engineering Managers 4,853 4,983 362 87 0.5%
13-2099 Financial Specialists, All Other 3,675 3,918 362 60 1.3%
17-2011 Aerospace Engineers 6,292 6,194 345 274 -0.3%
51-9122 Painters, Transportation Equipment 2,730 2,911 327 102 1.3%
15-1122 I nformation Security Analysts 2,900 3,424 315 38 3.4%
15-2031 Operations Research Analysts 3,799 4,194 312 90 2.0%
17-2072 Electronics Engineers, Except Computer 4,020 4,118 275 39 0.5%
17-2199 Engineers, All Other 3,523 3,647 252 50 0.7%
Cutting, Punching, and Press Machine Setters,
51-4031 2,073 2,074 232 43 0.0%
Operators, and Tenders, Metal and Plastic
11-3051 I ndustrial Production Managers 2,787 2,841 205 52 0.4%
17-3013 Mechanical Drafters 2,189 2,215 189 91 0.2%
49-2091 Av ionics Technicians 2,378 2,398 188 144 0.2%
29-9011 Occupational Health and Safety Specialists 2,960 3,114 182 18 1.0%
Coating, Painting, and Spraying Machine Setters,
51-9121 1,628 1,661 177 19 0.4%
Operators, and Tenders
51-4111 Tool and Die Makers 1,905 1,872 170 130 -0.3%
17-3026 I ndustrial Engineering Technicians 2,034 2,016 167 118 -0.2%
Computer-Controlled Machine Tool Operators,
51-4011 1,650 1,629 156 94 -0.3%
Metal and Plastic
53-7021 Crane and Tow er Operators 1,403 1,427 151 23 0.3%
51-2091 Fiberglass Laminators and Fabricators 1,315 1,305 149 54 -0.2%
Electrical and Electronics Repairers, Commercial
49-2094 1,579 1,586 137 28 0.1%
and I ndustrial Equipment
53-2012 Commercial Pilots 1,181 1,268 130 21 1.4%
Grinding, Lapping, Polishing, and Buffing Machine
51-4033 Tool Setters, Operators, and Tenders, Metal and 1,087 1,092 115 38 0.1%
Plastic
All Other Occupations (19) 8,944 9,003 829 302 0.1%
Total 212,491 220,699 19,565 6,001 0.8%
Sources: U.S. Bureau of Labor Statistics, 2019; Washington State Employment Security
Department, 2019; Community Attributes Inc., 2019.
AEROSPACE WORKS FOR WA PAGE 16
ECONOMIC IMPACT STUDY MARCH 2019Supply Analysis
The local workforce supply is primarily composed of two elements: the entry
of new graduates into the available talent pool and the existing talent pool of
qualified unemployed workers actively seeking employment. It is important
to note that workers from outside Washington can fill talent gaps but are not
assessed in this analysis.
There are a total of 6,800 graduates in 2017 who are qualified for the needs
of the aerospace industry. Among those graduates, 95% are assumed to seek
work within Washington. Among these qualified graduates, 943 graduates
are qualified for aerospace occupations that require on-the-job training.4
Among the total graduates from Washington institutions qualified for
aerospace occupations, only a portion can be expected to seek work in the
aerospace industry.
Total supply is defined as the sum of local qualified graduates and qualified
unemployment insurance claimants. Within Washington, there are a total of
2,307 local graduates and 1,043 unemployment insurance claimants who can
reasonably be expected to fill the needs of the aerospace industry within
Washington. In total 69% of total supply is projected to be local graduates.
Graduates qualified for aerospace occupations that require an associate
degree or postsecondary award for entry represent 43% of total graduate
supply, followed by graduates qualified for occupations that require a
bachelor’s degree for entry, representing 38%. (Exhibit 17)
Exhibit 17. Total Talent Supply, Washington, 2017
Qualified
Source of Supply
Workers
On-the-Job Training 415
Associate Degree or Postsecondary Award 1,003
Bachelor's Degree 879
Master's Degree or Higher 10
Graduate Subtotal 2,307
Unemployment I nsurance Claimants 1,043
Total 3,350
Sources: National Center for Education Statistics’ Integrated Postsecondary Education
System, 2018; Washington State Employment Security Department, 2019; Community
Attributes Inc, 2019.
A wide range of educational institutions, high school programs and training
centers provide training options for aerospace occupations. Completions data
only includes information about postsecondary schools, some of the graduates
from Washington training programs are not captured in the Washington
4These occupations are undercounted due to the lack of information linking
programs to occupations outside of IPEDS.
AEROSPACE WORKS FOR WA PAGE 17
ECONOMIC IMPACT STUDY MARCH 2019workforce supply. Additionally, high school students who may be qualified for
some aerospace occupations are not counted in this supply analysis. For
example, the Washington Aerospace Training & Research Center in Everett
has training programs for aerospace manufacturing assembly mechanics,
aerospace electrical assembly mechanics, aerospace quality assurance,
aerospace tooling and aerospace composites.
Apprenticeships are also not included among the graduate supply estimates.
The primary feature of an apprenticeship program is on-the-job training.
Therefore, these individuals are already counted among the individuals
employed in the industry. If they were to be added to the talent pool
calculations, they would be double-counted within this analysis.
The Aerospace Joint Apprenticeship Committee (AJAC) provides advanced
manufacturing training to improve the skills of the aerospace workforce
through classroom and on-the-job training. Training programs offered by
AJAC enhance worker skills for occupations including machinist; precision
metal fabricator; tool and die maker; industrial maintenance technician;
plastics process technician; industrial manufacturing technician. AJAC also
provides youth apprenticeship and training for production technicians.
Across Washington, important initiatives and investment are being made to
prepare students for STEM jobs, like those in the aerospace industry. The
Career Connected Washington Task Force is a public private partnership
with the aim of providing 100,000 youth in Washington with career
connected learning over five years. Regional programs are also working to
understand the skills needed by employers and matches training to meet
those needs. Snohomish STEM for example is a non-profit working to link
training with the STEM skills needed by regional employers.
Skills Centers across Washington provide high school students with
vocational training options. Sno-Isle TECH is an effort of 14 school districts
in the Snohomish County region, which provides students with a variety of
training opportunities including information technology; business marketing
and management; science and health; and trade and industry. These Skills
Centers also offer high school students dual credit options to learn skills for
career pathways and earn credit from regional higher education institutions.
Sno-Isle TECH, for example, offers high school students dual credit courses
in aerospace; precision machining; welding and metal fabrication; computers,
servers and networking among others.
AEROSPACE WORKS FOR WA PAGE 18
ECONOMIC IMPACT STUDY MARCH 2019Supply and Demand
The combined elements of expected supply and projected occupational
demand yields a summary of annual occupational gaps within the aerospace
industry. Exhibits 19 and 20 summarize graduate supply, total demand, UI
claimant supply and the expected gaps for each aerospace occupation.
The aerospace industry’s annual workforce supply in Washington is projected
to total 3,350, composed of Washington graduates entering the workforce
after completing an aerospace-related educational program (69%) and
unemployed persons whose most recent occupation was in aerospace (31%).
Total openings in Washington’s aerospace industry is projected to total more
than 6,000 annually. Taken together, projected annual supply and demand
indicate an overall shortage of 2,651 workers annually from 2021 to 2026.
Although the overall workforce supply and demand analysis indicates a
shortage, it is important to note that there are both shortages and surpluses
in key aerospace occupations. (Exhibit 18)
An examination of occupations by the minimum education level requirements
reveals where the significant gaps exist. Jobs that require on-the-job training
are projected to experience a shortage of 1,976 in qualified workers in
Washington. Jobs that require a bachelor’s degree are also forecasted to see a
gap of qualified workers, nearly 43% of forecasted annual openings could go
unfilled by Washington workers. The opposite situation is expected to occur
among occupations that require an associate degree, these occupations are
projected to experience a surplus of 305 qualified candidates from
Washington. (Exhibit 18)
Exhibit 18. Summary of Annual Aerospace Talent Supply and Demand by
Education Requirement, 2021-2026
Total Total UI
Total Interim Final
Educational Requirements Graduate Claims
Demand Gap Gap
Supply Supply
On-the-Job Training 414 2,772 (2,358) 382 (1,976)
Associate Degree or Postsecondary Award 1,004 919 85 220 305
Bachelor's Degree 879 2,307 (1,428) 441 (987)
Master's Degree or Higher 10 3 7 0 7
Total 2,307 6,001 (3,694) 1,043 (2,651)
Sources: U.S. Bureau of Labor Statistics, 2019; Washington State Employment Security
Department, 2019; National Center for Education Statistics’ Integrated Postsecondary
Education System, 2018; Community Attributes Inc., 2019.
It is important to bear in mind not all occupations within an educational
grouping are easily substitutable. A surplus in one occupation may not
necessarily be countered by a shortage in another occupation. The skills
required may not be the same between occupations. As such, a detailed
AEROSPACE WORKS FOR WA PAGE 19
ECONOMIC IMPACT STUDY MARCH 2019You can also read