Africa Oil Gas & Energy Australia Conference Presentation - August 2018 - Tlou Energy
←
→
Page content transcription
If your browser does not render page correctly, please read the page content below
Africa Oil Gas & Energy Australia Conference
                  Presentation – August 2018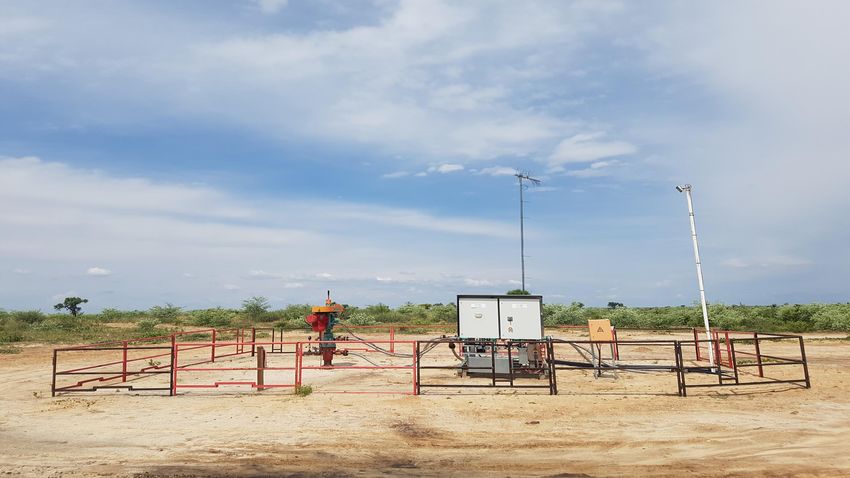
This presentation (Presentation) has been prepared by Tlou Energy Limited (Tlou). The Presentation and information contained in it is being provided to shareholders and investors for information purposes only. The information contained in this disclaimer does not
constitute an offer, invitation or recommendation to subscribe for or purchase any security and neither the Presentation, disclaimer nor anything contained therein forms the basis of any contract or commitment. This Presentation does not take into account your
individual investment objective, financial situation or particular needs. You must not act on the basis of any matter contained in this Presentation. This Presentation may contain forecasts and forward looking information. Such forecasts, projections and information
are not a guarantee of future performance and may involve unknown risks and uncertainties. Shareholders and investors should undertake their own evaluation of this information and otherwise contact their professional advisers in the event they wish to buy or sell
shares. To the extent the information contains any projections, Tlou has provided these projections based upon the information that has been provided to Tlou. None of Tlou or its directors, officers or employees make any representations (express or implied) as to the
accuracy or otherwise of any information or opinions in the Presentation and (to the maximum extent permitted by law) no liability or responsibility is accepted by such persons.

Summary information

This Presentation is a visual aid which will be used by representatives of Tlou to assist in investor and analyst presentations. It is not intended to be read as a stand alone document. This Presentation contains selected and abbreviated summary information about Tlou
and its subsidiaries and their activities current as at the date of this Presentation. The information in this Presentation is of general background and does not purport to be complete. It is intended to be read by a sophisticated investor audience familiar with Tlou and the
sector in which it operates and to be accompanied by a verbal presentation delivered by a representative of Tlou. It should be read in conjunction with Tlou’s other periodic and continuous disclosure announcements lodged with the Australian Securities Exchange
(ASX), which are available at www.asx.com.au.

ASX Releases
Investors are advised that by their nature as visual aids, presentations provide information in a summary form. The key information on detailed resource statements can be found in Tlou’s ASX releases. Resource statements are provided to comply with ASX guidelines
but investors are urged to read supporting information in full on the website.

Past performance
Past performance information given in this Presentation is given for illustrative purposes only and should not be relied upon as (and is not) an indication of future performance.

Future performance
This Presentation contains certain “forward-looking statements”. Forward looking words such as, “expect”, “should”, “could”, “may”, “plan”, “will”, “forecast”, “estimate”, “target” and other similar expressions are intended to identify forward-looking statements within
the meaning of securities laws of applicable jurisdictions. Indications of, and guidance on, future earnings and financial position and performance are also forward-looking statements. Forward-looking statements, opinions and estimates provided in this Presentation
are based on assumptions and contingencies which are subject to change without notice, as are statements about market and industry trends, which are based on interpretations of current market conditions. Such forward-looking statements, opinions and estimates
are not guarantees of future performance.

Forward-looking statements including projections, guidance on future earnings and estimates are provided as a general guide only and should not be relied upon as an indication or guarantee of future performance. This Presentation contains such statements that are
subject to known and unknown risks and uncertainties and other factors, many of which are beyond Tlou’s control, and may involve significant elements of subjective judgement and assumptions as to future events which may or may not be correct. It is believed that
the expectations reflected in these statements are reasonable, but they may be affected by a range of variables which could cause actual results or trends to differ materially, including but not limited to: price fluctuations, actual demand, currency fluctuations, drilling
and production results, reserve estimates, loss of market, industry competition, environmental risks, physical risks, legislative, fiscal and regulatory developments, economic and financial market conditions in various countries and regions, political risks, project delay
or advancement, approvals and cost estimates. Such forward-looking statements are relevant at the date of this Presentation and Tlou assumes no obligation to update such information.

Investment risk
An investment in Tlou shares is subject to investment and other known and unknown risks, some of which are beyond the control of Tlou. Tlou does not guarantee any particular rate of return or the performance of Tlou. Persons should have regard to the risks outlined
in this Presentation.

COMPETENT PERSONS STATEMENT
The gas reserves and resource estimates for the Lesedi CBM Project provided in this presentation (refer slide 23) were released to the Market on 20 February 2018 (Announcement). Tlou confirms that it is not aware of any new information or data that materially affects
the information included in the Announcement and that all of the material assumptions and technical parameters underpinning the estimates in the Announcement continue to apply and have not materially changed. The gas reserve and resource estimates are based
on and fairly represents, information and supporting documentation and were determined by Dr. Bruce Alan McConachie of SRK Consulting (Australasia) Pty Ltd, in accordance with Petroleum Resource Management System guidelines. Dr. McConachie is considered
to be a qualified person as defined under the ASX Listing Rule 5.42 and has given his consent to the use of the resource figures in the form and context in which they appear in this Presentation.
China 2016:                          1.61 million people died from air pollution

                  India 2016:                          1.58 million people died from air pollution

                  Globally 2016:                       6.1 million people died from air pollution

Source: Blue Energy corporate presentation 19/7/2018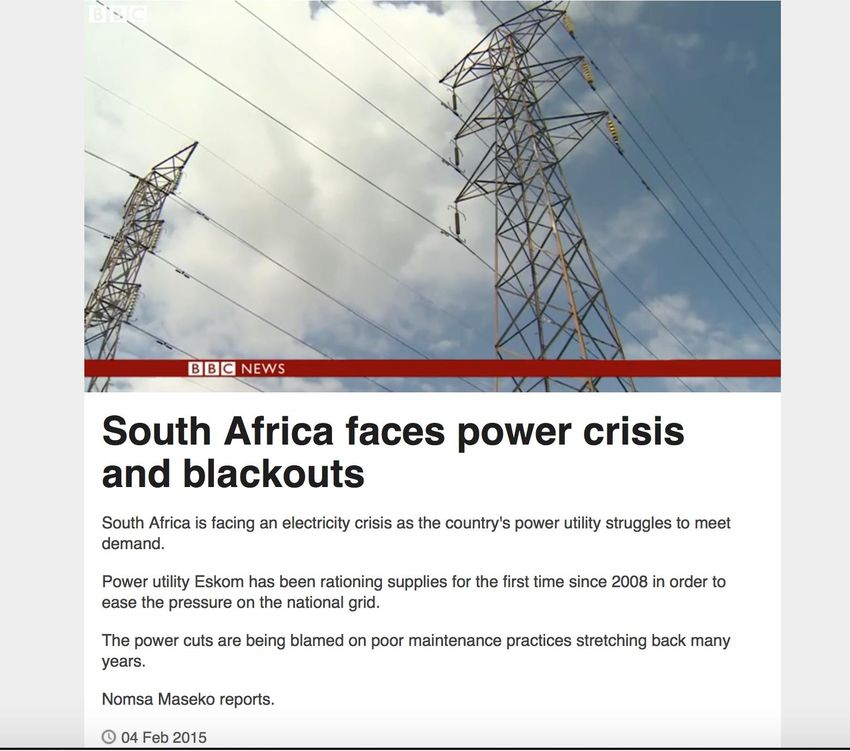
• Resources
  concentrated in a
  handful of countries
• Mozambique-
  focused
• Uncertainty over SA
  shale gas (economic,
  technical,
  environmental)
• Offshore Kudu field
  stalled (Namibia)
Gas consumption
                                                           Lifetime (Tcf)              Start year
Country                 Project            Capacity (MTPA) (2)            PJ/a         (3)        Status                             Partners
                                                                                                                                     Rovuma LNG (Exxon Mobil, Eni, CNPC)
                                                                                                  Development approvals, FID         70%, Galp (10%), KOGAS (10%), ENP
Mozambique              Rovuma LNG                        15.2 (1)     17.9      827         2024 expected 2019                      (10%)

                                                                                                                                      Anadarko (26.5%), Mitsui (20%), ENH
                        Mozambique                                                                                                    (15%), ONGC (10%), Oil India (10%), BPRL
Mozambique              LNG                                 12.88      15.1      701         2023Approaching FID, targeted later 2018 (10%), PTTEP (8.5%)

                                                                                                                                     Exxon Mobil (25%), CNODC (20%), ENH
Mozambique              Coral FLNG                             3.4     4.0       185         2021Under construction                  (10%), KOGAS (10%), Galp (10%)
                                                                                                                                     Shell, Exxon Mobil, Ophir Energy and
Tanzania                Tanzania LNG                            10     11.8      544         2027pre FEED                            Statoil

                                                                                                                                     Chevron (36.4%), Sonangol (22.8%), BP
Angola                  Angola LNG                             5.2     6.11      283         2013Commissioned/first cargo 2013 (4)   (13.6%), Eni (13.6%), Total (13.6%)

                                                                                                                                     Marathon Oil (60%), Sonagas (25%),
Equatorial Guinea       EGLNG 1                                3.4     4.0       185         2007Commissioned/first cargo 2007       Mitsui (8.5%), Marubeni (6.5%)

Total                                                       50.1        59    2,724

 (1) Mozambique LNG may be expanded to 50 MTPA
 (2) Assuming 25 year project life
 (3) Estimated
 (4) Project was offline for most of 2014-2016 with technical issues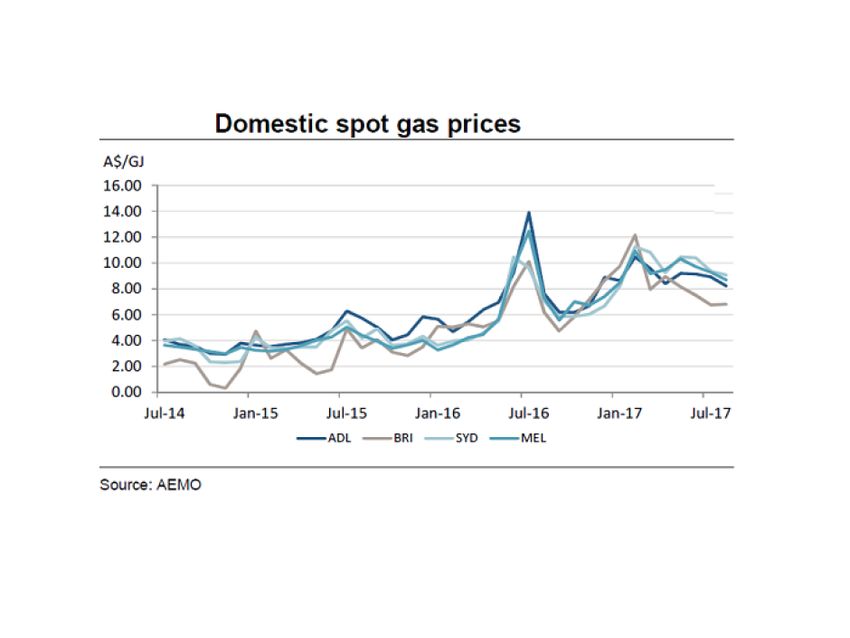

14,000

      12,000

      10,000

       8,000
 MW

       6,000

       4,000

       2,000

           0
            2018     2019      2020      2021    2022     2023   2024   2025    2026   2027   2028   2029   2030

                                      South Africa      Mozambique   Botswana   Namibia

Source: regional government planning documents
Gas gen capacity estimated by 2030 (1) Gas consumption
Country OCGT (MW) CCGT (MW) Total (MW) Lifetime (Tcf) (2) PJ/a
South Africa 6,459 5,490 11,949 4.4 233.8
Mozambique 1,015 1,015 0.8 40.0
Botswana 110 110 0.1 4.3
Namibia 250 250 0.2 9.9
Total 6,459 6,865 13,324 5.5 288
(1) Based on regional government planning documents
(2) Assuming 20 year project lifeRegional gas demand Sectoral gas demand
3,500 3,500
3,000 3,000
2,500 2,500
2,000 2,000
PJ/a
PJ/a
1,500 1,500
1,000 1,000
500 500
0 0
2018 2019 2020 2021 2022 2023 2024 2025 2026 2027 2028 2029 2030 2018 2019 2020 2021 2022 2023 2024 2025 2026 2027 2028 2029 2030
Mozambique Botswana Namibia South Africa LNG Power generation Industrial Commercial and residential Transport
Source: company websites, World Bank, USAID6
5
The east coast Australia
experience
4
$/mmbtu
3
2
1
0
Netback LNG Japan ex Mozambique (est) Mozambique minimum wholesale price
Sources: World Bank, Japan Ministry of Economy, Trade and Industry90,000
• US80bn in new generation
80,000
capacity required across the
region by 2030, to keep pace with 70,000
demand 60,000
• Zimbabwe USD8.8bn (50% of 50,000
USD M
2016 GDP)
40,000
• South Africa USD57.4bn
• Namibia USD4.2bn 30,000
• Zambia USD5.9bn 20,000
• Botswana USD1.8bn: 10,000
• 100MW solar w. storage
0
• Morupule B (5&6) 2016 2017 2018 2019 2020 2021 2022 2023 2024 2025 2026 2027 2028 2029 2030
• 100MW gas CCGT Botswana Zimbabwe Namibia Zambia South Africa
Source: regional government planning documents, official forecasts450,000
400,000
We analysed 3- and 5- year delays
350,000
to new capacity , which could lead
to severe power shortages in the 300,000
next decade 250,000
GWh
200,000
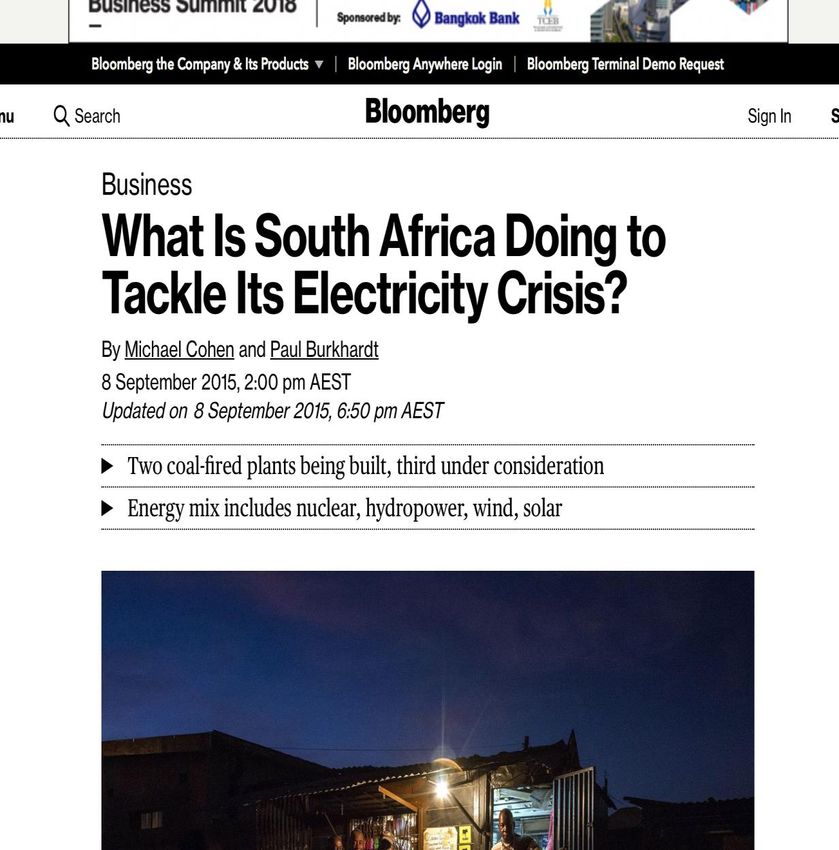
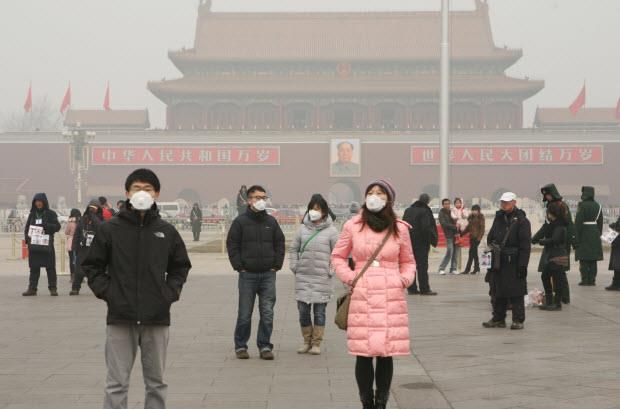
Power markets move in cycles of 1)
supply surplus, 2) under- 150,000
investment, then 3) deficit. The 100,000
current Eskom supply overhang
50,000
and cheap tariffs will not last
0
Eskom was in major supply deficit 2018 2019 2020 2021 2022 2023 2024 2025 2026 2027 2028 2029 2030
in 2008 and again in 2014 Annual energy demand Annual energy sent out (planned)
Annual energy sent out (3 year slippage) Annual energy sent out (5 year slippage)
Source: regional government planning documents, official forecasts, Mott MacDonald analysisTraditional capacity planning approach (dispatchable power only)
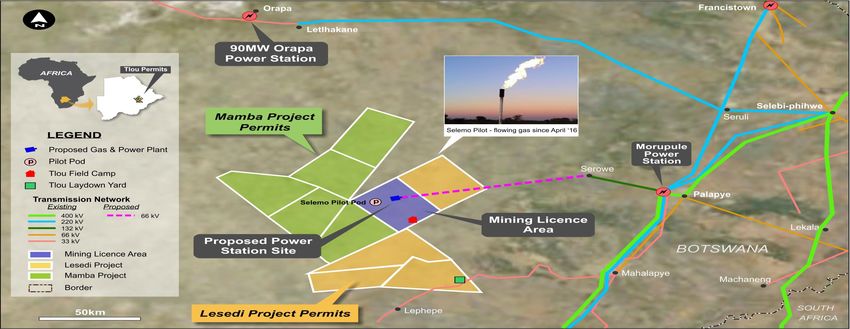
• Botswana currently relies on
imports from Eskom (SA)
• Plans to become self-sufficient
• Match long-term growth in
peak demand against
committed dispatchable
capacity
• Demand-supply balance grows
tight, even assuming new
projects are delivered
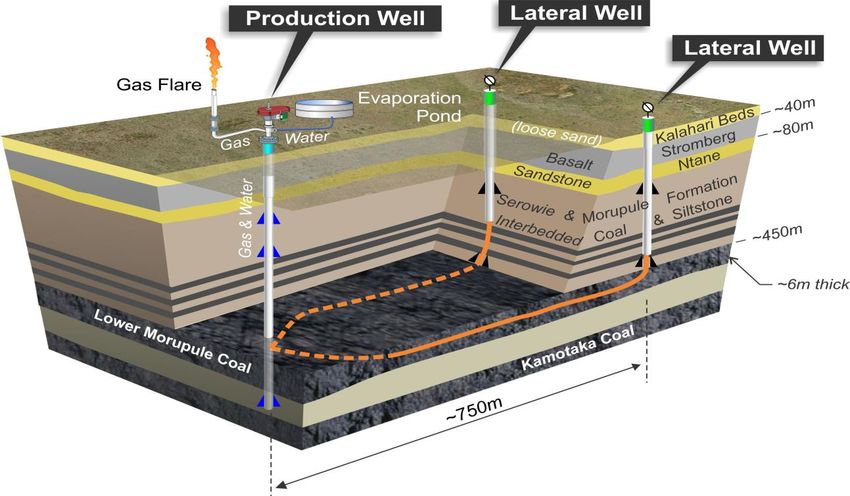
Source: Mott MacDonald, Botswana Power CorporationThe Company extracts CBM natural gas from coal, using horizontal drilling techniques. This
CBM gas can then be used for electricity generation.
➢ Tlou’s CBM extraction method
✓ Dual Lateral Pods, each comprising one
vertical and two horizontal wells
✓ Proven technology
✓ Minimum footprint allowing agricultural
use of land to continue
✓ No fracking required
✓ CBM can replace high carbon producing
power generation such as diesel and coal
fired power… generating power from CBM in Botswana
2012                           2014                         2016                            2018
             First Contingent Gas           First Gas                    Upstream                        Significant Increase in
             Resources                                                   Environment                     Gas Reserves and
                                                                         approval                        Contingent Resources

                                                                         First Gas Reserves

2009                          2013                      2015                            2017
Botswana operations           ASX Listing               Increased Contingent            First gas fired power
commenced                                               resources                       produced for field use

                                                        AIM Listing                     Development (Mining)
                                                                                        Licence granted

                                                                                        BSE Listing
Independent Gas Reserves Certification Technical Fundamentals
(1)
0.35 40.8 426.6 Coal Depth ~350-800m
BCF BCF BCF Gas Contents (Average) ~6 m3/t (DAF)
(1P) (2P) (3P) Gas compositions ~90% methane
(1) (2)
Gas Reserves Gas Contingent Resources
Tlou 1P 2P 3P 1C 2C 3C Gas Prospective
Location Project
Interest (BCF) (BCF) (BCF) (BCF) (BCF) (BCF) Resource (BCF)3
Lesedi CBM
Karoo Basin
(Lower Morupule coal) 100% -
Botswana (ML 2018/18L, PL001/2004)
0.34 25.2 252 4.6 45.6 331
Lesedi CBM
Karoo Basin (all coal seams)
100% -
Botswana (ML 2018/18L, 0.34 25.2 252 4.6 214 3,043
PL001/2004)4
Mamba CBM
Karoo Basin (Lower Morupule coal)
100% -
Botswana (PL238/2014- 0.01 15.5 175 n/a n/a n/a
PL241/2014)
PL003/2004,
Karoo Basin
Botswana
PL035/2000, 100% - - - - - - 8,596 6
PL037/2000
Notes:
Gas Resource numbers have been rounded to the nearest tenth for amounts less than 100 BCF, otherwise to the nearest whole number. Refer to Competent Persons Statement in the disclaimer slide of this presentation.
1) Tlou’s Gas Reserves have not been adjusted for fuel or shrinkage and have been calculated at the wellhead (which is the reference point for the purposes of Listing Rule 5.26.5).
2) Contingent Gas Resources are (100%) Unrisked Gross and are derived from the SRK certification at 31 March 2015 for all coal seams (as previously announced by Tlou on 9 April 2015) with adjustment for the gas volumes which have now
been certified by SRK in the Gas Reserves category.
3) ASX Listing Rule 5.28.2 Statement relating to Prospective Resources:
The estimated quantities of petroleum gas that may potentially be recovered by the application of a future development project(s) relate to undiscovered accumulations. These estimates have both an associated risk of discovery and a risk of
development. Further exploration appraisal and evaluation is required to determine the existence of a significant quantity of potentially moveable hydrocarbons.
4) The Gas Reserves and Contingent Gas Resources for all coal seams in PL001/2004 and ML 2018/18L shown in the table above includes the numbers for the Lower Morupule coal seam which are shown in the first row of the table.
5) The most recent Reserves assessment by SRK did not include a review and assessment of additional Contingent Resources in the Lesedi Project Area or Contingent Resources in the Mamba Project area.
6) Prospective Gas Resources are (100%) Unrisked Gross and are derived from a report to Tlou from Netherland, Sewell and Associates Inc (NSAI) dated 16th February 2012 regarding certification for all coal seams located in the remaining
prospecting licences (as previously announced by Tlou in its prospectus dated 20 February 2013).Drilling Rig
PPA Negotiations Downstream EIA Core-hole drilling
acquisition*
Pilot Well Drilling Seismic Surveys* Expanded Reserves Project Development*
* Subject to funding.Independently Certified Gas Reserves &
Contingent Resources
Huge Supportive Low cost Significant High Impact drill
market government drilling CBM experience program set to
commence
Aiming to provide power for Botswana and
Southern AfricaThankyou Q2 2018
You can also read