Airline Industry Economics - Brian Roth-Regional Sales Director Pacific Northwest
←
→
Page content transcription
If your browser does not render page correctly, please read the page content below
Airline Industry Economics

Brian Roth- Regional Sales Director
Pacific Northwest
Airline Industry Economics

      Current Trends in Aviation Industry

      Economic Factors

      How does this translate to your travelers and budgets

      When is the best time to buy a ticket?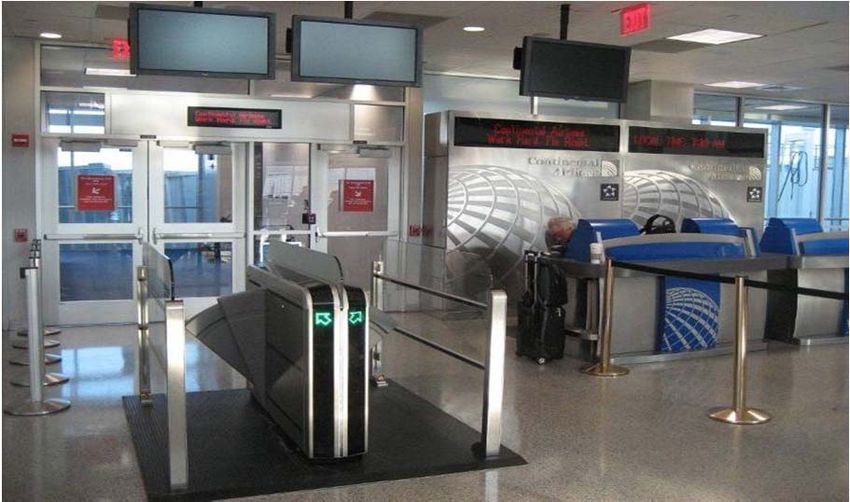
Consolidation is the ongoing trend in the industry…
 Year               Participating Airlines            Resulting Company

   2002

   2004

  Various

  Various

   2007

   2008

   2009

   2010

   2011
However, it is not a new topic

The new United is itself a culmination of mergers that began in the 1920’s…
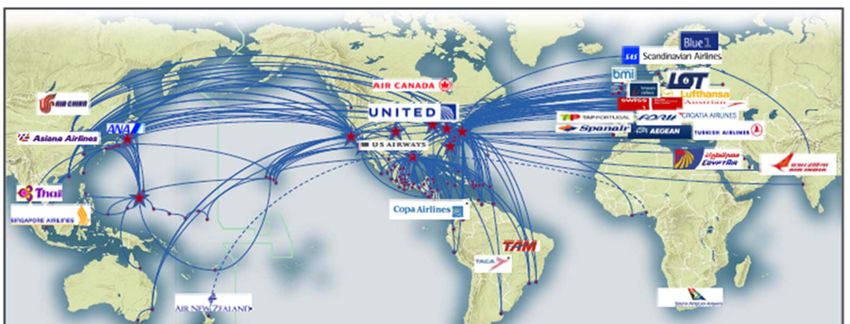
Alliances are critical for creating a truly global network

                      Members: 27                    Members: 14                    Members: 11
                      Daily Departures: 21,230       Daily Departures: 14,128       Daily Departures: 8,171
                      Airports: 1,185                Airports: 916                  Airports: 730
                      Countries: 185                 Countries: 169                 Countries: 141

               Future members: 4                 Future members: 5              Future members: 2

* Based on September 2011
Global capacity share by alliance

  Over 50% of worldwide capacity is now operated by alliance participants
The Evolution of Alliances and Joint Ventures

                                               Star Alliance

                              Bilateral          Enhanced                 Joint
         Interline
                              Alliance          Cooperation              Venture

                        • Connectivity     • Schedule Alignment   • JV Agreement /
    • Ticketing &                          • Aligned Airport      (Financial/Governance)
                        • Code Share
    Baggage Agreement                      Products               • Network Optimization
                        • Reciprocal FFP
                                           • Enhanced             • Pricing
                        • Sales Activity   Marketing/FFP
                                                                  • Sales without
                                           • Sales Relationship   preference
                                                                  • Multi‐Brand
    Industry             Alliance          Alliance
                                           Relationship           • Common Airport
    Relationship         Relationship
                                                                  Policies
                         Code share        Code Share
                         Contract          Contract
                                           Anti‐Trust
                                           Immunity
We are Striving for Seamless Service

            Network                 Products           Travel Services
  Size and Reach          Sales Product          Common Airport Facilities
                          Fare Products          Seamlessness
                          Recognition Programs   Move Under One Roof
                                                 Better Communication
The Airline Industry is a tough business with narrow margins

                                                                                 Net Profit
      • The entire global airline                                                Airline Industry 2011 Expected Profit Margin vs. Select 2010 Company Profit Margin

           industry is expected to post
                                                                                   35.0%
           profits of $6.9 billion for full
                                                                                                                                                                                    31.0%
                                                                                                                                                                         30.0%
           year 2011, a 62% drop from                                              30.0%

           2010
                                                                                   25.0%

                                                                                   20.0%
                                                                                                                                                                17.7%
      • This equates to an average
                                                                                                                                                16.0%
           profit margin of 1.2%, or about                                         15.0%

           a penny of profit for every
                                                                                   10.0%
           dollar earned                                                                                                         8.0%

                                                                                                                 5.0%
                                                                                    5.0%

                                                                                                 1.2%

      • United reported $1.3 B for                                                  0.0%
                                                                                                Airline      Volkswagen           GE             UBS            HSBC    Microsoft   Nestle
                                                                                               Industry
           2012

                                                                                 Profit         $6.9            $9.0            $11.6            $7.2           $14.1    $18.7      $32.8

                                                                                 * USD Billions

* Individual Corporate Annual Reports (USD converted at IRS recommended rates)
Refining costs are rising at an even faster rate than the price of oil

 Brent Crude Spot Price                                       3-2-1 Crack Spread Fluctuations
 $ US                                                         $ US

$130                                                         $45

                                                             $40
$120
                                                             $35
$110
                                                             $30
$100                                                         $25

 $90                                                         $20

                                                             $15
 $80
                                                             $10
                                             Brent
 $70
                                                              $5
 $60                                                          $0

 • The price per barrel of Brent Crude has risen 56% September year over year

 • Crack spreads have been increasing at an even faster rate than underlying oil prices (300% vs. 30% YoY
   respectively), resulting in wider profit margins for oil refiners
Industry economics are dictated by the price of fuel
Price per Gallon of Jet Fuel
USD, US Energy Information Administration
$3.50
$3.00
$2.50
$2.00
$1.50
$1.00
$0.50
$0.00
• The price of Jet Fuel has doubled since January 2009
• Today fuel accounts for ~30% of total airline expense compared to just 13% of total costs in 2001
• For each dollar increase in the average annual oil price, airlines face an additional $1.6 billion in costs
“We have built enormous efficiencies over the last decade. In 2001, we needed oil below $25 per
barrel to be profitable. Today, we are looking at a small profit with oil at $110 per barrel”
- Giovanni Bisignani, IATA CEOFuel cost from a passenger’s perspective
Washington DC to Dubai, UAE Average Fuel Cost, R/T
$ US
$500 $476
$450 $427 $439
$421 $414 $411
$396
$400
$370 $368
$353 $345
$350 $341 $333 $335
$329 $325
$300
$250
$200
$150
$100
• In September, on an average round trip between Dubai and Washington DC, United spends $476 (or AED 1,748)
per PAX in fuel alone, an increase of 13% over the same month last year
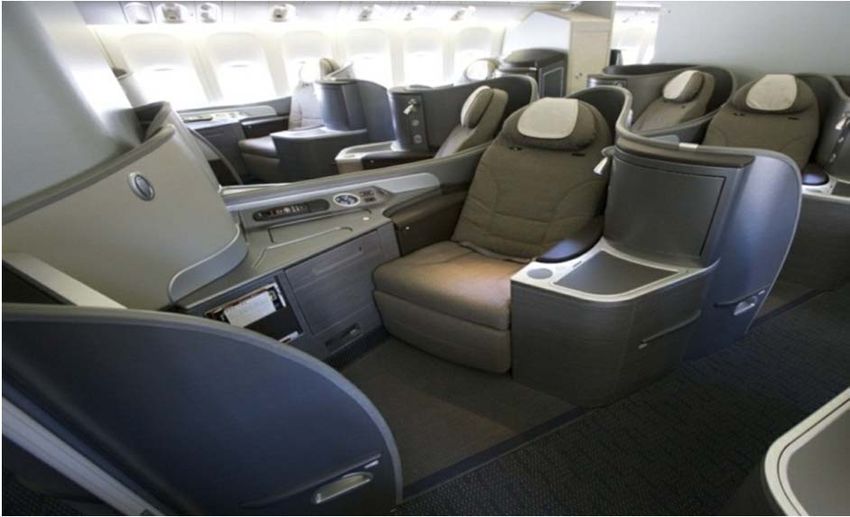
• Economy Fares range from $1,100 to $2,000 Business fares are $6,100 to $13,000.
• Fuel is the #1 cost for our airline and make up about 40% of our total cost structureFuel efficiency is good for business… and the environment
Investing in more modern aircraft and
winglets, as well as streamlined
processes regarding APU usage,
taxiing and dispatch, have resulted in
a 32% decrease in average fuel
32%
consumption since 1994
20 million
United has committed to purchasing
20 million gallons of jet fuel per year,
derived exclusively from algae oil.
13What does it take to create the world’s leading airline?
People Facilities
Product LoyaltyTravel Purchasing is complex and getting more so…. Travel is fundamentally different than other products and services purchased by companies. Due to the many choices available for each trip, and pricing that changes by the minute, ‘trips’ cannot be standardized or commoditized. The market is dynamic, companies cannot purchase trips ‘in bulk’ for their employees. Instead they have to delegate responsibility for purchasing individual trips to their traveling employees. That delegation creates a unique challenge, because travelers tend to maximize comfort and convenience, for which the market usually charges a substantial premium. As the total amount your company needs to travel can’t really be influenced by the airlines, we focus on gaining as much share of your spend as possible.
So how can we manage through this?

   The most important rule is to consolidate all travel purchases through one or
   more designated TMC’s (Travel Management Company). Without
   consolidation, you can’t manage travel and you won’t know whether your
   fares and rates are low or not.

   Consolidation provides many benefits to volume buyers of travel, including:
   • Possible negotiated discounts with preferred airlines.
   • Point-of-Sale controls that direct travelers toward cost-effective options.
   • Management reports on travel volumes, patterns, and policy compliance.
   • Identification, recapture and re-use of unused tickets.
   • Ability to locate and identify travelers in emergency

   Most airlines will require booking data that is tracked and provided by your
   TMC.

   This data includes the types of fares purchased and city-pair info for the
   preferred alliance and “all other carriers.”
So what’s fair? APM/QSI/FMS???

     Alphabet Soup or Fair Market Share-
     Companies that have negotiated discounts with airlines need to move
     ‘market share’ to these ‘preferred carriers’ in exchange for discounts or other
     amenities.

     Based on an airline’s route network, global alliance, schedule, marketplace
     presence, and loyalty program, we have a pretty good idea of our “ Fair
     Share” of your travel spend.

     The amount of share of passengers and/or revenue above Fair Share and
     the types of fares being purchased will determine the discount or amenities
     offered by airline.

     In recent GBTA Survey:

     • 61% of respondents require travelers to accept flights on preferred carriers
     whenever they are available, or when they are the lowest fare in the market.
Cost savings vs. flexibility
Non-refundable fares are less expensive – most of the
time.
Non-refundable tickets are an opportunity to reduce air travel costs
significantly, but you need to determine how much “spoilage” is acceptable.
Accepting Connections
What is value of traveler comfort and productivity vs. Cost?
Guidelines or purchasing guidelines and rules have to be reasonable to gain
buy-in from travelers and travel arrangers.
Lounge access, Wi-Fi and other improvements in airport experience can
make connections more tolerable.So when is the “Best time to buy a ticket?”
NBTA White Paper SurveyThe simple answer is not so simple…
If you know that your plans may change, or your customer may change
them for you, buy flexible ticket.
If plans are firm, buy in advance if possible. 21 Days has a significant
cost advantage over 7 or 3 Days.
The lower the fare, generally the less flexibility it has.
Non-refundable, means disposable. If you don’t use it, you lose it or at
least pay fairly steep penalties for exchange or reissue.
Recent survey of a large SLC TMC identified that 13% of tickets issued
in 4Q2011 were exchanged with average change fee of $255. Overall
average fare paid was $625 (Dom and Intl).Questions? See Kimberly Quizon Kimberly.quizon@united.com
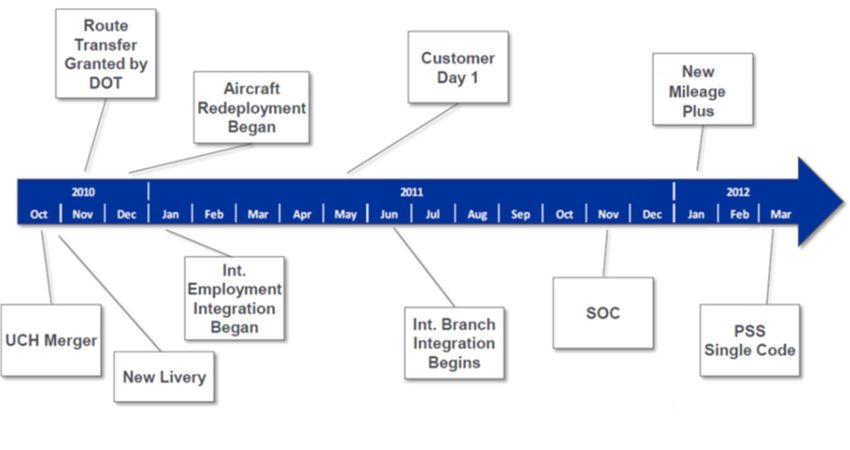
The UAL integration progress is well defined
You can also read