ALADIN laser frequency stability and its impact on the Aeolus wind error
←
→
Page content transcription
If your browser does not render page correctly, please read the page content below
Atmos. Meas. Tech., 14, 6305–6333, 2021
https://doi.org/10.5194/amt-14-6305-2021
© Author(s) 2021. This work is distributed under
the Creative Commons Attribution 4.0 License.

ALADIN laser frequency stability and its impact on
the Aeolus wind error
Oliver Lux1 , Christian Lemmerz1 , Fabian Weiler1 , Thomas Kanitz2 , Denny Wernham2 , Gonçalo Rodrigues2 ,
Andrew Hyslop3 , Olivier Lecrenier4 , Phil McGoldricka , Frédéric Fabre5 , Paolo Bravetti6 , Tommaso Parrinello7 , and
Oliver Reitebuch1
1 Institutfür Physik der Atmosphäre, Deutsches Zentrum für Luft- und Raumfahrt, 82234 Oberpfaffenhofen, Germany
2 European   Space Research and Technology Centre, European Space Agency, Noordwijk, 2201 AZ, the Netherlands
3 Vitrociset (a Leonardo company), for ESA, Noordwijk, 2201 DK, the Netherlands
4 Airbus Defence and Space (Toulouse), Rue des Cosmonautes, 31400 Toulouse, France
5 Les Myriades SAS, Consultancy for Optical Systems, 2 Rue Temponières, 31000 Toulouse, France
6 Airbus Italia S.p.A., Via dei Luxardo, 22-24, 00156 Rome, Italy
7 European Space Research Institute, European Space Agency, 00044 Frascati RM, Italy
a formerly at: Airbus Defence and Space (Stevenage), Gunnels Wood Rd, Stevenage SG1 2AS, United Kingdom

Correspondence: Oliver Lux (oliver.lux@dlr.de)

Received: 9 March 2021 – Discussion started: 11 March 2021
Revised: 7 July 2021 – Accepted: 16 August 2021 – Published: 28 September 2021

Abstract. The acquisition of atmospheric wind profiles on a          lus wind error with respect to European Centre for Medium-
global scale was realized by the launch of the Aeolus satel-         Range Weather Forecasts (ECMWF) model winds shows that
lite, carrying the unique Atmospheric LAser Doppler INstru-          the temporally degraded frequency stability of the ALADIN
ment (ALADIN), the first Doppler wind lidar in space. One            laser transmitter has only a minor influence on the wind data
major component of ALADIN is its high-power, ultravio-               quality on a global scale, which is primarily due to the small
let (UV) laser transmitter, which is based on an injection-          percentage of wind measurements for which the frequency
seeded, frequency-tripled Nd:YAG laser and fulfills a set            fluctuations are considerably enhanced. Hence, although the
of demanding requirements in terms of pulse energy, pulse            Mie wind bias is increased by 0.3 m s−1 at times when the
length, repetition rate, and spatial and spectral beam proper-       frequency stability is worse than 20 MHz, the small contribu-
ties. In particular, the frequency stability of the laser emission   tion of 4 % from all Mie wind results renders this effect in-
is an essential parameter which determines the performance           significant (< 0.1 m s−1 ) when all winds are considered. The
of the lidar instrument as the Doppler frequency shifts to be        impact on the Rayleigh wind bias is negligible even at high
detected are on the order of 108 smaller than the frequency of       frequency noise. Similar results are demonstrated for the ap-
the emitted UV light. This article reports the assessment of         parent speed of the ground returns that are measured with the
the ALADIN laser frequency stability and its influence on the        Mie and Rayleigh channel of the ALADIN receiver. Here, the
quality of the Aeolus wind data. Excellent frequency stability       application of a frequency stability threshold that filters out
with pulse-to-pulse variations of about 10 MHz (root mean            wind observations with variations larger than 20 or 10 MHz
square) is evident for over more than 2 years of operations in       improves the accuracy of the Mie and Rayleigh ground ve-
space despite the permanent occurrence of short periods with         locities by only 0.05 and 0.10 m s−1 , respectively, however at
significantly enhanced frequency noise (> 30 MHz). The lat-          the expense of useful ground data.
ter were found to coincide with specific rotation speeds of
the satellite’s reaction wheels, suggesting that the root cause
are micro-vibrations that deteriorate the laser stability on
timescales of a few tens of seconds. Analysis of the Aeo-

Published by Copernicus Publications on behalf of the European Geosciences Union.
6306                              O. Lux et al.: ALADIN laser frequency stability and its impact on the Aeolus wind error

1   Introduction                                                     tests. The laser frequency stability is a crucial parameter for
                                                                     the Aeolus mission and many Doppler wind lidar instruments
The launch of the ESA’s Aeolus mission in August 2018                in general given the fact that a wind speed of 1 m s−1 in-
was an influential event in the history of spaceborne active         troduces Doppler frequency shifts of only a few megahertz
remote sensing (Stith et al., 2018; Kanitz et al., 2019; Par-        at the operating ultraviolet (UV) wavelength of the laser.
rinello et al., 2020). Since then, the first Doppler wind li-        Hence, the frequency fluctuations have to be on the same or-
dar in space has offered the acquisition of global wind pro-         der to ensure sufficiently low wind errors. Frequency-stable
files from the ground up to the lower stratosphere, which            laser emission is also essential for other space lidar technolo-
helps to fill observation gaps in the global wind data cov-          gies that rely on high-spectral-resolution lidar (HSRL) or dif-
erage, particularly over the oceans, poles, tropics, and the         ferential absorption lidar (DIAL). These techniques will be
Southern Hemisphere (Stoffelen et al., 2020). In this man-           applied in the upcoming space missions EarthCARE (Earth
ner, the lack of wind data on a global scale, which repre-           Clouds, Aerosols and Radiation Explorer) (Illingworth et al.,
sented a major deficiency in the Global Observing System             2015), ACDL (Aerosol and Carbon Detection Lidar) (Liu
(GOS) (Baker et al., 2014; Andersson, 2018; NAS, 2018),              et al., 2019) and MERLIN (Methane Remote Sensing Lidar
was mitigated, thus contributing to the improvement of the           Mission) (Ehret et al., 2017), which are scheduled for launch
accuracy of numerical weather prediction (NWP) (Straume              within the next 5 years. However, it should be mentioned that
et al., 2020). On 9 January 2020, the operational assimilation       not all Doppler lidar and HSRL techniques require high fre-
of the Aeolus wind data started at the European Centre for           quency stability, especially if the referencing to the outgoing
Medium-Range Weather Forecasts (ECMWF), followed by                  signal is performed on a pulse-by-pulse basis (Baidar et al.,
the German, French, and British weather services (Deutscher          2018; Tucker et al., 2018; Bruneau and Pelon, 2021).
Wetterdienst, DWD; Météo France; and Met Office) in May,                In this context of frequency stability, the topic of micro-
June and December 2020, respectively. Recent assessments             vibrations and their influence on the stability of spaceborne
of the significance of the Aeolus data for NWP have demon-           lasers is highly relevant. Micro-vibrations are defined as vi-
strated a statistically positive impact, especially in the tropics   brations at frequencies greater than ≈ 1 Hz which cannot be
and at the poles, thus providing a useful contribution to the        effectively compensated for by the spacecraft attitude and
GOS (Rennie and Isaksen, 2020; Rennie et al., 2021; Mar-             orbit control system (AOCS) (Toyoshima, 2010). They are
tin et al., 2021). This was made possible by the identifica-         generated from mechanically moving devices on a satellite
tion of and correction for large systematic errors which had         and can propagate along the structural panels, thus disturbing
strongly degraded the wind data quality in the initial phase         the satellite payload and causing spacecraft pointing instabil-
of the mission (Kanitz et al., 2020; Reitebuch et al., 2020).        ity (Dennehy and Alvarez-Salazar, 2018). Current research
Firstly, dark current signal anomalies on single (“hot”) pix-        is primarily focused on the latter effect, especially with re-
els of the Aeolus detectors which had led to wind errors of          gard to optical communication (Chen et al., 2019). However,
up to 4 m s−1 were recognized and successfully accounted             micro-vibrations can also materialize as translational accel-
for by the implementation of dedicated calibration instru-           erations which disturb the optical path difference in inter-
ment modes (Weiler et al., 2021a). Secondly, biases that were        ferometers and highly sensitive accelerometers in gravimetry
found to be closely correlated with small variations in the          missions. The detrimental impact of micro-vibrations on the
temperature distribution across the primary telescope mirror         frequency stability performance of space lidar instruments
(Rennie and Isaksen, 2020; Weiler et al., 2021b) were cor-           has not been investigated in detail so far. With regard to Ae-
rected.                                                              olus the main susceptibility to micro-vibrations is related to
   Apart from these two major issues, the performance of Ae-         the alteration of the laser cavity length, which leads to fre-
olus and particularly the precision of the Rayleigh wind re-         quency fluctuations in the emitted light. For other space li-
sults are impaired by the lower-than-expected atmospheric            dar missions – like ICESat, employing the Geoscience Laser
return signal levels, which deviated from end-to-end simula-         Altimeter System (GLAS) (Abshire et al., 2005); ICESat-2,
tions by a factor of 2.0 to 2.5 already shortly after launch (Re-    which operates the Advanced Topographic Laser Altimeter
itebuch et al., 2020). The situation was aggravated by a pro-        System (ATLAS) (Martino et al., 2019); or CALIPSO, de-
gressive decrease in emit energy of the laser transmitter dur-       ploying the Cloud–Aerosol Lidar with Orthogonal Polariza-
ing the first year of operation. Consequently, a switchover to       tion (CALIOP) (Winker et al., 2006), the requirements in
the redundant laser onboard Aeolus was performed in sum-             terms of the laser spectral properties are less stringent than
mer of 2019. The second laser showed higher emit energy at           for Aeolus, and, hence, micro-vibrations play only a minor
a significantly lower decrease rate (Lux et al., 2020a) so that      role for the stability of the laser. Regarding the Gravity Re-
as of September 2021 it provides more than 70 mJ of pulse            covery and Climate Experiment (GRACE) follow-on mis-
energy.                                                              sion, the sensitivity of the laser ranging interferometer in-
   A common characteristic of both lasers is the occurrence          strument at frequencies greater than 0.2 Hz is limited by the
of periods with significantly increased frequency fluctuations       frequency stability of the laser which was assessed by ground
that were not observed in the same manner during on-ground           tests prior to the launch in 2018 (Abich et al., 2019). Pre-

Atmos. Meas. Tech., 14, 6305–6333, 2021                                               https://doi.org/10.5194/amt-14-6305-2021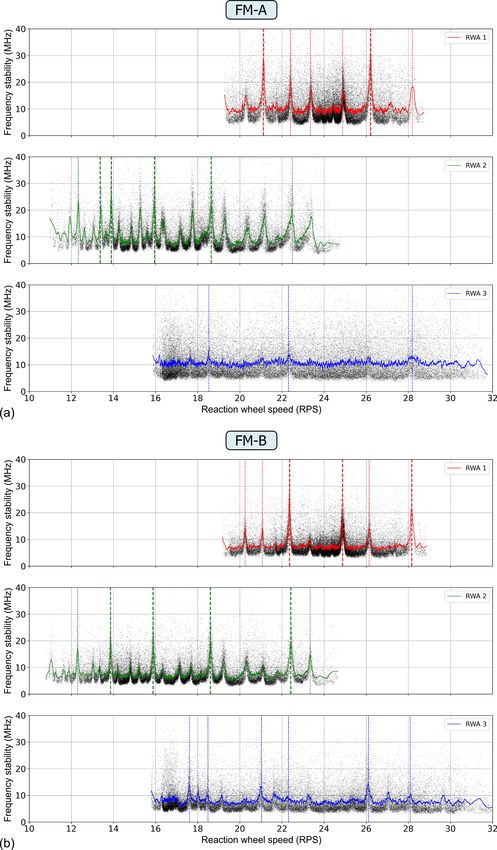
O. Lux et al.: ALADIN laser frequency stability and its impact on the Aeolus wind error                                     6307

cise quantification of the frequency stability is a challeng-       backscatter from clouds and aerosols (ESA, 2008; Stoffe-
ing task and only possible for Aeolus thanks to its unprece-        len et al., 2005; Reitebuch, 2012; Reitebuch et al., 2018). A
dented spectrometers that enable assessment of this param-          schematic diagram of the instrument is illustrated in Fig. 1.
eter in orbit. For these reasons, literature on laser frequency        A flip-flop mechanism provides the ability to switch be-
stability of space lasers and its impact on the data quality of     tween the two fully redundant laser transmitters, referred to
the retrieved products is rather scarce and more related to the     as flight models A and B (FM-A, FM-B). Both lasers are
preparation of future space missions (Hovis et al., 2008).          realized as diode-pumped Nd:YAG lasers in a master oscilla-
   This research article aims to provide a comprehensive            tor power amplifier configuration that are frequency-tripled
overview of the frequency stability of the Aeolus laser trans-      to 354.8 nm emission wavelength (ESA, 2008; Cosentino et
mitters and to explore its influence on the quality of the Ae-      al., 2012, 2017; Lux et al., 2020a). A nonplanar Nd:YAG
olus wind data. After a short description of the ALADIN in-         ring laser, frequency-locked to an ultra-low-expansion cav-
strument and measurement principle (Sect. 2.1), the results         ity, provides narrowband seed radiation that is fiber-coupled
from on-ground tests of the laser spectral properties are re-       into the folded cavity of the 80 cm long Q-switched master
capitulated (Sect. 2.2). In Sect. 2.3, the utilization of the Mie   oscillator (MO). The MO cavity length is actively controlled
receiver channel for the assessment of the laser frequency          by means of a piezo actuator in order to find the optimal con-
stability is explained, followed by an introduction of the peri-    dition for single longitudinal mode operation for each laser
ods that were analyzed for the present study (Sect. 2.4). Sec-      pulse (Cosentino et al., 2017). The cavity control scheme
tion 3 comprises the results of the analysis, starting with a       is based on the ramp-hold-fire technique (Henderson et al.,
presentation of the ALADIN laser frequency stability over           1986), which involves the detection of cavity resonances of
1 selected week of the mission (Sect. 3.1). Section 3.2 then        the injected seed radiation while sweeping the cavity length
elaborates on the correlation of this parameter with the ge-        and firing the Q-switch at the detected resonance position of
olocation of the satellite, leading to the detrimental influence    the piezo actuator. The actual implementation of this tech-
of the reaction wheels on the spectral characteristics of the       nique in the ALADIN MO is capable of achieving a cavity
laser (Sect. 3.3) and the identification of micro-vibrations as     control length of better than a few nanometers. However, it
the most likely root cause (Sect. 3.4). The fourth section ad-      has the drawback of a delay in the millisecond regime be-
dresses the question of to what extent the Aeolus data quality      tween the detection of the cavity resonance and the laser
is diminished by the temporally increased frequency noise.          pulse emission (Trespiti et al., 2017).
After a short assessment regarding the number of affected              The infrared (IR) single longitudinal mode output pulses
data in different phases of the mission, the impact of the de-      from the MO (energy: 5 to 10 mJ; full width at half max-
graded frequency stability on the accuracy and precision of         imum (FWHM) pulse duration: 20 ns; pulse repetition fre-
the wind results (Sect. 4.1) as well as on the ground velocities    quency: 50.5 Hz) are amplified in a double-pass pre-amplifier
(Sect. 4.2) is evaluated. Finally, a summary and conclusion of      and subsequent single-pass power amplifier, which are each
the study are provided in Sect. 5 together with an outlook on       realized by side-pumped and conductively cooled Nd:YAG
possible improvements in future space lidar missions.               zigzag slabs. The amplification stage boosts the energy of the
                                                                    IR pulses to more than 250 mJ, before they are guided to the
                                                                    harmonic generation stage of the laser. The latter comprises a
2     Methods and datasets                                          set of nonlinear lithium triborate (LBO) crystals to generate
                                                                    UV output pulses with a conversion efficiency of about 25 %,
This section provides a brief description of the ALADIN in-         resulting in an in-flight emit energy in excess of 60 mJ.
strument and its operating principle. After summarizing the            The UV beam from one of the two switchable laser trans-
results from on-ground tests of the laser frequency stabil-         mitters is then directed to the telescope, which is used in
ity, the approach to assess the frequency stability in orbit        a monostatic configuration; i.e., signal emission and recep-
by using the Mie channel is explained. Afterwards, the pe-          tion are realized via the same primary and secondary mir-
riods of the Aeolus mission that were selected for analysis         ror. A small portion (0.5 %) of the beam is separated at a
are presented in the context of the overall performance of the      beam splitter (BS) within the TRO configuration and, after
ALADIN laser transmitters over the course of the 2 years af-        being attenuated, guided to the instrument field stop (FS)
ter launch in 2018.                                                 and receiver channels. This portion is referred to as the in-
                                                                    ternal reference path (INT) signal and serves the determina-
2.1    ALADIN configuration and measurement principle               tion of the frequency of the outgoing beam as well as the
                                                                    calibration of the frequency-dependent transmission of the
The direct-detection Doppler wind lidar ALADIN onboard              receiver spectrometers. The INT signal is thus essential for
Aeolus is composed of a pulsed, frequency-stabilized UV             the wind measurement principle of ALADIN, which relies
laser transmitter, transmit–receive optics (TRO), a 1.5 m di-       on detecting frequency differences between the emitted laser
ameter Cassegrain-type telescope, and a dual-channel re-            pulses and those backscattered from the atmospheric parti-
ceiver which is sensitive to both molecular and particle            cles and molecules moving with the ambient wind. The fre-

https://doi.org/10.5194/amt-14-6305-2021                                             Atmos. Meas. Tech., 14, 6305–6333, 2021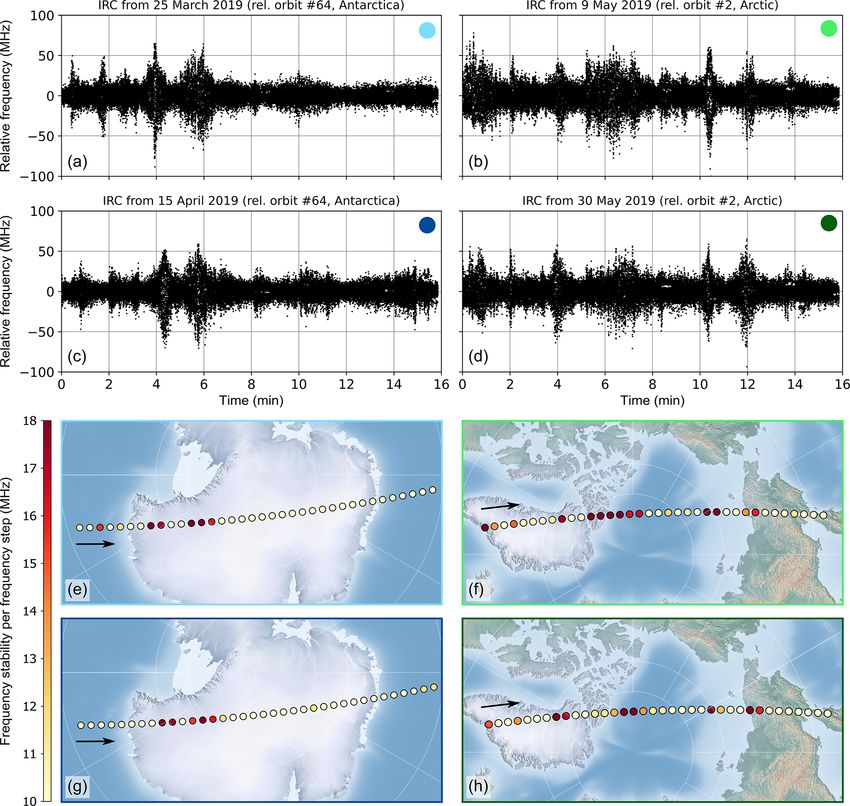
6308                              O. Lux et al.: ALADIN laser frequency stability and its impact on the Aeolus wind error

Figure 1. Schematic of the direct-detection Doppler wind lidar ALADIN on board Aeolus. The instrument consists of two fully redundant,
switchable UV laser transmitters (FM-A, FM-B), a Cassegrain telescope, transmit–receive optics (TRO) and a dual-channel receiver. The
latter is composed of a Fizeau interferometer and sequential Fabry–Pérot interferometers for analyzing the Doppler frequency shift from
particulate and molecular backscatter signals, respectively. HR: highly reflective mirror; FFM: flip-flop mechanism; BS: beam splitter;
PBS: polarizing beam splitter; HWP: half-wave plate; QWP: quarter-wave plate; IF: interference filter; LT: light trap; LCM: laser chopper
mechanism; FS: field stop; ACCD: accumulation charge coupled device. Numbers indicate the sequential light path in the receiver.

Atmos. Meas. Tech., 14, 6305–6333, 2021                                                  https://doi.org/10.5194/amt-14-6305-2021
O. Lux et al.: ALADIN laser frequency stability and its impact on the Aeolus wind error                                      6309

quency shift 1fDoppler in the backscattered signal that is in-    frequency shift of 5.63 MHz (at f0 = 844.75 THz; all subse-
troduced by virtue of the Doppler effect is proportional to the   quent frequency stability values given at this UV frequency).
wind speed vLOS along the laser beam line of sight (LOS)          Therefore, in order to measure wind speeds with an accuracy
according to 1fDoppler = 2f0 vLOS /c, where c is the speed        of 1 m s−1 , the required relative accuracy of the frequency
of light, and f0 is the frequency of the emitted light. The       measurement is on the order of 10−8 , which poses stringent
atmospheric return signal collected by the telescope enters       requirements on the frequency stability of the laser trans-
the TRO, where it passes through a laser chopper mecha-           mitter. This is especially true as the atmospheric backscat-
nism (LCM) before being spatially overlapped with the INT         ter from multiple outgoing laser pulses are accumulated on
beam by another beam splitter. Due to the long travel time of     the ACCD prior to digitization and data downlink. This im-
the atmospheric return of a few milliseconds, the detection is    plies that a pulse-to-pulse normalization of the return signal
temporally separated from the INT signal.                         frequency with the internal reference frequency is not possi-
   The ALADIN receiver consists of two complemen-                 ble. Instead, the determined frequency of the pulses averaged
tary channels which individually derive the Doppler fre-          over one measurement is affected by inhomogeneous cirrus
quency shift from the narrowband (FWHM ≈ 50 MHz) Mie              or broken clouds as only a subset of the 18 pulses may be
backscatter from particles like clouds and aerosols on the one    detected in the atmospheric path. As a result, large frequency
hand and from the broadband (FWHM ≈ 3.8 GHz at 355 nm             variations on the measurement level (over periods of 0.4 s)
and 293 K) Rayleigh–Brillouin backscatter from molecules          in combination with atmospheric inhomogeneities result in
on the other hand. The Mie channel is realized by a Fizeau        significant wind errors that are then vertically correlated be-
interferometer and relies on the fringe-imaging technique         low the (cloud) bin that filters out some of the emitted pulses
(McKay, 2002), where a linear interference pattern (fringe)       (Marksteiner et al., 2015). The same holds true for ground
is vertically imaged onto the detector. The spatial location      return signals from pulses within one measurement that are
of the fringe changes approximately linearly with frequency       reflected off a surface with varying albedo so that the differ-
of the incident light so that a Doppler frequency shift man-      ent weighting of the return signals in the accumulation of the
ifests as a spatial displacement of the fringe centroid po-       pulses results in an error in the determined ground velocity.
sition. Derivation of the Doppler shift from the broadband
Rayleigh–Brillouin backscatter spectrum is achieved by two
                                                                  2.2   On-ground assessment of the laser frequency
sequential Fabry–Pérot interferometers (FPIs) that are uti-
                                                                        stability
lized for applying the double-edge technique (Chanin et al.,
1989; Garnier and Chanin, 1992; Flesia and Korb, 1999).
The two FPIs act as bandpass filters with adequate width and      Measurement of the ALADIN laser absolute frequency and
spacing that are symmetrically placed around the frequency        its temporal stability was done during pre-flight tests under
of the emitted laser pulse. Measurement of the contrast be-       vacuum conditions by means of an external wavelength me-
tween the signals transmitted through the two filters allows      ter (High Finesse WSU10) that was calibrated using a he-
for accurately determining the frequency shift between the        lium neon laser (Mondin and Bravetti, 2017). The experi-
emitted and backscattered laser pulse.                            mental setup was provided by the German Aerospace Cen-
   The Mie and Rayleigh signals are finally detected by two       ter (DLR) and represents an integral part of the diagnostics
accumulation charge-coupled devices (ACCDs) with an ar-           for determining the spectral properties of the ALADIN Air-
ray size of 16 pixels × 16 pixels in the imaging zone of the      borne Demonstrator (A2D) (Lemmerz et al., 2017). Using it
ACCD. The electronic charges of all 16 rows in the image          for characterization of the ALADIN laser, it was found that
zone are then binned together to one row. For the wind pro-       the laser frequency stability was well within the specification
file, this row is transferred to a memory zone. The latter can    requirement, which states that the root mean square (RMS)
store 25 rows, each representing one vertical range gate of the   variation in the frequency stability over 14 s should be below
measured wind profile. It is important to note that the atmo-     7 MHz. The 14 s time period was chosen to ensure an ade-
spheric signals from 18 successive laser pulses are accumu-       quate signal-to-noise ratio (SNR) over one Aeolus observa-
lated already on board the spacecraft to so-called “measure-      tion (12 s). In addition, sensitivity tests with a thermal cycle
ments” (duration 0.4 s). Since February 2019, P = 19 laser        of ±0.2 ◦ C were carried out for about 4 h: one at ambient
pulses are emitted per measurement interval, from which one       temperature, one with the laser interface at +35 ◦ C and two
is lost due to the readout of the ACCD (P − 1 setting). Post-     at −2.5 ◦ C. For all four thermal cycles, the absolute laser fre-
processing on the ground can sum the signals from 30 mea-         quency varied by less than 25 MHz (peak to peak), demon-
surements, i.e., 540 laser pulses, and form one “observation”     strating a good stability also over medium timescales as ther-
(duration 12 s). In contrast to the atmospheric return, the INT   mal variations over 1 week in orbit were expected to be even
signal is acquired for each single pulse and stored directly as   below 0.2 ◦ C. However, the test also revealed that operation
one row in the memory zone.                                       in a vibrational environment, in this case introduced by vac-
   According to the above equation for the Doppler fre-           uum pumps and a chiller, led to a degraded laser frequency
quency shift, a LOS wind speed of 1 m s−1 translates to a         stability with pulse-to-pulse fluctuations above 30 MHz RMS

https://doi.org/10.5194/amt-14-6305-2021                                            Atmos. Meas. Tech., 14, 6305–6333, 2021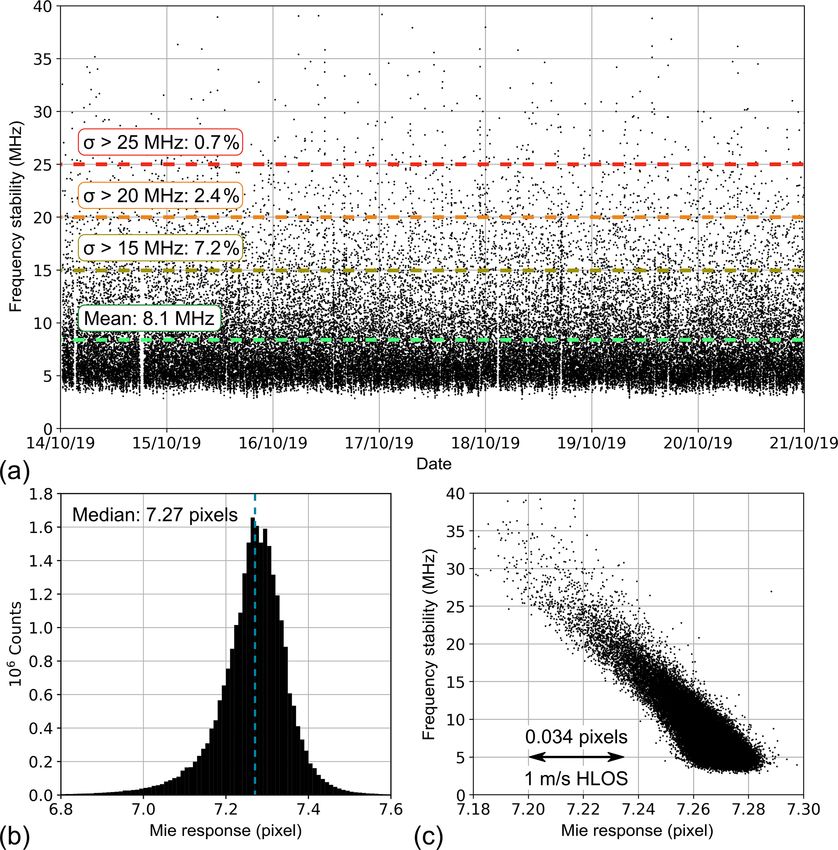
6310                             O. Lux et al.: ALADIN laser frequency stability and its impact on the Aeolus wind error

(Mondin and Bravetti, 2017). Further pre-flight test results
are discussed in the context of micro-vibrations in Sect. 3.4.

2.3    Utilization of the Mie channel as a wavelength
       meter in orbit

An external wavelength meter is not available in space. How-
ever, the spectrometer data gained from the Fizeau interfer-
ometer of the Mie channel can be exploited for deriving the
spectral properties of the narrowband laser emission. For this
purpose, the INT signal that is usually analyzed after accu-
mulation of multiple pulses on the measurement level and
contained in the L1A Aeolus data product (Reitebuch et al.,
2018) is evaluated for each individual pulse. As stated above,    Figure 2. Internal reference path Mie signal for one laser pulse
the Mie channel response is represented by the centroid po-       (24 November 2020, 0:23:47 UTC). After vertical integration of im-
sition of the fringe that is imaged onto the Mie detector and     aged fringe on the Mie ACCD (see also Fig. 1), the signal is dis-
then integrated over the 16 lines of the ACCD. Figure 2           tributed over 16 pixels (blue bars). A Nelder–Mead downhill sim-
shows the vertically summed ACCD counts over the 16 hor-          plex algorithm is applied to determine the centroid position from a
izontal pixels for one laser pulse. The fringe centroid posi-     Lorentzian line shape fit (dark-blue line).
tion is calculated by a Nelder–Mead downhill simplex algo-
rithm (Nelder and Mead, 1965) to optimize a Lorentzian line
shape fit of the signal distribution (Reitebuch et al., 2018).    information on the operated laser transmitter as well as on
In this manner, the Mie response is derived with high accu-       the MO output energy (IR), the laser emit energy (UV) and
racy. Conversion of the Mie response into relative laser fre-     the laser frequency stability, which is discussed later in the
quency is based on dedicated in-flight calibrations of the Mie    text. The energy values represent the respective mean val-
channel from which a sensitivity of ≈100 MHz per pixel was        ues and standard deviations from laser internal photodiode
determined. The accuracy of the “inherent wavemeter” on           readings. It should be noted that the IR energy reported by
board Aeolus is estimated to be 1 MHz. It is mainly limited       the MO photodiode of the FM-A is considered inaccurate.
by the shot-noise-limited signal-to-noise ratio (SNR) of the      Here, Q-switch discharges influence the energy monitoring
Mie signal and the FWHM of the Fizeau interference fringe         as they result in IR radiation with the wrong polarization that
(≈ 1.3 pixels). This could be demonstrated with A2D labo-         is circulating in the MO. This light is partially incident on the
ratory measurements comparing the spectrometer response           MO photodiode, thus corrupting the energy measurement. As
from the ALADIN pre-development model Fizeau interfer-            can be seen from the table, the UV emit energy of FM-A
ometer and parallel wavemeter measurements using the A2D          decreased significantly between December 2018 and May
UV laser (Lux et al., 2019). Hence, frequency fluctuations in     2019. The degradation of the laser performance was traced
the internal path signal can be measured as variations in the     back to a progressive misalignment of the MO (Lux et al.,
calculated Mie response on a pulse-to-pulse basis, which al-      2020a) and led to the decision to switch to the second laser
lows for assessing the frequency stability of the Aeolus laser    FM-B. This was necessary to ensure a sufficient SNR of the
transmitter over short- and long-term timescales.                 backscatter return and thus a low random error in the wind
                                                                  observations. The FM-B not only delivered a higher initial
2.4    Analyzed periods of in-orbit Aeolus datasets               energy after switch-on in late June 2019 (67 mJ compared
                                                                  to 65 mJ after FM-A switch-on) but also has been showing
The laser frequency stability was analyzed for different pe-      a much slower power degradation. After an initial drop by
riods of the Aeolus mission. Since the satellite is circling      6 mJ between July 2019 and October 2019, the UV emit en-
around the Earth with an orbit repeat cycle of 1 week, it was     ergy has decreased by less than 0.08 mJ per week. Thanks to
decided to study the performance over selected 7 d periods.       an optimization of the laser cold-plate temperatures in March
This approach was also motivated by the observed correla-         2020, which increased the UV energy by about 4 mJ, the en-
tion between the frequency stability and the satellite’s geolo-   ergy has remained above 60 mJ as of the writing of this pa-
cation (see Sect. 3.2). After 1 week the maximum coverage         per. Despite the better overall performance compared to the
of the globe is reached, and the operation timeline, particu-     FM-A, the FM-B behavior was observed to be more affected
larly the attitude control sequence of the platform, approx-      by orbital and seasonal temperature variations in the satellite
imately repeats. In total, 5 weeks between December 2018,         platform that were transferred to the laser optical bench. As
when the mission was still in the commissioning phase after       a consequence, laser anomalies associated with larger energy
its launch on 22 August 2018, and October 2020 were cho-          variations of about ±1 mJ occurred on both shorter- (hours)
sen for investigation, as listed in Table 1. The table contains   and longer-term timescales (weeks to months).

Atmos. Meas. Tech., 14, 6305–6333, 2021                                             https://doi.org/10.5194/amt-14-6305-2021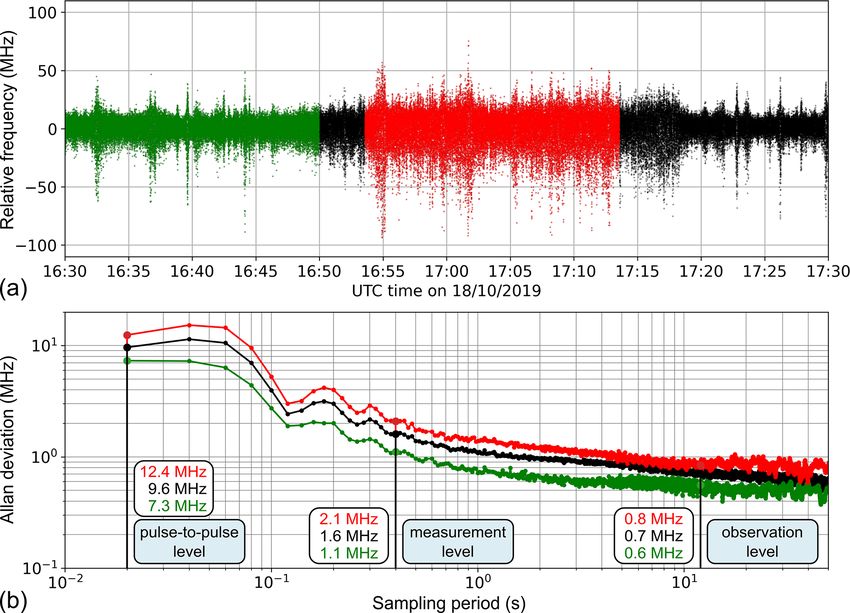
O. Lux et al.: ALADIN laser frequency stability and its impact on the Aeolus wind error                                             6311

Table 1. Overview of the periods that were studied in terms of the laser frequency stability. The active laser transmitter operated in the
respective period (FM-A or FM-B) and the corresponding master oscillator IR output energy and UV emit energy (as reported by the laser
internal photodiodes) are provided. Note that the reading of the MO photodiode for FM-A is considered inaccurate (see text). The frequency
stability is given as the mean of the standard deviations from all wind observations of the respective week.

                      Period                         Laser           MO energy          UV emit           Frequency
                                                     transmitter                        energy            stability
                      17 Dec 2018–24 Dec 2018        FM-A            (8.3 ± 0.5) mJ     (56.2 ± 0.8) mJ   7.2 MHz
                      13 May 2019–20 May 2019        FM-A            (8.9 ± 0.3) mJ     (44.2 ± 0.8) mJ   10.7 MHz
                      14 Oct 2019–21 Oct 2019        FM-B            (5.87 ± 0.03) mJ   (60.8 ± 0.8) mJ   8.1 MHz
                      17 Aug 2020–24 Aug 2020        FM-B            (5.91 ± 0.03) mJ   (61.8 ± 0.3) mJ   8.7 MHz
                      28 Sep 2020–5 Oct 2020         FM-B            (5.88 ± 0.03) mJ   (61.4 ± 0.4) mJ   8.6 MHz

   The periods listed in Table 1 are chosen such that they rep-          the Mie channel of ≈ 100 MHz per pixel, whereby the mean
resent different phases of the mission: the early FM-A phase             response value was identified as a reference frequency. An
in December 2018, when the instrument parameters had set-                important parameter is the standard deviation of the relative
tled after launch, but the degradation of the MO was already             frequency over one observation (540 pulses, 12 s), which is
ongoing; the late FM-A phase in May 2019, when the degra-                referred to as σf (N = 540) in the following. This quantity de-
dation had progressed; the early FM-B phase in October, af-              scribes the frequency stability within those periods that are
ter completed thermalization of the second laser; and later              considered for Rayleigh wind retrieval on the observation
FM-B periods in August and September/October 2020, after                 scale. The mean of the standard deviations from all obser-
optimization of the laser cold-plate temperatures. The latter            vations of the 90 min period accounts for 8.4 MHz, which
two periods were also chosen to identify the variability in the          is comparable to the performance during on-ground tests
frequency stability performance decoupled from the power                 (Sect. 2.2) and only slightly above requirements (7 MHz).
performance of the laser, which was stable in summer and                 However, it is worse than the in-flight performance of the
autumn 2020 and free of temperature-related laser anomalies              A2D (< 4 MHz RMS) during airborne operations, which is
as stated above.                                                         characterized by a very similar laser design (Lemmerz et
                                                                         al., 2017; Lux et al., 2020b) but using a more agile ramp-
                                                                         fire technique to actively control the MO cavity length. The
3     Results                                                            lower frequency stability can be ascribed to the fact that the
                                                                         time series also exhibits numerous sporadic periods at which
The frequency stability of the ALADIN laser is first pre-
                                                                         much higher frequency fluctuations occur. During these pe-
sented with one example, namely the week in October 2019,
                                                                         riods, which last from a few seconds to several minutes, the
to illustrate the main temporal characteristics of the spectral
                                                                         variations increase to more than 20 MHz, with peak-to-peak
behavior as well as the relation to the geolocation of the satel-
                                                                         variations of up to 150 MHz (see Fig. 3b). Despite the pe-
lite. This leads to the correlation of the laser frequency stabil-
                                                                         riods of increased frequency jitter, the stability of less than
ity with platform parameters, particularly the reaction wheel
                                                                         10 MHz is unrivalled by any spaceborne high-power laser
speeds, which is elaborated on subsequently. This correlation
                                                                         so far. It should also be noted that frequency variations of
is additionally analyzed for the FM-A period in May 2019 to
                                                                         3 MHz (corresponding to 1 MHz of the IR output of the MO)
allow for a comparison between the two flight model lasers.
                                                                         require a cavity length stabilization of only 3 nm within one
The section concludes with a discussion of micro-vibrations
                                                                         oscillator free spectral range of 532 nm or 180 MHz, consid-
as the root cause of the frequency noise.
                                                                         ering the 80 cm resonator length.
3.1    Frequency stability of the ALADIN laser                              It should be pointed out that, apart from laser frequency
       transmitters                                                      variations caused by cavity length changes, the measured
                                                                         Mie response can, in principle, also be altered by angular
Figure 3a depicts a typical time series of the laser frequency           variations in the laser beam incident on the Fizeau interfer-
on the pulse-to-pulse level over about one orbit that was                ometer. In order to estimate the contribution of angular vari-
measured for FM-B on 14 October 2019 between 01:27 and                   ations, a potential correlation of the Mie response with the
02:57 UTC. The plot contains the calculated Mie responses                far-field beam position was investigated. For this purpose, the
from 243 000 pulses distributed over 450 observations of 12 s            horizontal position of the two spots from the internal refer-
each. The mean Mie response is 7.25 pixels, corresponding                ence signal that are imaged onto the Rayleigh ACCD (see
to a fringe centroid position close to the center of the ACCD,           also Fig. 1) was analyzed during periods of enhanced noise.
as shown in Fig. 2. The response variations are converted into           The studies showed a small spot motion correlated with the
relative frequency fluctuations considering the sensitivity of           Mie response, which is most likely due to the influence of the

https://doi.org/10.5194/amt-14-6305-2021                                                   Atmos. Meas. Tech., 14, 6305–6333, 2021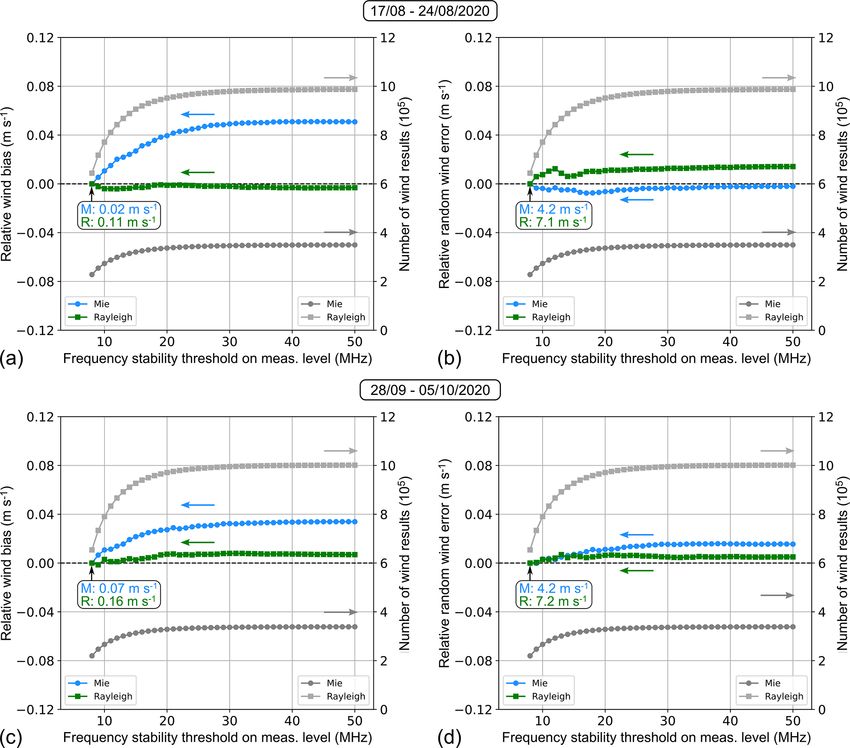
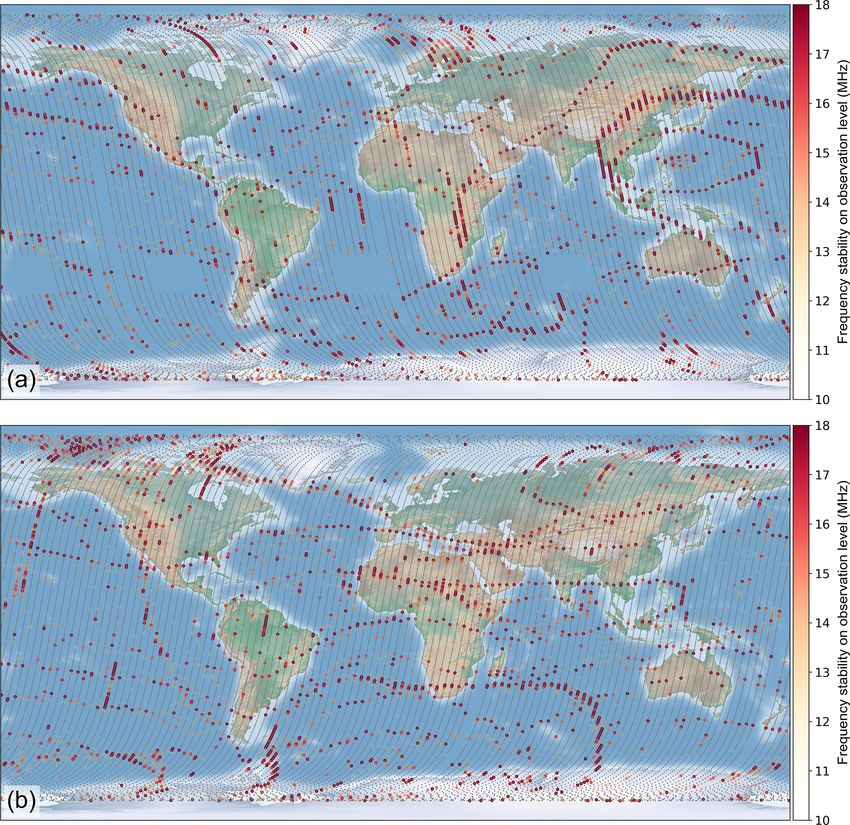
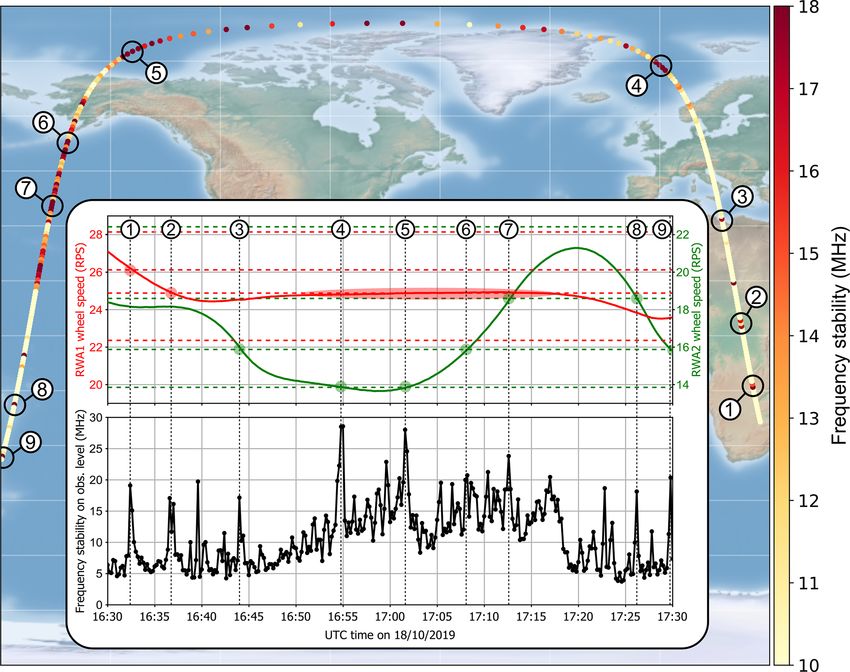
6312                               O. Lux et al.: ALADIN laser frequency stability and its impact on the Aeolus wind error

Figure 3. ALADIN laser frequency stability: (a) time series of the laser frequency fluctuations over about one orbit (14 October 2019, 01:27
to 02:57 UTC), as measured from the Mie channel of the receiver; (b) close-up of a selected period showing the frequency variations over
five observations. The given values denote σf (N = 540) as defined in the text. The standard deviations are also indicated as gray-shaded
areas.

Fizeau reflection that is promoted by the sequential configu-           (19 %) for which the frequency stability is better than 5 MHz,
ration of the two receiver channels. The change in spot posi-           i.e., comparable to the A2D laser performance.
tion was in line with the motion that was observed at times                To estimate the potential impact of the enhanced fluctua-
when the laser frequency was deliberately tuned, e.g., during           tions on the wind accuracy, the following calculation is per-
instrument calibrations. This result strongly suggested that            formed. According to the above equation for the Doppler
the contribution of angular variations to the Mie response              shift, a frequency difference of 10 MHz is introduced by a
fluctuations is negligible and that variations in the internal          LOS wind speed of about 1.8 m s−1 . Taking into account
path Mie response are largely due to changes in the laser fre-          the off-nadir angle of Aeolus of 37◦ at the location of
quency.                                                                 the measurement track, this translates to a horizontal LOS
   Analysis of the entire week from 14 to 21 October 2019 re-           (HLOS) wind speed of 1.8 m s−1 / sin(37◦ ) ≈ 3.0 m s−1 .
veals a mean frequency stability of 8.1 MHz over the 49 209             Consequently, wind errors of several meters per second are
observations, as depicted in Fig. 4a, where the standard de-            potentially caused when only a small subset of emitted pulses
viation is plotted for each observation of the regarded pe-             from one observation (with σ = 10 MHz) is backscattered
riod. Data gaps in the timeline are due to special operations           from the atmosphere or the ground and contributes to the re-
that are regularly performed in each week, such as instru-              turn signal in the wind retrieval.
ment spectral registration (ISR; Reitebuch et al., 2018), the              Interestingly, the distribution of measured Mie responses
so-called down under dark experiment (Weiler et al., 2021a)             (see Fig. 4b) indicates that the frequency fluctuations are
or orbit correction maneuvers. The figure also illustrates the          not symmetrically distributed. Instead, the frequency tends
percentage of observations that are affected by enhanced fre-           to jump to lower values (i.e., lower responses). This behav-
quency fluctuations. While the frequency stability is better            ior is also visible in Fig. 3, where the largest departures from
than 15 MHz for the vast majority of observations (about                the mean are negative. As a result, the higher the standard
93 %), it is worse than 20 MHz for 2.4 % and even worse                 deviation over one particular observation is, the larger the
than 25 MHz for almost 1 % of the observations. However,                negative shift in the respective mean from the mean over all
there are also a considerable number of observation periods             observations will be. This relationship is shown in Fig. 4c and

Atmos. Meas. Tech., 14, 6305–6333, 2021                                                    https://doi.org/10.5194/amt-14-6305-2021
O. Lux et al.: ALADIN laser frequency stability and its impact on the Aeolus wind error                                                  6313

Figure 4. (a) Time series of the laser frequency stability over 1 week from 14 to 21 October 2019, i.e., during FM-B operation. The data
points represent σf (N = 540). Data gaps are due to calibrations or orbit maintenance. The horizontal lines indicate mean over all observations
of 8.1 MHz (green) as well as thresholds to indicate the percentage of observations for which the frequency stability is worse than 15 MHz
(yellow), 20 MHz (orange) and 25 MHz (red). (b) Probability density distribution of the Mie internal reference response for the dataset in
October 2019. (c) Relationship between the laser frequency stability in terms of σf (N = 540) and the mean Mie internal reference response
per observation. A response shift by 0.034 pixels translates to a frequency shift by about 3.4 MHz, corresponding to a HLOS wind speed
change of 1 m s−1 , assuming a constant response of the atmospheric or ground return signal.

can most likely be traced back to disturbances of the active              velocity of the satellite’s reaction wheels, was not found ini-
stabilization of the MO cavity length during the periods of               tially. This was mainly due to the fact that only short time-
enhanced frequency jitter, which results in frequency jumps               lines were analyzed, typically covering only several minutes
preferentially in one direction. For instance, such jumps oc-             to hours, as shown in Fig. 3. Since the platform parameters
cur when the interference signal produced by the seed laser               vary slowly over the orbit, a relationship to the fast changes
circulating in the MO features parasitic peaks that are erro-             in the laser frequency stability within several seconds was
neously detected as MO cavity resonances. A similar behav-                considered unlikely.
ior was observed for the A2D in a highly vibrational environ-                During the first year of operation, the assessment of the
ment or in the case of imperfect alignment of the MO.                     frequency stability was then focused on the weekly instru-
                                                                          ment response calibrations (IRCs; Reitebuch et al., 2018).
3.2   Correlation with the satellite’s geolocation                        IRCs are required to determine the relationship between the
                                                                          Doppler frequency shift in the backscattered light, i.e., the
The enhanced frequency fluctuations in the laser transmitter              wind speed, and the response of the Rayleigh and Mie spec-
were detected very early in the mission and attributed to po-             trometers. The procedure involves a frequency scan over
tential vibrations introduced by the satellite platform, which            1 GHz in steps of 25 MHz to simulate well-defined Doppler
affects the MO cavity length (Lux et al., 2020a). However, a              shifts in the atmospheric backscatter within the limits of the
correlation to platform parameters, particularly the rotation

https://doi.org/10.5194/amt-14-6305-2021                                                     Atmos. Meas. Tech., 14, 6305–6333, 2021
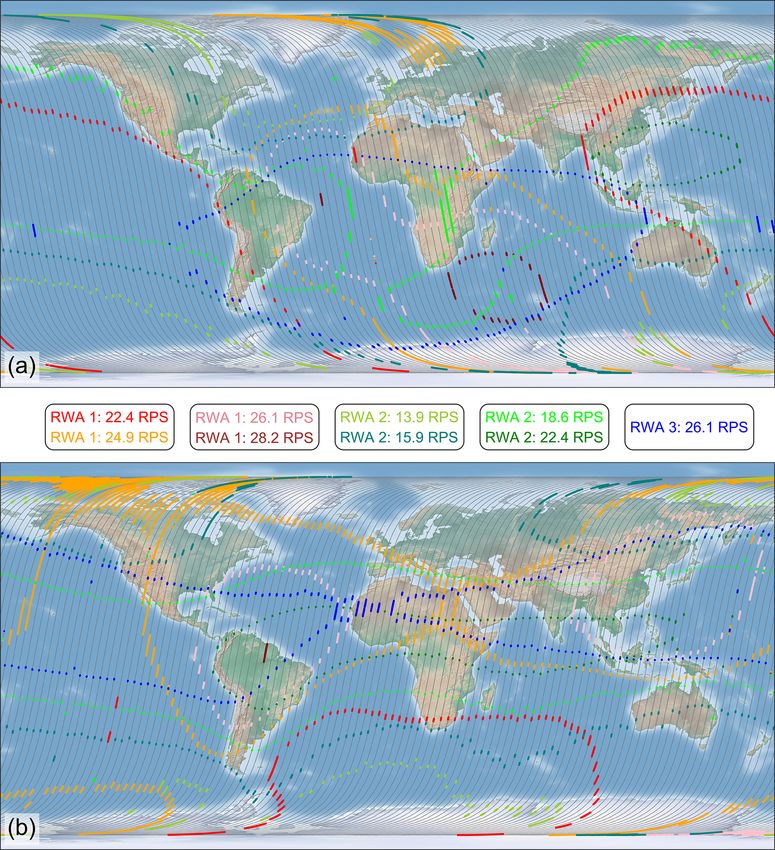
6314                             O. Lux et al.: ALADIN laser frequency stability and its impact on the Aeolus wind error

laser frequency stability. During the IRC, which takes about       satellite over the Earth’s surface. More strikingly, different
16 min (two observations (12 s) for each of the 40 frequency       linear and circular structures are evident for ascending and
steps), the contribution of (real) wind related to molecular       descending orbits, which makes clear that the frequency sta-
or particular motion along the instruments’ LOS is virtually       bility depends not only on the geolocation but also on the
eliminated by rotating the satellite by an angle of 35◦ . This     satellite’s orientation along the orbit. For ascending orbits
results in nadir pointing of the instrument and, in the case       those observations with enhanced frequency fluctuations are
of negligible vertical wind, vanishing LOS wind speed. The         accumulated in several bands wrapping around the globe,
IRCs are preferably carried out over regions with high sur-        most prominently around East Asia and the Pacific Ocean.
face albedo in the UV spectral region, e.g., over ice, to ensure   In contrast, multiple narrow latitudinal bands and a circular
strong return signals and, in turn, high SNR. This is particu-     structure over the South Atlantic and southern Indian Ocean
larly important for the Mie response calibration, which relies     are apparent for descending orbits.
on measuring the spectrometer response from the ground re-            The geolocational patterns were found to be reproducible
turn to be then used for the retrieval of atmospheric winds.       for the investigated FM-B periods with only slight variations
   The laser frequency stability was studied for each of the       (< 200 km). This is especially true for the linear and circular
60 IRCs conducted between 7 September 2018 and 9 De-               structures that are formed by neighboring orbits, i.e., with
cember 2019, most of them over Antarctica, while IRCs              large temporal distance. In contrast, continuous phases of
no. 31 to no. 43 were performed over the Arctic. Here, it          enhanced frequency noise over several observations which
was found that the frequency stability was degraded during         manifest as orange and red lines along one orbit, e.g., in
the IRCs compared to operation in nominal wind velocity            northern Canada or over northern Europe in Fig. 6a, were ev-
mode (WVM). While it was on the order of 8 to 10 MHz               ident at different geolocations for the weeks in August 2020
in WVM, the mean stability over the 16 min IRC period ac-          and September/October 2020.
counted for 12 to 14 MHz when the satellite was pointing              Similar correlation of the laser frequency stability with the
nadir, suggesting an influence of the platform attitude on         satellite position was also obvious for the periods in Decem-
the laser. This conclusion was strengthened by the circum-         ber 2018 and May 2019 when FM-A was operated. How-
stance that the laser temperatures and energies were strongly      ever, the geolocational patterns for ascending and descend-
varying during the nadir and off-nadir slews before and af-        ing orbits markedly differed from those of the FM-B periods,
ter the IRC, respectively. Moreover, these orbit maneuvers         suggesting that the mechanism introducing the enhanced fre-
involved thruster firings, which also caused increased fre-        quency noise acts differently on the two laser transmitters,
quency noise during the slews before and after the weekly          potentially due to the different locations in the payload. The
IRC, thus pointing to mechanical disturbances as the root          underlying reason for the observed dependence on geoloca-
cause. Furthermore, the frequency stability was shown to be        tion could be traced back to the reaction wheels of the satel-
significantly better over Antarctica ((11.6 ± 1.7) MHz) than       lite, as is explained in the following section.
over the Arctic ((15.2 ± 2.1) MHz), although the IRC proce-
dure was the same over both locations. Finally, it was no-         3.3   Influence of the reaction wheels
ticed that the progression of the relative laser frequency fea-
tured recurring temporal patterns for those IRCs that were         Precise three-axis attitude control of the Aeolus satellite is
carried out over the same locations in subsequent weeks.           accomplished by a set of reaction wheels (RWs) which ro-
For instance, an accumulation of periods with increased fre-       tate at different speeds, thereby causing the spacecraft to
quency jitter was observed at the beginning of the time series     counter-rotate proportionately through the conservation of
for the Antarctica IRCs, whereas numerous high-noise peri-         angular momentum. Due to external disturbances, mainly
ods, distributed over the entire procedure, were evident for       aerodynamic drag, the total angular momentum is period-
the Arctic IRCs. Figure 5 depicts the laser frequency varia-       ically modified so that magnetorquers are additionally re-
tions over selected IRC periods over the two different geolo-      quired to generate an effective external torque. Otherwise the
cations, clearly demonstrating the reproducibility of the jitter   wheel speed would gradually increase in time and reach sat-
patterns for the weekly IRCs.                                      uration (Markley and Crassidis, 2014). The attitude and orbit
   Following these observations, the laser frequency stability     control system of Aeolus additionally consists of thrusters
was studied over 1-week periods to review the influence of         which allow for larger torque to be exerted on the spacecraft.
the satellite’s geolocation (see Sect. 2.4). The performance          A sketch illustrating the orientation of the reaction wheels
from the week between 14 and 21 October 2019 (Fig. 4a),            within the spacecraft is shown in Fig. 7. The reaction wheel
based on the Mie response data from more than 27 million           assemblies (RWAs) are mounted on the spacecraft such that
laser pulses, is illustrated in Fig. 6. Each dot in the two maps   they form a tetrahedron whose axis of symmetry lies along
represents one observation, whereby the color and opacity          the +Z axis, i.e., the line-of-sight direction of the telescope.
indicate the frequency stability in terms of σf (N = 540). The     Hence, the normal vectors of the four wheels span a plane
analysis revealed that the enhanced frequency noise does not       parallel to the X–Y plane (Fig. 7b) in which the two lasers
occur randomly but is correlated with the location of the          (including the respective MO axes) are located. Each wheel

Atmos. Meas. Tech., 14, 6305–6333, 2021                                             https://doi.org/10.5194/amt-14-6305-2021
O. Lux et al.: ALADIN laser frequency stability and its impact on the Aeolus wind error                                                     6315

Figure 5. Time series of the laser frequency fluctuations over periods of selected IRCs over Antarctica (a, c) and the Arctic (b, d) together with
the corresponding geolocations of the individual frequency steps in panels (e)–(h). Each dot corresponds to one frequency step (24 s), whereby
the color coding describes the standard deviation of the relative frequency on the pulse-to-pulse level within this period (σf (N = 1080)).

is canted such that the angle between its spin axis and each               tion plots, which can also be considered to be spectra in terms
spacecraft axis is 54.74◦ . The reaction wheels were manu-                 of the wheel rotation frequency (rotations per second, RPS),
factured by Stork Product Engineering B.V. in 2005 (design                 are shown in Fig. 8. Note that the plot includes data from both
later transferred to Moog Bradford) and have a capacity of                 ascending and descending orbits and that RWA 1 and RWA 3
40 Nm s and maximum torque of 0.2 Nm. These wheels con-                    rotate counterclockwise, while RWA 2 rotates clockwise. For
sist of a rotating inertial mass driven by a brushless DC motor            the sake of better comparability of the three spectra, the ab-
(Bradford space, 2021) and supported by oil-lubricated bear-               solute wheel speeds are plotted in the figure, and the negative
ings. The wheels are all mounted on isolation suspensions to               sign for the wheel speeds of RWA 1 and RWA 3 was omitted.
reduce micro-vibrations.                                                   The six spectra exhibit pronounced peaks which demonstrate
   Based on the dataset from the week in October 2019, the                 that the laser frequency fluctuations are enhanced at specific
frequency stability on the observation level, as depicted in               rotational speeds of the reaction wheels. Thus, the latter are
Fig. 6, was correlated with the rotational speed of the three              subsequently referred to as critical wheel speeds or critical
active reaction wheels on board Aeolus (RWA 4 serves as a                  frequencies.
backup). The same procedure was performed for the FM-A                        For both periods, i.e., operated lasers, the frequency sta-
period in May 2019 (see Table 1). The resulting six correla-               bility is primarily influenced by RWA 1 and RWA 2, which

https://doi.org/10.5194/amt-14-6305-2021                                                       Atmos. Meas. Tech., 14, 6305–6333, 2021
6316                               O. Lux et al.: ALADIN laser frequency stability and its impact on the Aeolus wind error

Figure 6. Geolocation of wind observations with enhanced frequency noise for (a) ascending and (b) descending orbits. The plot contains
the data from the week between 14 October 2019 (00:00 UTC) and 21 October 2019 (00:00 UTC) (see also Fig. 4). Each dot corresponds to
one observation (12 s), whereby the color coding describes the σf (N = 540). Note that the opacity of the dots also scales with the frequency
stability so that observations with σ < 10 MHz are not visible.

show a multitude of critical wheel speeds with comparable                greater disturbing effect on one laser or another due to being
strength in their common operating range between 19 and                  located closer by.
24 RPS. In contrast, the correlation of the frequency stabil-               The center frequencies and 1/e2 widths of the strongest
ity with the speed of RWA 3 is rather poor, especially for               peaks were determined from Gaussian fits and are provided
FM-A, which can be attributed to being located farther away              in Tables 2 and 3 for FM-A and FM-B, respectively. From
from RWA 3 than FM-B. For RWA 1 and RWA 2 a stronger                     a comparison of the two tables, it can be concluded that
correlation to their nearby FM-A rather than to FM-B, lo-                the same set of critical wheel speeds appears for both
cated on the opposite side of the instrument, is not possi-              lasers, however with different relative strength. Further-
ble to demonstrate. Since the performances of FM-A and                   more, the critical frequencies are consistent among the
FM-B are compared for different periods of operation, and                three wheels. For instance, all wheels feature the same
these units showed very different behavior in terms of laser             critical frequency of around (22.4 ± 0.1) RPS. Since the
performance, degradation and susceptibility to temperature               three wheels span different speed ranges, only a subset of
variations, it is difficult to judge if one reaction wheel has a         critical speeds is identified for each wheel. By combining

Atmos. Meas. Tech., 14, 6305–6333, 2021                                                    https://doi.org/10.5194/amt-14-6305-2021
O. Lux et al.: ALADIN laser frequency stability and its impact on the Aeolus wind error                                           6317

                                                                         Table 3. Same as Table 2 but for the analyzed period between 14
                                                                         and 21 October 2019 (FM-B period).

                                                                          RWA 1                RWA 2                RWA 3
                                                                          (20.25 ± 0.09) RPS   (12.30 ± 0.07) RPS   (17.61 ± 0.10) RPS
                                                                          (21.06 ± 0.08) RPS   (13.86 ± 0.08) RPS   (18.49 ± 0.10) RPS
                                                                          (22.36 ± 0.09) RPS   (15.88 ± 0.10) RPS   (21.03 ± 0.14) RPS
                                                                          (24.88 ± 0.14) RPS   (18.60 ± 0.13) RPS   (22.31 ± 0.12) RPS
                                                                          (26.14 ± 0.12) RPS   (22.42 ± 0.15) RPS   (26.11 ± 0.11) RPS
                                                                          (28.16 ± 0.10) RPS   (23.34 ± 0.11) RPS   (28.09 ± 0.13) RPS
Figure 7. (a) Orientation of the four reaction wheels with respect to
the spacecraft body. (b) Alignment of the reaction wheel spin axes
with respect to the spacecraft body. The axes of the four wheels are     Consequently, the frequency stability was less degraded at
oriented such that |α| = |β| = |γ | = 54.74◦ .                           the critical wheel speeds, which manifests in smaller peaks
                                                                         in the spectra.
Table 2. Critical wheel speeds for the analyzed period between 13           Steering of the satellite pointing by means of the reaction
and 20 May 2019 (FM-A period), as derived from the correlation           wheel speeds involves regular and repeated patterns over the
with the frequency stability depicted in Fig. 8a. The values represent   1-week orbit repeat cycle, which differ only slightly depend-
the center frequency and 1/e2 width from Gaussian fits applied to        ing on the elapsed time since the last orbit correction maneu-
the six most pronounced peaks. The strongest peaks for each reac-        ver. The global occurrence of the most critical wheel speeds
tion wheel are indicated in bold type, while those frequencies which     during the analyzed week in October 2019 is illustrated in
are critical for both lasers are additionally printed in italics.        Fig. 9. The two maps show those observations during ascend-
                                                                         ing (panel a) and descending orbits (panel b), for which one
 RWA 1                   RWA 2                  RWA 3
                                                                         of the wheels operates at one of the critical frequencies that
 (21.12 ± 0.08) RPS      (12.33 ± 0.08) RPS                              are printed in bold type in Table 3. Comparison of the geolo-
 (22.41 ± 0.09) RPS      (13.37 ± 0.09) RPS     (18.53 ± 0.11) RPS       cational patterns with those of the laser frequency stability
 (23.35 ± 0.10) RPS      (13.90 ± 0.07) RPS                              (Fig. 6) underlines the strong correlation between the reac-
 (24.88 ± 0.13) RPS      (15.95 ± 0.08) RPS     (22.31 ± 0.10) RPS       tion wheel speeds and the laser frequency noise. For instance,
 (26.21 ± 0.10) RPS      (18.64 ± 0.12) RPS
                                                                         the manifestation of high noise along a linear structure that
 (28.19 ± 0.13) RPS      (22.49 ± 0.15) RPS     (28.19 ± 0.13) RPS
                                                                         extends from South and North America across the Pacific
                                                                         Ocean to East Asia for ascending orbits can be traced back to
                                                                         the influence of RWA 1 operating at the critical frequency of
the information obtained from all spectra, the following                 ω4 ≈ 22.4 RPS. The enhanced noise which is observed in the
seven reaction wheel speeds were identified to be most                   north polar regions, on the other hand, is primarily related
critical regarding the frequency stability of both lasers (sign          to RWA 2 rotating at a speed of ω5 ≈ 24.9 RPS. It should be
neglected): ω1 ≈ 13.9 RPS, ω2 ≈ 15.9 RPS, ω3 ≈ 18.6 RPS,                 pointed out that the sequence of operating speeds for each
ω4 ≈ 22.4 RPS,       ω5 ≈ 24.9 RPS,      ω6 ≈ 26.2 RPS      and          wheel slightly changes from week to week depending on the
ω7 ≈ 28.2 RPS. These frequencies are printed in bold                     actual orbit position of the Aeolus spacecraft. Consequently,
italics in Tables 2 and 3.                                               the areas which experience high frequency noise have been
   The variability in the center frequency of the common crit-           shifting by a few hundreds of kilometers over the course of
ical wheel speeds is on the order of 0.1 RPS, which is com-              the mission.
parable to the average width of the fitted peaks. Note that                 The occurrence of critical frequencies from different
the individual wheel speeds are known with an accuracy of                wheels along the orbit suggests that the three wheels act inde-
about 0.01 RPS. The fact that the peaks are relatively narrow            pendently on the laser. This hypothesis was confirmed by fur-
explains the rather short duration of the high-noise periods of          ther analysis, which revealed that enhanced noise is observed
several tens of seconds as the critical wheel speeds are usu-            almost every time when one of the wheels rotates at a criti-
ally passed on these timescales. Analysis of the other three             cal speed, regardless of the speed of the other two wheels.
periods listed in Table 1 yields that the center frequencies             Hence, there is no entanglement of the critical frequencies,
and widths of the peaks are constant over time for each laser.           even though the speeds of the wheels are related among each
Interestingly, the peak heights in the spectra for the early             other. Additional studies also showed that the frequency sta-
FM-A period in December 2018 are lower compared to the                   bility is not correlated with the wheel acceleration.
May 2019 period plotted in Fig. 8a. This is due to the bet-                 The impact of the reaction wheel speeds on the laser fre-
ter overall performance of FM-A, particularly the better MO              quency stability is finally demonstrated at an example scene,
alignment, at the beginning of the mission (see also Table 1)            which clearly illustrates the origination of the geolocation
so that the laser was less prone to external perturbations.              patterns. Figure 10 shows a map with the color-coded fre-

https://doi.org/10.5194/amt-14-6305-2021                                                  Atmos. Meas. Tech., 14, 6305–6333, 2021
You can also read