Alien Vision Exploring the Electromagnetic Spectrum with Imaging Technology - SECOND EDITION - SPIE Digital Library
←
→
Page content transcription
If your browser does not render page correctly, please read the page content below
Alien Vision
                                         Exploring the Electromagnetic
                                       Spectrum with Imaging Technology
                                                             SECOND EDITION

Downloaded From: https://www.spiedigitallibrary.org/ebooks/ on 16 Feb 2021
Terms of Use: https://www.spiedigitallibrary.org/terms-of-use
Downloaded From: https://www.spiedigitallibrary.org/ebooks/ on 16 Feb 2021 Terms of Use: https://www.spiedigitallibrary.org/terms-of-use
Alien Vision
Exploring the Electromagnetic
Spectrum with Imaging Technology
SECOND EDITION
Austin Richards
Bellingham, Washington USA
Downloaded From: https://www.spiedigitallibrary.org/ebooks/ on 16 Feb 2021
Terms of Use: https://www.spiedigitallibrary.org/terms-of-useLibrary of Congress Cataloging-in-Publication Data
Richards, Austin.
Alien vision : exploring the electromagnetic spectrum with imaging technology /
Austin Richards. – 2nd ed.
p. cm. – (Press monograph ; 205)
Includes bibliographical references and index.
ISBN 978-0-8194-8535-9
1. Imaging systems. 2. Electromagnetic waves. 3. Spectrum analysis. I. Title.
TK8315.R53 2011
621.36 07–dc22
2010046664
Published by
SPIE
P.O. Box 10
Bellingham, Washington 98227-0010 USA
Phone: +1 360.676.3290
Fax: +1 360.647.1445
Email: Books@spie.org
Web: http://spie.org
Copyright c 2011 Society of Photo-Optical Instrumentation Engineers (SPIE)
All rights reserved. No part of this publication may be reproduced or distributed in
any form or by any means without written permission of the publisher.
The content of this book reflects the work and thought of the author(s).
Every effort has been made to publish reliable and accurate information herein,
but the publisher is not responsible for the validity of the information or for any
outcomes resulting from reliance thereon.
Printed in the United States of America.
Cover background: “Runaway Star in the Tarantula Nebula,” courtesy of NASA,
ESA, C. Evans (Royal Observatory Edinburgh), N. Walborn (STScI), and ESO.
Downloaded From: https://www.spiedigitallibrary.org/ebooks/ on 16 Feb 2021
Terms of Use: https://www.spiedigitallibrary.org/terms-of-useContents
List of Figures .................................................................................................. vii
Preface ............................................................................................................... xv
Acknowledgments ........................................................................................... xviii
Introduction ...................................................................................................... xix
Chapter 1 Infrared and Ultraviolet: The Edges of the Rainbow ..................... 1
Near-Infrared Imaging .................................................................................... 6
Night Vision and Surveillance with Near-IR Imaging......................... 7
Exploiting the Deep Penetration of NIR and SWIR Light ................. 12
Art Conservation .............................................................................................. 16
Military Uses of SWIR Imaging ................................................................. 20
Ultraviolet Imaging ......................................................................................... 21
Animal Ultraviolet Vision ............................................................................. 28
Optical Properties of Materials in the Near-IR and Near-UV ........... 30
Atmospheric Effects in the IR and UV Wavebands ............................. 34
Infrared and Ultraviolet Light Sources ..................................................... 35
Infrared Photography and Heat Detection ............................................... 38
Chapter 2 Thermal Imaging: We All Glow in the Dark .................................... 41
Reflectivity of Materials ................................................................................ 48
Midwave and Longwave IR Imaging Systems ....................................... 48
Surveillance and Law Enforcement ........................................................... 51
Industrial Thermography ............................................................................... 53
Imaging Invisible Gases ................................................................................. 56
Test Range Radiometry .................................................................................. 56
High-Speed Thermography .......................................................................... 57
Thermal Imaging and Biology ..................................................................... 59
Thermal Imaging in Astronomy .................................................................. 63
v
Downloaded From: https://www.spiedigitallibrary.org/ebooks/ on 16 Feb 2021
Terms of Use: https://www.spiedigitallibrary.org/terms-of-usevi Contents
Chapter 3 Microwave and Millimeter-Wave Imaging: Piercing the Veil .......... 67
Sub-Millimeter-Wave Imaging: T-Rays ................................................... 69
Millimeter-Wave Imaging: Seeing Through Clothing and Fog ........ 71
Radio Astronomy: The Foundations of Radio-Wave Imaging ......... 74
Radar Imaging: A Microwave Searchlight .............................................. 79
Small-Scale Imaging Radar .......................................................................... 85
Chapter 4 X Rays and Gamma Rays: Crookes Tubes and Nuclear Light ...... 89
Gamma Rays...................................................................................................... 91
High-Energy Astronomy ............................................................................... 104
Gamma-ray Imaging ....................................................................................... 107
PET Scans: Observing Living Tissue with Gamma Rays .................. 108
Chapter 5 Acoustic Imaging: Seeing with Sound ........................................... 115
Underwater Acoustic Imaging ..................................................................... 116
Ultrasound Medical Imaging........................................................................ 120
Acoustic Daylight Imaging ........................................................................... 122
Acoustic Imaging of Sound Sources ......................................................... 124
Chapter 6 Sweeping through the Spectrum: Comparative Imagery .............. 127
Milky Way Images from Radio to Gamma Ray .................................... 132
Milky Way Image Descriptions ................................................................... 133
Epilogue ............................................................................................................ 139
Glossary ............................................................................................................ 143
Bibliography ..................................................................................................... 153
Index ................................................................................................................... 155
Downloaded From: https://www.spiedigitallibrary.org/ebooks/ on 16 Feb 2021
Terms of Use: https://www.spiedigitallibrary.org/terms-of-useList of Figures
1 Electromagnetic spectrum. . . . . . . . . . . . . . . . . . . . . . xxii
1.1 The near-UV, visible, near-IR, and SWIR wavebands. . . . . . . . 2
1.2 Sunlight split into some of its components by a prism. . . . . . . . 2
1.3 Plate from W. Herschel’s infrared paper (1800). . . . . . . . . . . 4
1.4 Block diagram of near-IR and near-UV photographic apparatus. . 6
1.5 Robert Wood in the UV band. . . . . . . . . . . . . . . . . . . . 7
1.6 M3 sniperscope, Korean War era. . . . . . . . . . . . . . . . . . . 8
1.7 The author with a working WWII-era C-3 near-IR imager. . . . . 8
1.8 Night-vision goggles with head mount. . . . . . . . . . . . . . . . 9
1.9 Near-IR image showing dark-adapted eyes. (Courtesy of Dannen
Harris) . . . . . . . . . . . . . . . . . . . . . . . . . . . . . . . 10
1.10 Three views of a factory: visible, no camouflage (top); visible,
camouflage (middle); near-IR, camouflage (bottom). (Courtesy of
Eastman Kodak, Inc.) . . . . . . . . . . . . . . . . . . . . . . . . 11
1.11 False color key to LANDSAT image of San Francisco Peninsula
(red: high reflectance at blue wavelengths; green: high reflectance
at near-infrared wavelengths; blue: high reflectance in visible
wavelengths). Built-up areas appear purple or gray, white areas are
high albedo objects, vegetation appears green because of its high
near-IR reflectance, and clear water appears black. . . . . . . . . . 12
1.12 Visible (left) and SWIR (right) images of water in a plastic cup.
(Courtesy of FLIR) . . . . . . . . . . . . . . . . . . . . . . . . . 13
1.13 (a) Visible: 400–750 nm: (b) NIR: 830–1100 nm; (c) SWIR:
1400–1700nm; (d) SWIR: 2000–2500um. (Courtesy of FLIR) . . . 14
1.14 Near UV: 365 nm (left) and shortwave UV: 254 nm (right) images
of an altered document. . . . . . . . . . . . . . . . . . . . . . . . 14
1.15 Four views of a paper label on a cardboard box: (a) visible:
400–750 nm; (b) NIR: 830–1100 nm; (c) SWIR: 1400–1700 nm;
(d) SWIR: 2000–2500 um. (Courtesy of FLIR) . . . . . . . . . . . 15
1.16 Two views of a torn paper label with printing underneath: left—
365 nm; right—254 nm. . . . . . . . . . . . . . . . . . . . . . . 15
1.17 VIS and NIR images of a cotton shirt showing a GSR
pattern. (Courtesy of Heidi Nichols, Miami-Dade County Medical
Examiner’s Office) . . . . . . . . . . . . . . . . . . . . . . . . . 16
1.18 Early 19th century headstone with staining and lichen growth:
left—VIS; right—780–1100 nm. . . . . . . . . . . . . . . . . . . 17
vii
Downloaded From: https://www.spiedigitallibrary.org/ebooks/ on 16 Feb 2021
Terms of Use: https://www.spiedigitallibrary.org/terms-of-useviii List of Figures
1.19 The author in a loud and admittedly tacky shirt made of rayon: left
—VIS; right—NIR (780–1100 nm). . . . . . . . . . . . . . . . . 17
1.20 Visible image of Natura and two details in visible and near-IR
light. (Courtesy of Editech) . . . . . . . . . . . . . . . . . . . . . 18
1.21 Visible (400–750 nm), NIR (830–1100 nm), and SWIR
(1400–1700 nm) images of a test panel with oil paint swatches
and underdrawing media. Paint swatches from left to right: burnt
umber, burnt sienna, raw sienna, and ochre. Underdrawing media
from top to bottom: silver, ivory black, lamp black, vine black,
charcoal in gum arabic. (Courtesy of FLIR and LACMA). . . . . . 19
1.22 Ruysdael painting imaged in visible (400–750 nm) [top and
bottom-left] and SWIR (1400–1700 nm) [bottom-right]. (Images
courtesy of Yosi Poseilov, Los Angeles County Museum of Art) . . 20
1.23 Mahogany veneer with well-done repair: left—VIS; right—
780–1100 nm. . . . . . . . . . . . . . . . . . . . . . . . . . . . . 21
1.24 (a) Airborne Laser Test Bed in flight; (b) SWIR aiming and
focusing optics on the nose of the ALTB; (c) SWIR image of
ALTB firing at a Scud missile—the missile is on the left side
of the image; (d) Scud missile mounted on a mobile launcher.
Figures 1.24(a)–(c) courtesy of the Missile Defense Agency. . . . 21
1.25 CD jewel case with scratches: left–visible; right–near-UV. . . . . 23
1.26 Magazine cover (top) and details imaged with visible light (bottom
left) and shortwave-UV light (bottom right). (Courtesy of Sirchie
Fingerprint Laboratory) . . . . . . . . . . . . . . . . . . . . . . 24
1.27 Visible (left) and near-UV (right) images of a five-month-old bite
mark on a living person. (Photos courtesy of Stephen Warlen and
the Kansas City Police Department Crime Lab) . . . . . . . . . . 25
1.28 Epoxy floor sealant shoe mark on a tile floor: left—VIS; right—
near-UV (396 nm). . . . . . . . . . . . . . . . . . . . . . . . . . 25
1.29 Shoemark on vinyl tile with floor wax: left—VIS; right—near-UV
(365 nm). . . . . . . . . . . . . . . . . . . . . . . . . . . . . . . 25
1.30 Fresh and old paint on a stucco wall: left—VIS; right—near-UV
(330–400 nm). . . . . . . . . . . . . . . . . . . . . . . . . . . . . 26
1.31 Near-UV image of polar bears. (Courtesy of Dr. David Lavigne) . 27
1.32 Visible (left) and near-UV (right) images of Canadian Arctic
military camouflage. (Courtesy of Dr. David Lavigne) . . . . . . . 27
1.33 Visible (left) and near-UV (right) images of skin cancer. (Courtesy
of Dr. Norman Goldstein) . . . . . . . . . . . . . . . . . . . . . . 28
1.34 Visible (left) and near-UV (right) images of Black-Eyed Susans.
(Courtesy of Prof. Tom Eisner) . . . . . . . . . . . . . . . . . . . 29
1.35 Visible (left) and near-UV (right) images of Goneopteryx
cleopatra. (Courtesy of Edward Aicken) . . . . . . . . . . . . . . 30
1.36 Visible (left) and near-UV (right) images of coral reefs and fish.
(Courtesy of Prof. Thomas Cronin and the Journal of Fish Biology) 30
Downloaded From: https://www.spiedigitallibrary.org/ebooks/ on 16 Feb 2021
Terms of Use: https://www.spiedigitallibrary.org/terms-of-useList of Figures ix
1.37 Images of BK7 glass and fused silica discs in three narrow UV
bands. (Courtesy of David Hayes) . . . . . . . . . . . . . . . . . 31
1.38 From upper left to bottom right: SWIR (2000–2500 nm), SWIR
(950–1700 nm), visible (400–750 nm), and near-UV (350–380 nm)
images of a human eye. (Courtesy of FLIR and Rand Molnar) . . 32
1.39 SWIR, visible, and near-UV images of the author. (Courtesy of
FLIR and Rand Molnar) . . . . . . . . . . . . . . . . . . . . . . 33
1.40 Top–VIS image of oil rig at 47 km range. Bottom–SWIR
(950–1700 nm) image. (Courtesy of FLIR) . . . . . . . . . . . . . 34
1.41 The setting moon over Nellis Air Force Base in near-UV, VIS,
near-IR, and midwave IR wavebands. (Midwave IR image courtesy
of FLIR) . . . . . . . . . . . . . . . . . . . . . . . . . . . . . . . 35
1.42 Visible (left) and SWIR (right) images of a methanol fire.
(Courtesy of FLIR) . . . . . . . . . . . . . . . . . . . . . . . . . 36
1.43 Composite visible and UV (240–280 nm) image of methanol fires.
(Courtesy of Ofil Ltd., Nes-Ziona, Israel) . . . . . . . . . . . . . . 37
1.44 Composite visible and UV (240–280 nm) image of power line
corona. (Courtesy of Ofil Ltd., Nes-Ziona, Israel) . . . . . . . . . 38
1.45 Visible (left) and near-UV (right) images of fuel rod assembly
in a storage pond. The missing rods make the marked holes
glow brighter because nothing is blocking the light paths. (Photo
courtesy of Channel Systems) . . . . . . . . . . . . . . . . . . . . 38
1.46 Shortwave IR image of a lit cigarette illuminating a bathroom.
(Courtesy of FLIR) . . . . . . . . . . . . . . . . . . . . . . . . . 39
1.47 Visible (left) and SWIR (right) images of hot and cold stove
burners. (Courtesy of FLIR) . . . . . . . . . . . . . . . . . . . . . 40
2.1 The infrared spectrum in relation to visible light. . . . . . . . . . 42
2.2 A child watching television: left–VIS; right–3-5 micrometers.
(Courtesy of FLIR). . . . . . . . . . . . . . . . . . . . . . . . . . 42
2.3 MWIR (3–5 mm) image of pyramid and Sphinx. (Courtesy of Stan
Laband) . . . . . . . . . . . . . . . . . . . . . . . . . . . . . . . 44
2.4 Plastic plant pot on wood chips in sunlight: left—VIS; right—
MWIR (3–5 mm). . . . . . . . . . . . . . . . . . . . . . . . . . . 45
2.5 Thermal scar left by plant pot: left—VIS; right—MWIR
(3–5 mm). (Courtesy of FLIR [IR] and Patrick Stanbro [visible]) . 45
2.6 Visible and MWIR (3–5 mm) images of a floor with heat footprints.
(Courtesy of FLIR) . . . . . . . . . . . . . . . . . . . . . . . . . 46
2.7 MWIR (3–5 mm) image of the author. (Courtesy of FLIR) . . . . 46
2.8 Visible (left) and MWIR (3–5 mm) (right) images of the author’s
eye. (Courtesy of FLIR) . . . . . . . . . . . . . . . . . . . . . . . 46
2.9 A boy with his arm inside a black polyethylene garbage bag: left—
VIS; right—MWIR (3–5 mm). (Courtesy of FLIR) . . . . . . . . 47
2.10 Visible (left) and MWIR (3–5 mm) (right) images of a man sitting
in a car. (Courtesy of FLIR and Patrick Stanbro) . . . . . . . . . . 49
Downloaded From: https://www.spiedigitallibrary.org/ebooks/ on 16 Feb 2021
Terms of Use: https://www.spiedigitallibrary.org/terms-of-usex List of Figures
2.11 Visible (left) and MWIR (3–5 mm) (right) images of a man
reflected in a brushed stainless steel refrigerator door. (Courtesy
of FLIR and Patrick Stanbro) . . . . . . . . . . . . . . . . . . . . 49
2.12 Cooled MWIR (3–5 mm) camera. (Courtesy of FLIR) . . . . . . . 50
2.13 Block diagram of a cooled MWIR (3–5 mm) camera. . . . . . . . 50
2.14 Visible and LWIR images of person in smoke-filled building.
(Courtesy of FLIR) . . . . . . . . . . . . . . . . . . . . . . . . . 52
2.15 Jesusita fire at 10-km range in Santa Barbara, California: left—
VIS; right—MWIR (3–5 mm). (Courtesy of FLIR) . . . . . . . . 52
2.16 Handgun in bushes at night: left—VIS; right—LWIR (8–13 µm).
(Courtesy of FLIR) . . . . . . . . . . . . . . . . . . . . . . . . . 52
2.17 Burglar sneaking in the dark: left—VIS; right—MWIR (3–5 mm).
(Courtesy of FLIR) . . . . . . . . . . . . . . . . . . . . . . . . . 52
2.18 Visible (left) and MWIR (3–5 mm) (right) images of a living room.
(Courtesy of FLIR and Patrick Stanbro) . . . . . . . . . . . . . . 54
2.19 Thermal image of unmarked graves. (Courtesy of Gary J. Weil,
Entech Engineering, Inc.) . . . . . . . . . . . . . . . . . . . . . . 54
2.20 Heated seats in a car: left—VIS; right—MWIR (3–5 mm).
(Courtesy of FLIR and Patrick Stanbro) . . . . . . . . . . . . . . 55
2.21 Visible (top) and MWIR (3–5 mm) (bottom) images of energized
transformers. (Courtesy of FLIR) . . . . . . . . . . . . . . . . . . 55
2.22 Visible (left) and MWIR (3–5 mm) (right) images of a high-speed
circuit board. (Courtesy of FLIR) . . . . . . . . . . . . . . . . . . 56
2.23 Propane gas leak imaged with a special 3.3 micrometer midwave-
IR camera. (Courtesy of FLIR) . . . . . . . . . . . . . . . . . . . 57
2.24 Harrier jet hovering in place during an airshow: top—
VIS; middle—MWIR (3–5 mm); bottom—NIR (0.78–1.1 µm).
(Courtesy of FLIR) . . . . . . . . . . . . . . . . . . . . . . . . . 58
2.25 Chinook helicopter taking off at night: left—VIS; right—MWIR
(3–5 mm). (Courtesy of FLIR) . . . . . . . . . . . . . . . . . . . 59
2.26 A 168 grain .30 caliber bullet in flight: top—MWIR (3–5 mm);
bottom—VIS. (Courtesy of FLIR and Vision Research) . . . . . . 59
2.27 VIS and MWIR (3–5 mm) images of a cat. (Courtesy of FLIR) . . 61
2.28 Visible (left) and MWIR (3–5 mm) (right) images of blood flow in
a forearm. (Courtesy of FLIR) . . . . . . . . . . . . . . . . . . . 61
2.29 MWIR (3–5 mm) image of hand with a missing finger. (Courtesy
of FLIR) . . . . . . . . . . . . . . . . . . . . . . . . . . . . . . . 61
2.30 Visible (left) and MWIR (3–5 mm) (right) images of a fingertip.
(Courtesy of FLIR) . . . . . . . . . . . . . . . . . . . . . . . . . 62
2.31 Hummingbird in flight—MWIR (3–5 mm). (Courtesy of FLIR) . . 63
2.32 LWIR image of a bee ball (left) and visible image of a dead hornet
dragged by bees (right). (Courtesy of Dr. Masato Ono, Tamagawa
University, Tokyo) . . . . . . . . . . . . . . . . . . . . . . . . . . 63
2.33 Eclipsed Moon imaged in 4.29-µm waveband. (Courtesy of
DCATT Team, MSX Project, and BMDO) . . . . . . . . . . . . . 65
Downloaded From: https://www.spiedigitallibrary.org/ebooks/ on 16 Feb 2021
Terms of Use: https://www.spiedigitallibrary.org/terms-of-useList of Figures xi
3.1 The long-wavelength region of the electromagnetic spectrum. . . . 69
3.2 T-Ray image of an integrated circuit. (Courtesy of Prof. Daniel
Mittleman and Prof. Martin Nuss). . . . . . . . . . . . . . . . . . 70
3.3 T-ray image of a leaf at 48-hour interval. (Courtesy of Prof. Daniel
Mittleman and Prof. Martin Nuss). . . . . . . . . . . . . . . . . . 70
3.4 Visible (top) and T-ray (bottom) images of a milk chocolate bar
with almonds. (Courtesy of Picometrix, Inc.) . . . . . . . . . . . . 71
3.5 Side view of concealed contraband under clothing. . . . . . . . . 73
3.6 Visible (left) and mmW (right) images of a man with concealed
guns. (Courtesy of Millivision Corporation) . . . . . . . . . . . . 73
3.7 Visible (top) and mmW (bottom) images of a runway in zero-
visibility fog. (Courtesy of Northrup Grumman Corporation) . . . 74
3.8 Passive millimeter-wave camera on aircraft nose. (Courtesy of
Northrup Grumman Corporation) . . . . . . . . . . . . . . . . . 75
3.9 Karl Jansky and his steerable 14.6-m wavelength radio antenna.
(Courtesy of NRAO/AUI) . . . . . . . . . . . . . . . . . . . . . . 76
3.10 Microwave sky in the 73-cm waveband. (Courtesy of NASA) . . . 76
3.11 Aitoff projection of the visible sky. (Courtesy of Axel Mellinger) . 78
3.12 Block diagram of radio telescope and celestial source. The
telescope has a narrow field of view (the “beam”) that scans the
source. . . . . . . . . . . . . . . . . . . . . . . . . . . . . . . . . 78
3.13 Parkes Observatory. (Courtesy of David McClenaghan, CSIRO) . . 79
3.14 Airborne radar system schematic. . . . . . . . . . . . . . . . . . . 80
3.15 Model of SIR-C/X-SAR imaging radar antenna array. . . . . . . . 81
3.16 Radar image of Angkor in Cambodia. (Courtesy of NASA) . . . . 82
3.17 Radar image of Wadi Kufra, Libya. (Courtesy of NASA) . . . . . . 83
3.18 Lake Vostok imaged by Radarsat with 6-cm microwaves.
(Courtesy of Canadian Space Agency) . . . . . . . . . . . . . . . 84
3.19 Visible and microwave images of Venus. (Left image courtesy of
Calvin J. Hamilton, right image courtesy of NASA) . . . . . . . . 85
3.20 Radar image of Maat Mons. (Courtesy of NASA) . . . . . . . . . . 86
3.21 Visible (left) and MIR (right) images of an antitank mine.
(Courtesy of Lawrence Livermore National Laboratory) . . . . . . 86
3.22 Visible (left) and MIR (right) images of metal structures
in concrete slab. (Courtesy of Lawrence Livermore National
Laboratory) . . . . . . . . . . . . . . . . . . . . . . . . . . . . . 87
4.1 The short-wavelength region of the electromagnetic spectrum. . . 90
4.2 Schematic of an x-ray shadowgram. . . . . . . . . . . . . . . . . 93
4.3 Crookes tube schematic. . . . . . . . . . . . . . . . . . . . . . . 93
4.4 The first radiograph. (Courtesy of the American College of
Radiology) . . . . . . . . . . . . . . . . . . . . . . . . . . . . . 94
4.5 Hand of Mihran Kassabian, x-ray martyr. (Courtesy of American
College of Radiology) . . . . . . . . . . . . . . . . . . . . . . . . 94
Downloaded From: https://www.spiedigitallibrary.org/ebooks/ on 16 Feb 2021
Terms of Use: https://www.spiedigitallibrary.org/terms-of-usexii List of Figures
4.6 Kassabian’s x-ray laboratory. (Courtesy of American College of
Radiology) . . . . . . . . . . . . . . . . . . . . . . . . . . . . . . 95
4.7 X-ray studio advertisement. (Courtesy of American College of
Radiology) . . . . . . . . . . . . . . . . . . . . . . . . . . . . . . 95
4.8 Nelson x-ray power supply. (Courtesy of American College of
Radiology) . . . . . . . . . . . . . . . . . . . . . . . . . . . . . . 96
4.9 Shoe-fitting fluoroscope. (Courtesy of Dr. Paul Frame) . . . . . . 97
4.10 Radiograph of a foot in a shoe. (Courtesy of American College of
Radiology) . . . . . . . . . . . . . . . . . . . . . . . . . . . . . . 97
4.11 X-ray shadowgram of a lily. (Courtesy of Steve Meyers) . . . . . . 98
4.12 Movie poster from X: The Man with the X-ray Eyes. (Courtesy of
MGM) . . . . . . . . . . . . . . . . . . . . . . . . . . . . . . . . 99
4.13 Thomson Twins imaged by a fluoroscope. (Courtesy of
Hergé/Moulinsart)
c Hergé/Moulinsart 2010. . . . . . . . . . . . . . . . . . . . . 99
4.14 Visible and x-ray images of a painting. (Courtesy of the J. Paul
Getty Museum, Los Angeles) . . . . . . . . . . . . . . . . . . . . 100
4.15 Mummy being loaded into CAT scanner. (Courtesy of Prof. Clive
Baldock) . . . . . . . . . . . . . . . . . . . . . . . . . . . . . . . 101
4.16 CAT-scan front view of a mummy. (Courtesy of Prof. Clive Baldock) 101
4.17 CAT-scan cross section of a mummy. (Courtesy of Prof. Clive
Baldock) . . . . . . . . . . . . . . . . . . . . . . . . . . . . . . . 102
4.18 X-ray CAT scan of the mummy Nesperennub, an Egyptian priest
who was mummified in approximately 800 BCE. (Photo courtesy
of SGI) . . . . . . . . . . . . . . . . . . . . . . . . . . . . . . . 103
4.19 A color image of Nesperrenub’s cartonnage casket, which has
remained sealed for almost 3000 years. (Photo courtesy of the
British Museum) . . . . . . . . . . . . . . . . . . . . . . . . . . . 103
4.20 A close-up x-ray CAT scan of Nesperrenub’s hands showing
various ornamental rings. (Image courtesy of SGI) . . . . . . . . . 104
4.21 Marijuana concealed behind a false wall in a truck. (Courtesy of
American Science and Engineering) . . . . . . . . . . . . . . . . 104
4.22 Backscatter x-ray image of a man. (Courtesy of American Science
and Engineering) . . . . . . . . . . . . . . . . . . . . . . . . . . 105
4.23 The Sun imaged with soft x rays. (Courtesy of Yohkoh/SXT) . . . 106
4.24 Gamma-ray imaging with radioactive source and film. . . . . . . . 108
4.25 Visible (left) and gamma-ray (right) images of a marble statue.
(Courtesy of CEA) . . . . . . . . . . . . . . . . . . . . . . . . . . 109
4.26 Schematic diagram of a PET scan. . . . . . . . . . . . . . . . . . 110
4.27 Heart muscle viability indicated by PET scans: left image shows
loss of blood flow in regions, right image shows metabolic activity.
(Courtesy of Dr. David Lilien, Biomedical Research Foundation of
Northwest Louisiana) . . . . . . . . . . . . . . . . . . . . . . . . 111
4.28 Normal brain (left) and brain with Alzheimer’s disease (right) PET
scans. (Courtesy of Dr. Michael E. Phelps, UCLA School of Medicine)112
Downloaded From: https://www.spiedigitallibrary.org/ebooks/ on 16 Feb 2021
Terms of Use: https://www.spiedigitallibrary.org/terms-of-useList of Figures xiii
4.29 Epileptic brain PET scan. (Courtesy of Dr. Michael E. Phelps,
UCLA School of Medicine) . . . . . . . . . . . . . . . . . . . . . 112
4.30 GRIS images of depleted uranium (left) and plutonium fuel rods
(right). (Courtesy of Lawrence Livermore National Laboratory) . . 113
4.31 Rendering of GRIS inspection of a Peacekeeper missile in its silo.
(Courtesy of Lawrence Livermore National Laboratory) . . . . . . 114
4.32 GRIS image of a Peacekeeper missile warhead package. (Courtesy
of Lawrence Livermore National Laboratory) . . . . . . . . . . . 114
5.1 Schematic of ship’s depth finder. . . . . . . . . . . . . . . . . . . 117
5.2 Sonar towfish with undersea cable. (Courtesy of Garry Kozak, L-3
Klein) . . . . . . . . . . . . . . . . . . . . . . . . . . . . . . . . 118
5.3 (a) Front view and (b) top view of sonar towfish with sonar beams.
(Courtesy of John Perry Fish). . . . . . . . . . . . . . . . . . . . 119
5.4 The Empire Knight imaged with sonar. (Courtesy of Garry Kozak,
L-3 Klein) . . . . . . . . . . . . . . . . . . . . . . . . . . . . . . 119
5.5 Another sonar image of the Empire Knight. (Courtesy of Garry
Kozak, L-3 Klein) . . . . . . . . . . . . . . . . . . . . . . . . . . 120
5.6 (a) Sonar scan of a lake with a drowning victim at the bottom; (b)
detail of drowning victim. (Courtesy of Gary Klein). . . . . . . . . 121
5.7 Fetal ultrasound image. (Courtesy of Siemens Healthcare,
Ultrasound) . . . . . . . . . . . . . . . . . . . . . . . . . . . . . 122
5.8 Ultrasound image of a fetus with Doppler false color. (Courtesy of
Siemens Healthcare, Ultrasound) . . . . . . . . . . . . . . . . . . 122
5.9 ROMANIS acoustic imaging sensor. (Courtesy of Mandar Chitre
and Venugopalan Pallayil, Acoustic Research Lab, Tropical
Marine Science Institute, National University of Singapore) . . . . 124
5.10 (a) ANI target and (b) an acoustic noise image of the target.
(Courtesy of Mandar Chitre and Venugopalan Pallayil, Acoustic
Research Lab, Tropical Marine Science Institute, National
University of Singapore). . . . . . . . . . . . . . . . . . . . . . . 125
5.11 Acoustic image series of a TGV trainset. (Courtesy of TNO-TPD,
Delft, the Netherlands) . . . . . . . . . . . . . . . . . . . . . . . 126
5.12 TGV Thalys trainset and SYNTACAN acoustic imaging array.
(Courtesy of TNO-TPD, Delft, the Netherlands). . . . . . . . . . . 126
6.1 Millimeter-wave (λ = 3300 µm) photo. (Courtesy of Trex Enterprises)128
6.2 Longwave infrared (λ = 8–9 µm) photo. (Courtesy of FLIR) . . . . 128
6.3 Midwave infrared (λ = 3–5 µm) photo. (Courtesy of FLIR) . . . . 129
6.4 Shortwave infrared (λ = 2–2.5 µm) photo. (Courtesy of FLIR) . . 130
6.5 Near-infrared (λ = 0.9–1.68 µm) photo. (Courtesy of FLIR) . . . . 130
6.6 Very near-infrared (λ = 0.83–1.1 µm) photo. . . . . . . . . . . . . 130
6.7 Visible (λ = 0.4–0.7 µm) photo. . . . . . . . . . . . . . . . . . . 131
6.8 Near-ultraviolet (λ = 0.35–0.38 µm) photo. (Courtesy of Rand
Molnar) . . . . . . . . . . . . . . . . . . . . . . . . . . . . . . . 131
Downloaded From: https://www.spiedigitallibrary.org/ebooks/ on 16 Feb 2021
Terms of Use: https://www.spiedigitallibrary.org/terms-of-usexiv List of Figures
6.9 Shortwave ultraviolet (λ = 0.254 µm) photo. (Courtesy of Patrick
Stanbro) . . . . . . . . . . . . . . . . . . . . . . . . . . . . . . . 132
6.10 X ray (λ ∼ 2.5 × 10⁻⁵ mm) of a human head. (Courtesy of LACMA). 132
6.11 Multiwavelength Milky Way images . . . . . . . . . . . . . . . . 134
Courtesy of the Astrophysics Data Facility,
NASA Goddard Space Flight Center). . . . . . . . . . . . . . . .
Downloaded From: https://www.spiedigitallibrary.org/ebooks/ on 16 Feb 2021
Terms of Use: https://www.spiedigitallibrary.org/terms-of-usePreface
The inspiration for Alien Vision came from two other illustrated science books
that I have long admired. Both are visual explorations of nature that use imaging
technology to transcend the limitations of human visual perception. The first is
The Powers of Ten, by Phillip and Phylis Morrison,∗ which takes the reader on a
pictorial journey through 40 powers of ten in size scale, starting with a one-meter
square image of a couple sleeping on a park lawn. Each successive section of the
book changes the scale of the image by a factor of ten, zooming out to view the
park, then Chicago, then Lake Michigan, then North America, then Earth, and so
on, until finally the square image is so large that it encompasses a multitude of
galaxies. Then the “camera” zooms in on the man’s hand, on a mosquito feeding
there, then on bacteria on the mosquito, and so on, stopping at the subatomic
particles whirling around in the nucleus of a single atom. There is also a movie
version of this book available that includes a sequence where the observer rushes
in from viewing distant clusters of galaxies to the hand of the sleeping man! The
Powers of Ten explores nature in the scale domain, exploring size scales that are
much larger and much smaller than the size scale of human visual perception.
The second book is Stopping Time—The Photographs of Harold Edgerton.†
The photographs in this book show commonplace events captured with high-
speed cameras using electronic flash units and special shutters invented by Prof.
Edgerton and his colleagues at the Massachussetts Institute of Technology. Events
that happen in thousandths or millionths of a second are captured on film: a bullet
passing through an apple, the first atomic bomb test an instant after detonation,
a football player kicking a football. Edgerton’s work is an exploration of images
of the world in the time domain. The Eames Office, makers of the film version of
The Powers of Ten, have also produced a film called The Powers of Time‡ which
explores the universe in 37 orders of magnitude of time, from the tiny attosecond
to 31 billion years. These time scales are much shorter and much longer than the
time scale of human visual perception.
My idea was to apply this same idea of a visual exploration of the universe
to the electromagnetic spectrum itself, which could be considered the domain of
wavelength. Instead of exploring the universe in many size or time scales, my book
would take the reader on a tour of all the possible “colors” of light, from long-
wavelength radio waves to extremely short gamma rays. These are wavelengths of
light that are much longer and much shorter than the narrow wavelength range of
human visual perception. It would be as though the readers each had a knob on
∗
The Powers of Ten, Phillip and Phylis Morrison and the Office of Charles and Ray Eames, Scientific
American Library, New York (1982).
†
Stopping Time-The Photographs of Harold Edgerton, Harold Edgerton, Abrams, New York (1987).
‡
The Powers of Time (1996), by Eames Demetrios for the Eames Office.
xv
Downloaded From: https://www.spiedigitallibrary.org/ebooks/ on 16 Feb 2021
Terms of Use: https://www.spiedigitallibrary.org/terms-of-usexvi Preface
their heads that they could tune like a radio dial and change the “color response”
of their eyes out of the visible spectrum and into the infrared, ultraviolet, and
beyond. I worked for a time as an astrophysicist and was always fascinated by
the way we observe the sky with instrumentation that extends the human visual
sense into new realms of the electromagnetic spectrum beyond the visible portion.
An astronomy teacher of mine once remarked that if our eyes could only detect
radio waves instead of what we call visible light, then we would not see the stars
at all. Instead, we would see a sky full of big clouds and swirls of cold interstellar
gas, with compact radio sources sprinkled throughout. The familiar night sky we
see is only one of many possible skies overlaid on top of one another. I wondered if
hypothetical aliens on some distant planet might see a radio sky with their peculiar
visual apparatus. Extraterrestrial aliens aside, with imaging technology we have
the ability to synthesize our own version of “alien vision.”
This book is not intended as a comprehensive survey of imaging technology.
Rather, it is a compilation of images and descriptions of imaging technology that
convey a sense of what nature looks like when imaged with “invisible light.”
Descriptions of the imaging technology (electronic sensors and photographic film)
are non-technical in nature, and I include pictures of actual imaging devices only in
cases where the layperson can appreciate the design of the device. I have attempted
to include a visible-light picture of the same scene or object next to every “invisible
light” image, but these visible-light counterparts were not always available.
The majority of the research for this book was carried out through Internet
searches, which uncovered many images and articles on imaging. I located the
authors of this web content, and these helpful colleagues transmitted additional
articles and digital images to me via e-mail from all over the world. I obtained
many of the infrared images in Chapters 1 and 2 using cameras provided by my
present employer, FLIR in Santa Barbara, California. I have attempted to obtain
the highest-resolution images available, but many of the electronic sensors used
to image in invisible wavebands of light have limited resolution, and the resulting
images can sometimes appear quite grainy in comparison with their visible-light
counterparts. Since the first edition of the book, the number of pixels of many
thermal IR sensors has increased from 80,000 to over 1 million. I attempted to
“upgrade” IR images whenever possible, though in some cases it was not practical
or possible to do so. In some cases, the ultimate resolution of an image is limited
by the wavelike properties of light, properties that make it impossible to resolve
features that are smaller than a wavelength. I have used metric units throughout,
and terms or jargon in boldface are included in a glossary at the end of the book.
Metric units are very appropriate in a book like this, because I don’t think I have
ever heard of anyone using Imperial units as a measure of wavelength!
I refer to electromagnetic waves as light throughout this book. Some would
question that usage, preferring to reserve the term “light” for visible light only.
Everything else would then be called electromagnetic radiation. I dislike this usage
of the word radiation to describe lightwaves in a book like Alien Vision. To the
layperson, the word radiation calls to mind ionizing particles or gamma rays. Some
workers in the infrared industry use the term energy rather than light. They will say
Downloaded From: https://www.spiedigitallibrary.org/ebooks/ on 16 Feb 2021
Terms of Use: https://www.spiedigitallibrary.org/terms-of-usePreface xvii
“shortwave infrared energy” rather than “shortwave infrared light.” I don’t like this
term much either—it is too vague. Energy has many different forms, but light is a
very specific manifestation of energy.
Downloaded From: https://www.spiedigitallibrary.org/ebooks/ on 16 Feb 2021
Terms of Use: https://www.spiedigitallibrary.org/terms-of-usexviii Preface
Acknowledgments
Many thanks are in order for the generosity and helpfulness of the people and
organizations that gave me permission to use images or offered suggestions:
Victoria Charters; Peter Richards; Elma O’Donaghue and Yosi Pozeilov of LA
County Museum of Art; John Lovberg and Chris Martin of Trex Enterprises;
Prof. Axel Mellinger of Central Michigan University; Lawrence Wolff of Equinox
Corporation; Prof. Gary Settles of Penn State University; Stephen Warlen of the
Kansas City Police Crime Laboratory; Cliff Anger of Itres Corporation; Gerry
Holst; Dr. Larry Yujiri of TRW, Inc.; Graham Rockley of Ashwin Systems Corp.;
Richard Hugenin of Millimetrix Corp.; Jay Robinson, Stan Laband, David Risdall,
Ron Carrelejo, and Vu Nguyen of FLIR; Chris Johnston, Kurt Heidner, and Elliot
Rittenberg of IRCameras.com; Dr. Greg Bearman of Jet Propulsion Laboratory; Dr.
Thomas Cronin of the University of Maryland, Baltimore County; Prof. Thomas
Eisner of Cornell; Dr. Masato Ono of Tamagawa University, Tokyo; Dr. Justin
Marshall and Kylie Jennings of the University of Queensland; Nancy Adams of
Kodak Corp.; Dr. Martin Nuss of Bell Labs – Lucent Technologies; John Perry
Fish; Dr. Michael E. Phelps of the UCLA School of Medicine; Clive Baldock
of the Queensland University of Technology; Calvin Hamilton; Dr. Scott Klioze
of the University of Florida; The American College of Radiology; Dr. David
Lilien of the Biomedical Research Foundation of Northwest Louisiana; Yvonne
Szafran of the Getty Conservation Institute; Dr. Klaus Ziock and Dr. Steven
Azevedo of the Lawrence Livermore National Laboratory; Zahi Lindner of Ofils
Ltd., Israel; Kathryn Charles-Wilson of British Museum Images; Sophie Lonsky of
SGI; Maurizio Seracini of Editech; Peter Horemans of Moulinsart, Belgium; Prof.
John David Jackson of UC Berkeley; Dr. Paul Frame of Oak Ridge Associated
Universities; Shaula Coyl of the LA County Museum of Art; Dr. David Alexander
of the Lockheed Martin Solar and Astrophysics Lab; Seth Digel of NASA; John
Potter of the National University of Singapore; Peter Taylor; Brian Nagourney;
Stan Voynick; Prof. Robert Romer and Prof. Kannan Jagannathan of Amherst
College; Rand Molnar of Brooks Institute of Photography; Rick Twardy of ATNF
CSIRO; Tony Bacarella; and Dannen Harris. A special thanks to the late Prof.
William Youngren (my stepfather) for his edit of the original manuscript and
encouragement to write this book, which was conceived during a road trip the two
of us took in January 1998.
Austin Richards, Ph.D. (www.austinrichards.com)
Santa Barbara, California, December 2010
Downloaded From: https://www.spiedigitallibrary.org/ebooks/ on 16 Feb 2021
Terms of Use: https://www.spiedigitallibrary.org/terms-of-useIntroduction
At each end of the solar spectrum the chemist can detect the presence of what
are known as “actinic” rays. They represent colors – integral colors in the
composition of light – which we are unable to discern. The human eye is an
imperfect instrument; its range is but a few octaves of the real “chromatic
scale.” I am not mad; there are colors that we cannot see. And, God help me!
The Damned thing is of such a color!
- From “The Damned Thing” by Ambrose Bierce (1893)
Dr. Waldman, I learned a great deal from you at the university about the
violet ray, the ultraviolet ray, which you said was the highest color of the
spectrum. You were wrong. Here in this machinery I have gone beyond that. I
have discovered the great ray that first brought life into the world!
- Dr. Henry Frankenstein, from the motion picture
Frankenstein, the Man Who Made a Monster (1931)
Vision ranks highest in the hierarchy of human senses. Our eyesight informs our
perception of the world to a tremendous extent. We grow so accustomed to seeing
the world a certain way that it is easy to forget that our vision is, in certain respects,
quite limited. For example, the optical properties of the eye are such that we cannot
resolve objects below a certain size scale without a microscope or magnifying
lens. Nor is the eye infinitely fast in its response time. The chemical and electrical
properties of the eye and brain impose speed limits on human visual perception:
events such as the motion of a bullet through an apple occur in time scales too
small to perceive. Stopping the flight of the bullet requires cameras with very fast
shutter speeds or strobe lights. In both of these cases, imaging technology enhances
human visual perception, enabling us to explore the world of very small things and
very fast things.
Imaging technology can also explore another fundamental limitation of human
visual perception, one that concerns the nature of light itself. When we look at
a candle flame, light emitted by the hot gases travels into our eye and produces
chemical and electrical signals that the brain interprets as an image. But the human
xix
Downloaded From: https://www.spiedigitallibrary.org/ebooks/ on 16 Feb 2021
Terms of Use: https://www.spiedigitallibrary.org/terms-of-usexx Introduction
eye is sensitive to light only within a narrow range of color, and when one looks
at a candle flame, one sees only a fraction of all the light emitted by the flame!
We distinguish these two classes of light in the following way. The light that our
eyes use for vision is called visible light. Visible light comes in all the colors of
the rainbow, from red to violet. Light that falls outside of this color range does not
produce a visual sensation. Hereafter this will be referred to as invisible light. It
should be noted that invisible light does not have “color” as we know it, since color
is a construct of human perception rather than an absolute property of light. A bit
later, I will define more appropriate means of describing the quality called color of
both visible and invisible light.
Invisible light surrounds us at all times, even when our eyes tell us we are in
the dark, and objects that appear non-luminous to the eye are always emitting
invisible light. Many sources of visible light, such as the Sun, are also emitters
of copious invisible light. A beam of sunlight passed through a prism splits into a
rainbow pattern of colors from red through violet. At each end of the pattern the
colors appear to fade into darkness, but this effect is a limitation of the eye. That
apparent darkness contains invisible light, for the pattern from the prism extends
out beyond what the eye sees, and it can be detected with imaging technology. In
fact, there is an almost infinite range of light beyond the visible. Imagine that you
could only hear one note out of the 88 notes on a piano, or that the only color you
could see was one particular shade of green, and you will have some idea of the
limitations of our visual apparatus. We do not normally think about this ubiquitous
invisible light, just as we do not normally think about the fact that we exist at
the bottom of an ocean of air that is many miles deep. But invisible light is there
nonetheless, and very interesting things are revealed when we use it to image the
world. In most cases, an image of an object or scene made with invisible light is
totally different from an image of the same object or scene made with visible light.
The reason for this is that some materials heavily absorb visible light yet freely
pass invisible light, while others pass visible light but strongly absorb invisible
light. An object or material that we think of as opaque such as a block of wood
may appear transparent to an invisible-light imaging system; conversely, objects
or materials that are transparent to visible light such as window glass may appear
opaque when imaged with invisible light. This book contains images (made with
visible and invisible light) and descriptions of both types of materials.
Imaging with invisible light is a relatively recent advance, requiring technology
invented since the end of the 19th century. In recent decades, the technology of
imaging with invisible light has grown at an amazing rate, especially in the area of
electronic detectors. Whenever possible for purposes of comparison, images made
with invisible light are presented alongside images of the same scene or object
made with visible light. In the cases when only the image made with light from
outside our color perception range is shown, the visible-light image was either not
available, would be completely black, or is obvious as to its appearance.
Downloaded From: https://www.spiedigitallibrary.org/ebooks/ on 16 Feb 2021
Terms of Use: https://www.spiedigitallibrary.org/terms-of-useIntroduction xxi
Describing invisible light
Since we cannot see invisible light with our eyes, we cannot describe it by its
color. A different convention is needed, one based on the physical properties of
light itself. What is light, and what property of it is perceived as color by the eye?
Classical physics describes light as an electromagnetic wave that propagates at
a fixed speed through empty space, a disturbance in the electromagnetic field.
Scientists describe the “color” of an electromagnetic wave or light wave in terms
of its wavelength, its frequency, or its energy. The wavelength of light is defined
as the distance between crests of waves that propagate in the electromagnetic
field. If one places a free electric charge in the path of the wave, the charge will
move in response to the oscillations of the electromagnetic field of the wave, just
as a buoy moves up and down on the surface of the ocean when water waves
pass underneath it. The frequency of a light wave is defined as the number of
oscillations of the electromagnetic field per second. The wavelength and frequency
of an electromagnetic wave are related by the following expression:
c = λν
where c is the speed of light in empty space, λ is the wavelength, and ν is the
frequency. Note that frequency and wavelength are inversely proportional to each
other: the higher the frequency of the light wave, the shorter the wavelength. The
energy of light is defined in the following way. Quantum theory predicts that light
waves transfer energy to matter and vice-versa in discrete bundles called photons.
The energy of a photon in a lightwave is related to its frequency of the lightwave
by the expression E = hν, where ν is the frequency in cycles per second and h
is Planck’s constant. Wavelength, frequency, and energy are all used to describe
lightwaves, and the full range of wavelengths, frequencies, or energies of light is
called the electromagnetic spectrum.
The various colors of visible light are described generally in terms of
wavelength, since it is the easiest parameter to measure directly. For example, red
laser pointers emit light with a wavelength of 635 nanometers, abbreviated as
nm. Wavelength is a very useful way to describe light in the middle regions of the
electromagnetic spectrum, but it is not so useful at the edges. At very high energies
the wavelength of light is so short and its frequency so high that it is impractical
to measure either its wavelength or frequency, and therefore it is conventional
to quantify a lightwave by the amount of energy it transfers in a collision with
matter, i.e. the energy of its photons. At very low energies, the wavelengths of
lightwaves become very long and difficult to measure, while frequencies can be
measured directly. Thus, these very low energy light waves are described in terms
of frequency. All three descriptors are used throughout this book, with a bias toward
wavelength.
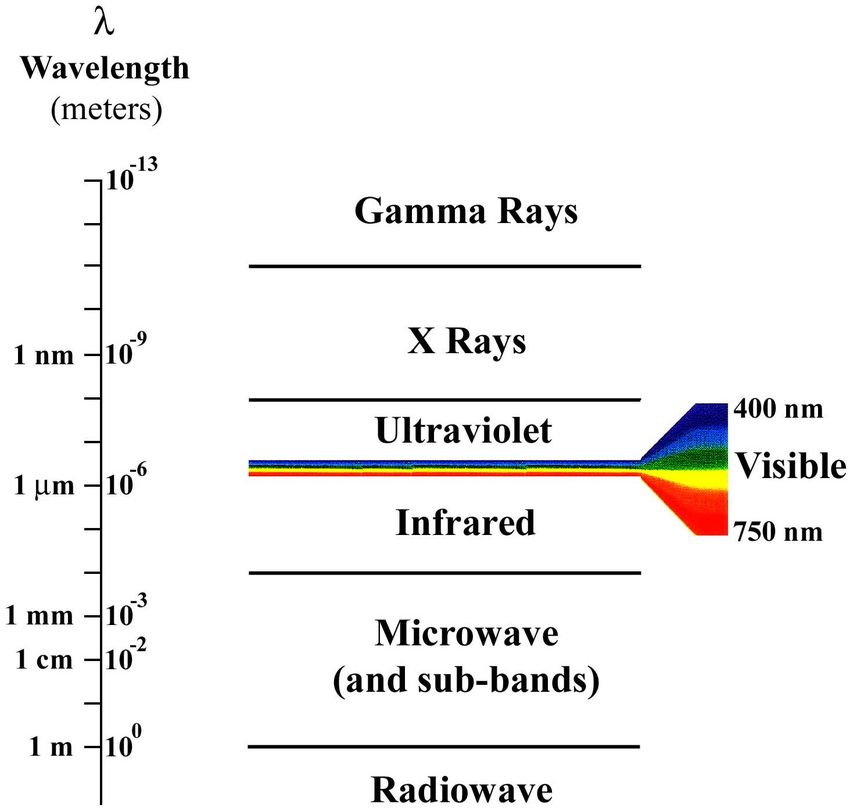
Figure 1 is a diagram of the electromagnetic spectrum with wavelength indicated
in metric length units. The energy of light decreases with wavelength; thus, energy
decreases from top to bottom in the figure. The range of wavelengths shown spans
Downloaded From: https://www.spiedigitallibrary.org/ebooks/ on 16 Feb 2021
Terms of Use: https://www.spiedigitallibrary.org/terms-of-usexxii Introduction
Figure 1 Electromagnetic spectrum.
18 powers of ten, and is divided into regions called wavebands. The diagram
does not represent the entire electromagnetic spectrum, but it encompasses the
wavelengths of light used to make the images in this book and the vast majority
of wavelengths of light studied by scientists. The most familiar classifications
of wavebands are indicated by regions that span a portion of the spectrum, the
radiowave, microwave, infrared, visible, ultraviolet, x-ray and gamma-ray
wavebands. These areas are not strict definitions—there is some overlap between
wavebands, and there are also subclassifications within wavebands. These sub-
bands are described in more detail in subsequent chapters. Visible light, the light
that our eyes use to collect visual information, is merely a narrow strip within the
scale of the electromagnetic spectrum. Our eyes see light in the wavelength range
from 400–750 nm, and that is all!
The visible waveband is flanked by the infrared (“below red”) and ultraviolet
(“beyond violet”) wavebands. These names are based on the wavebands’ position
in the spectrum relative to visible light, but the other wavebands have names that
are quite independent of any reference to visible light or even light at all. This
naming convention is a consequence of the history of their discovery —x rays and
gamma rays, for example, were initially thought to be particles (or “rays”) rather
than lightwaves. It is often more convenient to describe x rays and gamma rays in
terms of energy rather than wavelength or frequency, since the wavelengths are so
extremely short and the frequencies so high that they can be difficult or impossible
Downloaded From: https://www.spiedigitallibrary.org/ebooks/ on 16 Feb 2021
Terms of Use: https://www.spiedigitallibrary.org/terms-of-useIntroduction xxiii
to measure directly. Microwaves and radio waves are also lightwaves; though, like
x rays and gamma rays, they interact with matter in a manner that is very different
from visible light. Most people do not think of radiowaves as low-energy cousins
of visible lightwaves. But they are indeed lightwaves, and are often described in
terms of their frequency, since we can directly measure the oscillation frequency
of electric charges induced by passing radio waves.
Each chapter of this book describes a different waveband of the electromagnetic
spectrum, with selected images to illustrate the unique properties of that waveband.
The book begins with the infrared and ultraviolet wavebands, since the imaging
technology—such as cameras, film, and filters—is familiar at these wavelengths
near to our own visual range. Moving further out into the spectrum, subsequent
chapters present images produced by the more exotic technologies needed to image
thermal infrared, microwave, and radio wavebands; yet we will still be in the
range of light that is emitted by objects (such as people, animals and machines)
at terrestrial temperatures. Then comes the highest-energy, shortest-wavelength
region of the spectrum, where light is either man made—such as that produced by
an x-ray tube or radar transmitter—or produced in the extreme conditions found in
celestial objects e.g., the Sun or in nuclear explosions. Some of the imaging devices
used at the extreme ends of the electromagnetic spectrum look nothing like a
visible-light camera, but they produce images that can be visually interpreted. The
book also includes images produced by sound waves for those cases where imaging
with light waves is impossible, such as with a ship sunk at the bottom of the ocean.
The final chapter studies a scene or object as seen through various wavelengths of
light, tuning that imaginary knob on our head to adjust the wavelength of the light
we see. But first, on to the edges of the rainbow: the infrared and the ultraviolet
wavebands of the electromagnetic spectrum.
Downloaded From: https://www.spiedigitallibrary.org/ebooks/ on 16 Feb 2021
Terms of Use: https://www.spiedigitallibrary.org/terms-of-useYou can also read