Alternative splicing events implicated in carcinogenesis and prognosis of thyroid gland cancer
←
→
Page content transcription
If your browser does not render page correctly, please read the page content below
www.nature.com/scientificreports
OPEN Alternative splicing events
implicated in carcinogenesis
and prognosis of thyroid gland
cancer
Zeng‑Hong Wu1,2,4, Yun Tang3,4 & Yue Zhou1*
Alternative splicing (AS), a critical post-transcriptional regulatory mechanism, expands gene
expression patterns, thereby leading to increased protein diversity. Indeed, more than 95% of human
genes undergo alternative splicing events (ASEs). In this study, we drew an all-around AS profile of
thyroid cancer cells based on RNA-seq data. In total, there were 45,150 AS in 10,446 thyroid cancer
cell genes derived from 506 patients, suggesting that ASEs is a common process in TC. Moreover, 1819
AS signatures were found to be significantly associated with the overall survival (OS) of TC patients.
Kaplan–Meier survival analyses suggested that seven types of ASEs were associated with poor
prognosis of TC (P < 0.05). Among them, exon skipping (ES) was the most common, with alternate
promoter (AP) and alternate terminator (AT) coming second and third, respectively. Our results
indicated that acceptor sites (AA) (AUC: 0.937), alternate donor sites (AD) (AUC: 0.965), AT (AUC:
0.964), ES (AUC: 0.999), mutually exclusive exons (ME) (AUC: 0.999), and retained intron (RI) (AUC:
0.837) exhibited an AUC greater than 0.6. In addition, age and risk score (All) were risk factors for TC
patients. We also evaluated whether TC-ASEs are regulated by various splicing factors (SFs). We found
that the expression of 90 SFs was associated with 469 ASEs and OS of TC patients. Our findings provide
an insight into the role of spliceosomes in TC, which may offer novel perspectives in tumor research.
Abbreviations
TC Thyroid cancer
ASEs Alternative splicing events
PTC Papillary thyroid carcinoma
ATC Anaplastic thyroid carcinoma
FTC Follicular thyroid carcinoma
MTC Medullary thyroid carcinoma
TCGA Cancer genome atlas
SFs Splicing factors
OS Overall survival
Thyroid cancer (TC) is the most prevalent endocrine tumor, and is a common head and neck malignant tumor.
Previous studies have reported that its incidence accounts for 1% of all malignant tumors1,2. Significant increase
in the incidence of TC in recent decades has led to widespread public concern. Moreover, its distant metastases
and lymph node metastases have been associated with high morbidity and mortality3. Thyroid cancer can be
divided into four pathological types including papillary thyroid cancer (PTC), anaplastic thyroid cancer (ATC),
follicular thyroid cancer (FTC), and medullary thyroid cancer (MTC)4, with papillary thyroid cancer accounting
for about 90% of all TC cases5. One study reported that the 35-year or 40-year survival rate of most PTC patients
exceeds 80% after effective treatment6. However, patients who are not sensitive to radioactive iodine therapy or
have cervical lymph node metastasis at the time of diagnosis have a poor prognosis, with the 10-year survival
1
Department of Otorhinolaryngology, Union Hospital, Tongji Medical College, Huazhong University of Science and
Technology, Wuhan, Hubei, China. 2Department of Infectious Diseases, Union Hospital, Tongji Medical College,
Huazhong University of Science and Technology, Wuhan 430022, China. 3Department of Critical Care Medicine,
Union Hospital, Tongji Medical College, Huazhong University of Science and Technology, Wuhan 430022,
China. 4These authors contributed equally: Zeng-Hong Wu and Yun Tang. *email: unionhospital2s1@126.com
Scientific Reports | (2021) 11:4841 | https://doi.org/10.1038/s41598-021-84403-6 1
Vol.:(0123456789)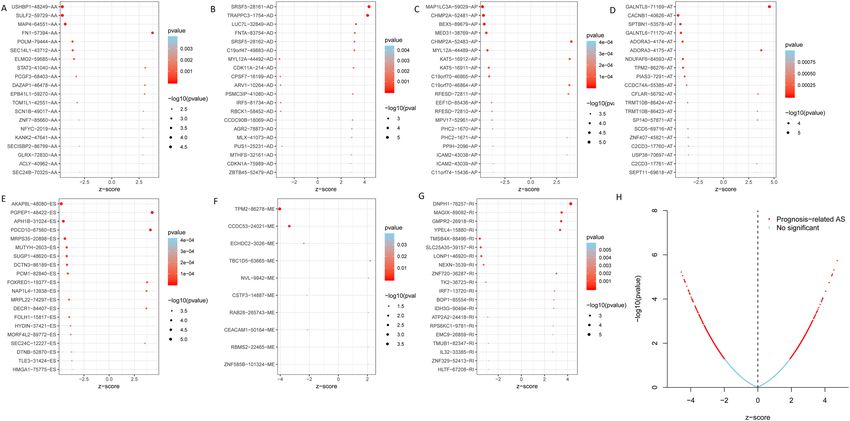
www.nature.com/scientificreports/
Variable Number of samples
Gender
Male/female 370/136
Age at diagnosis
≤ 65/ > 65/NA 435/71
Stage
I/II/III/IV/NA 285/52/112/55/2
T
T1/T2/T3/T4/NA 144/166/170/24/2
M
M0/M1/NA 284/9/213
N
N0/N1/NA 230/226/50
Table 1. The characteristics of thyroid cancer patients in TCGA.
rate being less than 10%7. This calls for the identification of prognostic biomarkers which can diagnose TC
recurrence and metastasis. Gene regulation dysfunction is a key factor in tumor occurrence and development.
Alternative splicing (AS), a critical post-transcriptional regulatory mechanism, expands gene expression
patterns, thereby leading to increased protein diversity. More than 95% of human genes undergo alternative
splicing events (ASEs) and encode splice variants in the regular physiological p rocesses8. Alternative splicing is
widely involved in several biological processes such as cell differentiation, proliferation, and apoptosis. Previ-
ous studies have reported that aberrant ASEs modulate cancer metastasis, progression, immunotherapy, and
therapeutic resistance, and they may provide opportunities for novel cancer t herapeutics9–13. In addition, alter-
native mRNA processing may be a potential target for cancer immunotherapy12. Alternative splicing includes
seven fundamental splicing patterns14,15: Alternate acceptor sites (AA), alternate promoter (AP), alternate donor
sites (AD), alternate terminator (AT), mutually exclusive exons (ME), exon skipping (ES), and retained intron
(RI). Several studies have reported that aberrant AS is a common event in the development and progression
of numerous cancers including gastrointestinal adenocarcinomas and urogenital m alignancies16–19. Xie et al.20
constructed a novel combined prognostic model for ASEs and clinicopathological parameters in esophageal
carcinoma. Wang et al.21 analyzed ASEs using whole-genome methods and developed a prognostic model for
endometrial cancer. Furthermore, Chen et al.22 used ASEs to develop a prognostic index which could accurately
predict overall survival (OS) in hepatocellular carcinoma. However, despite the existence of several studies on
ASEs23, the role of AS in thyroid cancer has not been fully elucidated. Therefore, we explored the combination
of splicing and clinical parameters, and potential mechanism of the survival-related splicing events in TC. An
all-around AS profile of thyroid cancer was drawn after analyzing RNA-seq data, and prognostic models were
developed by combining splicing signatures and clinicopathological parameters. Finally, we constructed a splic-
ing network with the overarching goal of providing functional insights into the role of AS in the initiation and
development of thyroid cancer.
Materials and methods
Source of raw data. We downloaded the target RNA sequence data of TC patients from The Cancer
Genome Atlas (TCGA) database (https://www.cancer.gov/tcga), a web-based resource which provides a user-
friendly interface for detailed views of alternative mRNA splicing based on the TCGA database and Percent
Spliced In (PSI) degrees ranging from 0 to 1 (PSI cutoff used based on FDR (false discovery rate) < 0.05). Thus,
PSI was used in quantifying the ASEs retrieved from TCGA24. In total, we extracted sequence data of 495 thy-
roid cancer and 58 adjacent normal tissues, and the clinicopathological data of TC patients. Table 1 shows the
characteristics of 506 thyroid cancer patients in the TCGA database. The data was then used to explore changes
in ASEs, and its association with carcinogenesis and prognosis of TC. It is worth noting that all the TCs enrolled
in this study were adenomas and adenocarcinomas.
Survival‑associated splicing events and clinical parameters. We only included the clinical data
of TC patients with an OS of 90 days or longer. Each clinical parameter was classified into either a high-risk
(≥ median number) or low-risk (< median number) group. Cox regression analysis was then used to determine
the relationship between AS events and OS as well as the prognostic value of demographic and clinicopathologi-
cal parameters of TC. The prognosis risk score was calculated as previously described19. We performed Kaplan–
Meier survival analysis to determine the survival significance of the signatures, while ROC curves were used to
assess the predictive value of the prognostic signatures. We then selected the top 20 from each type of splicing
and seven combined events.
Construction of gene network and correlation analysis. We explored whether splicing factors (SFs)
regulate ASEs because previous studies have shown that AS is regulated by SF. The SFs used in this study were
obtained from the dataset reported by Seiler et al.25. Spearman correlation method was used to determine the
relationship between all SFs and PSI of ASEs. The association was considered to be significant if the correlation
Scientific Reports | (2021) 11:4841 | https://doi.org/10.1038/s41598-021-84403-6 2
Vol:.(1234567890)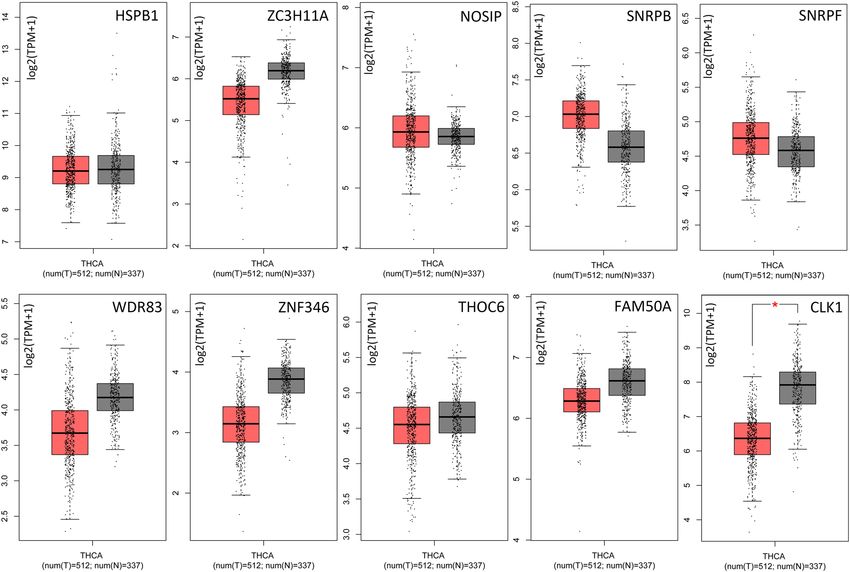
www.nature.com/scientificreports/
Figure 1. (A) Upset plots for the top 50 gene intersections of the seven types of ASEs identified in this study.
The dark bar on the right of each drawing represents the number of each type of ASEs. The dark dots in the
matrix at the bottom part of each drawing represents the intersections of AS events, while the dark bar on the
top represents the number of gene intersections corresponding to the ASEs marked by the red line below. The
red line indicates at least two ASEs. (B) A subset of overlapping overall survival associated ASEs among the
seven types of AS in TC. The y-axis represents the number of genes in each gene. Set size represents the number
of genes in each AS.
coefficient was |R2|> 0.6 at P < 0.001. Next, we constructed the connection network between SFs and ASEs using
Cytoscape (version 3.7.1). Gene set enrichment analysis (GSEA) creates an arranged list of all genes in accord-
ance with their connection with target gene expression. Thus, we performed GSEA to define the AS-ALL model
in the Kyoto Encyclopedia of Genes and Genomes (KEGG). Normalized enrichment scores (NES) and nominal
P-values were then used to classify the enriched pathways in each phenotype. Statistical significance was set at
P < 0.05 and false discovery rate (FDR) at q < 0.25.
Statistical analysis. All statistical analyses were performed using R software V. 3.5.3. The aggregates
and intersections between the seven different types of AS were demonstrated graphically using the UpSetR
package26,27. The hazard ratios (HRs) at 95% confidence intervals (CIs) were used to evaluate relative risk of TC
patients based on the seven PSI of ASEs in the different risk groups. Moreover, univariate and multivariate cox
regressions were performed in order to identify survival-associated SFs. Finally, differential analysis was con-
ducted using one-way ANOVA, with disease state (Tumor or Normal) being a variable for calculating differential
expression in the GEPIA database. P < 0.05 was considered to be statistically significant.
Ethical approval. As the work is a bioinformatics analysis article, ethical approval was not necessary and all
the data were retrieved from the free online databases.
Results
Overview of ASEs in TCGA‑TC. Each ASE was allocated a unique annotation, which was a combination
of the gene name, identification (ID) number, and the AS type in the SpliceSeq database (AS ID). For instance,
an annotation such as “FNTA-83754-AD” can be broken down as follows; FNTA is the gene name, 83,754 is the
AS ID, and AD is the splicing pattern. It is worth noting that one gene can undergo different types of AS. The
UpSet image was then used to match the genes with corresponding ASEs, which quantitatively assessed different
interactive sets. Our results indicated that there were 45,150 ASEs from 10,446 genes and 506 TC patients, and
the median AS for every gene was 4.322. Among the ASEs, 4481 genes underwent 8594 AT, 2449 genes under-
went 3189 AD, 4793 genes underwent 9126 AP, 2799 genes underwent 3684 AA, 7485 genes underwent 17,536
ES, 2035 genes underwent 2786 RI, 2449 genes underwent 3189 AD, and 217 genes underwent 232 ME. Notably,
one gene could have multiple survival associated AS events. Detailed information about the specific AS types
of genes was visualized using an Upset plot (Fig. 1A), which can demonstrate quantitative results of multiple
interactive sets more effectively than traditional Venn diagram. The Upset plot indicated that ES was the most
common of the seven types of ASEs, with AP and AT coming second and third, respectively (Fig. 1B).
Survival related ASEs in TCGA‑TC. Univariate cox analysis identified 1819 ASEs which were significantly
associated with OS of TC patients (Table S1, P < 0.05). The top 20 ASEs significantly associated with survival
are shown in Fig. 2A–G. Among them, there were only 10 prognostic M events. Meanwhile, the volcano plot of
prognosis-related ASEs is shown in Fig. 2H. Functional analysis and Lasso cox regression a lgorithm26–28 were
used to develop a capability risk signature in order to determine the prognostic value of AS, and identify the
ASEs significantly associated with survival (P < 0.05) (Fig. 3). Consequence analysis results indicated that there
were only two AP ASEs and ES had the most ASEs (17).
Scientific Reports | (2021) 11:4841 | https://doi.org/10.1038/s41598-021-84403-6 3
Vol.:(0123456789)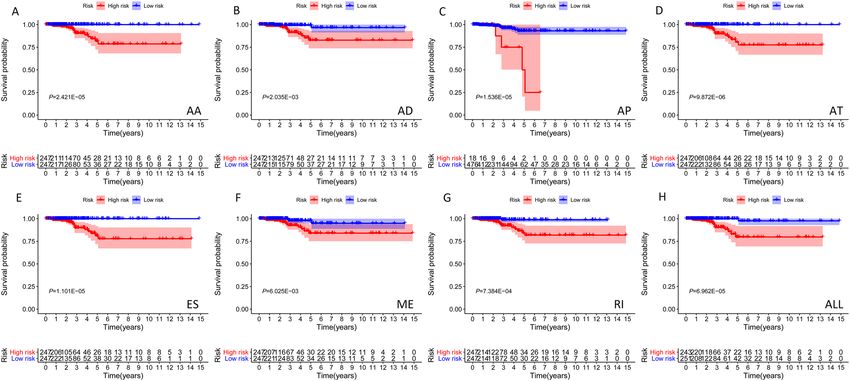
www.nature.com/scientificreports/

                                            Figure 2.  Bubble plots for subgroup analyses of survival associated ASEs in TC patients. (A–G) Forest plots of
                                            HRs for top 20 overall survival associated ASEs (AA, AD, AP, AT, ES, ME, and RI) in TC. (H) The volcano plot
                                            for prognosis-related ASEs.

                                            Figure 3.  Lasso cox regression algorithm of ASEs in TC patients. (A–H) Lasso cox regression algorithm based
                                            cross validation plots for the seven AS events; AA, AD, AP, AT, ES, ME, RI, and ALL events in TC.

                                            Prognostic predictors of ASEs in TCGA‑TC.              Figure 4 shows the seven prognostic models with signifi-
                                            cant prognostic predictive value for TC derived using different types of ASEs. The ROC curve revealed that AA
                                            (AUC: 0.937), AD (AUC: 0.965), AT (AUC: 0.964), ES (AUC: 0.999), ME (AUC: 0.999), and RI (AUC: 0.837) can
                                            predict the development of TC. Moreover, the integrated prediction model for TC exhibited an AUC of 0.882.
                                            Overall, aberrant active ASEs was a specific event in TC since most models exhibited a relatively high specificity
                                            value. Figures S1–S8 highlights various prognostic signatures for TC, with results showing that TC’s mortality
                                            rate was higher in the high-risk groups. Univariate and multivariate cox regression analyses indicated that the
                                            hazard ratios (HRs) for AS-ALL were 2.798 (95% CI: 2.286–3.424) and 2.603 (95% CI: 2.108–3.215), respectively
                                            (Fig. 5A,B). The samples were then divided into high‐ and low‐AS-ALL groups in order to distinguish the poten-

          Scientific Reports |   (2021) 11:4841 |                https://doi.org/10.1038/s41598-021-84403-6                                                   4

Vol:.(1234567890)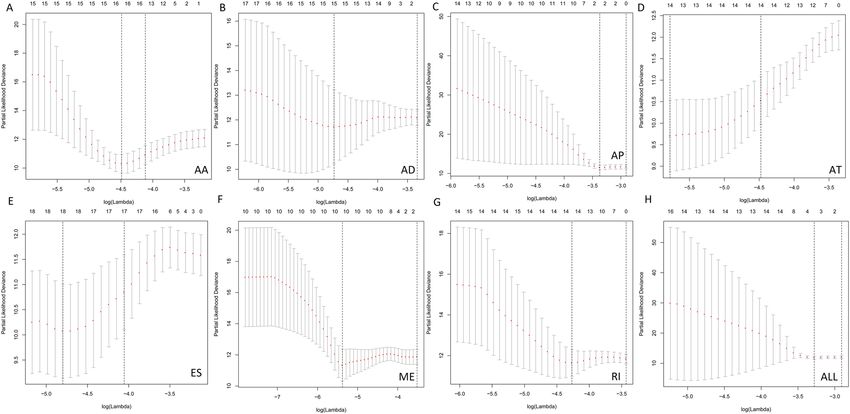
www.nature.com/scientificreports/

                                  Figure 4.  Kaplan–Meier curves for prognostic predictors of TC. (A–G) Kaplan–Meier plot for the survival
                                  probability over time for the prognostic predictor of the seven types of AS events in high (red) and low (blue)
                                  risk groups. (H) Kaplan–Meier plot for the survival probability over time for the final prognostic predictor with
                                  high (red) and low (blue) risk group.

                                  Figure 5.  Cox regression analysis for OS-associated clinical features of ALL ASEs. (A) Univariate analysis; (B)
                                  Multivariate analysis. (T tumor; N lymph node; and M metastasis).

                                  tial function and elucidate the significant survival difference using GSEA. GSEA results revealed that AS-ALL
                                  were mainly up-regulated in tumor and immune-related signaling pathway (Table 2).

                                  Correlation between TC‑ASEs and SFs expression. Univariate cox regression analysis identified 90
                                  SFs associated with OS of TC patients (Table S2). Cytoscape correlation plots further revealed that the expres-
                                  sion of 90 survival-associated SFs (triangular nodes) was associated with 469 TC-ASEs, of which, 260 were

Scientific Reports |   (2021) 11:4841 |                https://doi.org/10.1038/s41598-021-84403-6                                                     5

                                                                                                                                             Vol.:(0123456789)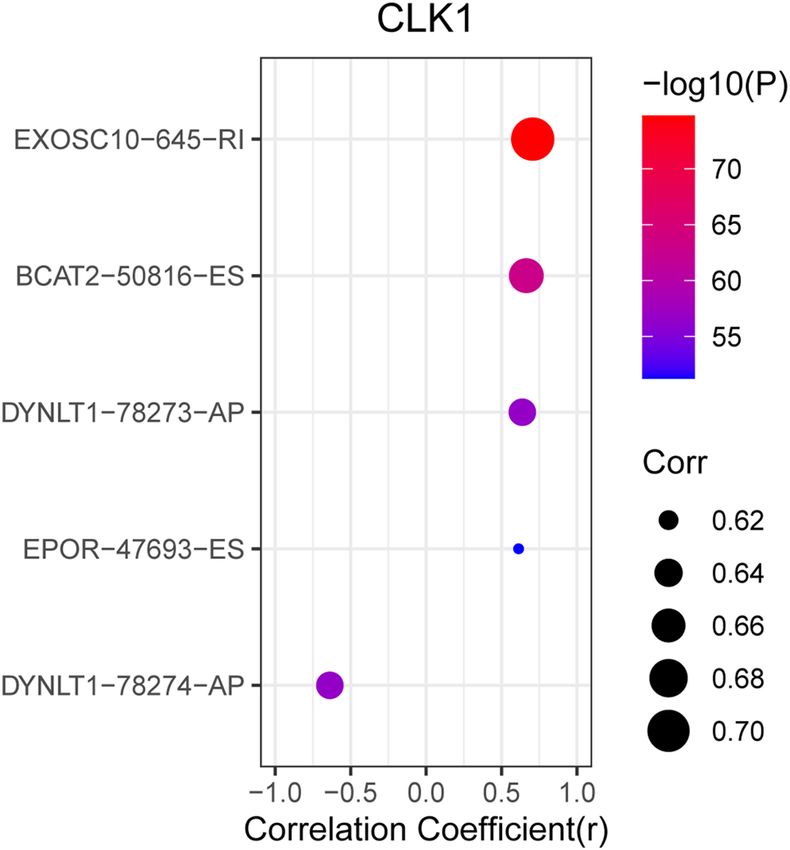
www.nature.com/scientificreports/
Gene set name Size NES NOM p-val FDR q-val
KEGG_APOPTOSIS 87 − 1.914 0 0.012
KEGG_LEISHMANIA_INFECTION 70 − 1.815 0 0.036
KEGG_B_CELL_RECEPTOR_SIGNALING_PATHWAY 75 − 1.772 0 0.053
KEGG_LEUKOCYTE_TRANSENDOTHELIAL_MIGRATION 116 − 1.757 0.0049 0.054
KEGG_TOLL_LIKE_RECEPTOR_SIGNALING_PATHWAY 102 − 1.750 0.0034 0.046
KEGG_RIG_I_LIKE_RECEPTOR_SIGNALING_PATHWAY 70 − 1.723 0.0034 0.062
KEGG_T_CELL_RECEPTOR_SIGNALING_PATHWAY 108 − 1.722 0.0016 0.053
KEGG_CHEMOKINE_SIGNALING_PATHWAY 188 − 1.701 0.0109 0.065
KEGG_CHRONIC_MYELOID_LEUKEMIA 73 − 1.681 0.0073 0.077
KEGG_NATURAL_KILLER_CELL_MEDIATED_CYTOTOXICITY 132 − 1.678 0.0083 0.073
Table 2. Gene sets enriched in phenotype low. NES normalized enrichment score; NOM nominal; FDR false
discovery rate.
Figure 6. Correlation analysis between splicing factor expression and TC-ASEs. Triangles represent the splicing
factors, while the oval nodes represent the TC-ASEs. Red ovals represent TC-ASEs associated with better OS,
whereas the green ovals represent OS-ASEs associated with poor OS. The blue and red lines represent TC-ASEs
associated with both better and poor OS.
associated with poor OS (green ovals) and 209 were associated with better OS (red ovals). Most of the ASEs
associated with better OS down-regulated the expression of SFs (blue lines), whereas most of ASEs associated
with poor OS up-regulated the expression of SFs (red lines). The 10 most significant SFs were HSPB1, ZC3H11A,
NOSIP, SNRPB, SNRPF, WDR83, ZNF346, THOC6, FAM50A, and CLK1 (Fig. 6). SF NOSIP was positively cor-
related with the PSI of CABIN1-61386-AP but negatively correlated with that of HAS3-37253-AT. In addition, SF
ZNF346 demonstrated different connection between different ASEs types of the same gene (PCNA) (P < 0.001).
This implies that SFs regulate different ASEs. The expression of these 10 SFs among normal and thyroid tumor
tissues based on GEPIA are shown in Fig. 7. Our results indicated that there was a high expression of CLK1 in
normal tissue and the obtained correlation scatter plots are shown in Fig. 8. The plug-in Molecular Complex
Detection (MCODE) package in Cytoscape identified UBL5 and PTCD2-72456-AT as hub genes or an AS event
with degrees ≥ 10.
Scientific Reports | (2021) 11:4841 | https://doi.org/10.1038/s41598-021-84403-6 6
Vol:.(1234567890)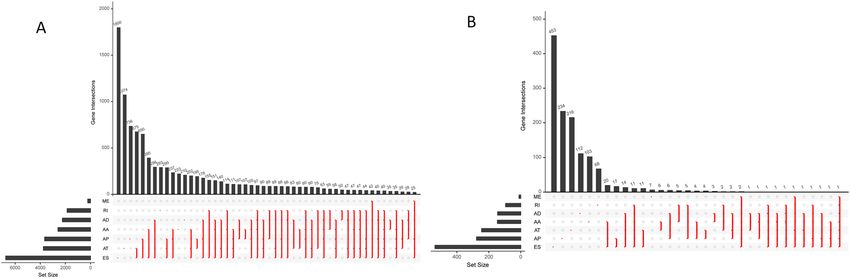
www.nature.com/scientificreports/
Figure 7. The expression of 10 SFs among normal and thyroid tumor tissues based on G EPIA29. The red box
indicates tumor and the gray box indicates normal. We used log2 (TPM + 1) for y-axis log-scale, and one-way
ANOVA for differential analysis using disease state (Tumor or Normal) as the variable for calculating differential
expression. An asterisk indicates statistical significance, and each dot represents a distinct tumor or normal
sample. (TPM: Transcripts Per Million).
Figure 8. The correlation between CLK1 and ASEs.
Scientific Reports | (2021) 11:4841 | https://doi.org/10.1038/s41598-021-84403-6 7
Vol.:(0123456789)www.nature.com/scientificreports/
Discussion
Alternative splicing is a critical biological process which is involved in the production of numerous proteins.
Aberrant ASEs in cancers are associated with cancer initiation and progression. Elucidation of the regulatory
networks between ASEs and SFs is complicated by the fact that a gene can undergo various types of ASEs and
can be regulated by a variety of SFs. This study identified ASEs and regulatory SFs in TC through the analysis of
the TCGA program with the overarching goal of providing comprehensive knowledge into various RNA splicing
patterns. Consequently, 1819 AS signatures were identified as being significantly associated with the OS of TC
patients. Of the 469 OS-ASEs, 209 were linked with favorable OS and 260 with poor OS.
Recently, researchers have focused on aberrant regulation of AS in various tumors. Kozlovski et al.30 reported
that AS serves as a molecular switch in many types of cancer by altering metabolism including regulation of
the metabolic mTOR pathway and glycolytic pathway/TCA cycle in order to drive tumorigenesis. In addition,
AS may significantly alter the coding region of drug targets, thereby leading to increased drug resistance in
some cancer t herapies31, such as BCR-ABL splice variant, imatinib resistance; BCL2-Like 11 (BIM or BCL2L11)
splice variant and TKI resistance; BRCAsplice variants leading to PARP inhibitor or cytotoxic drug resistance;
and TP53 splice variants and cisplatin r esistance32. Over the last few years, an increasing number of AS events
have been implicated in the progression of many types of cancers. SRSF1 (also known as SF2/ASF) was the first
SF to be identified as a proto-oncogene in human tumors. Studies have reported that SRSF1 is up-regulated in
various types of human tumors including colon, thyroid, breast, kidney, small intestine, and lung c ancers33,34.
Piqué et al.35 reported that the splicing RNA-binding protein CELF2 is targeted by promoter hypermethylation-
linked transcriptional silencing in breast cancer. On the other hand, Duan et al.36 proposed that aberrant splicing
variants are involved in renal cell cancer. Alternative splicing was also found to regulate some apoptotic genes.
Moreover, the BCL2L1 pre-mRNA is associated with greater tumor cell survival in various cancer types including
human lymphoma, breast cancer, prostate cancer, and human hepatocellular c arcinoma37,38. A previous study
found that AS of HIV-1 mRNAs increases viral coding potential, and controls the levels and timing of gene
expression39. However, the previous studies have not fully explored the role of AS in thyroid cancer. Therefore,
we aimed at elucidating the combination of splicing and clinical parameters, and potential mechanism of the
survival-related ASEs in TC.
We downloaded seven types of AS from the TCGA SpliceSeq database. In total, there were 10,446 genes and
45,150 AS events in 506 TC patients, indicating that ASEs are universal in TC. Moreover, 1819 AS signatures
were identified as being significantly associated with the OS of TC patients. Among the seven types of ASES, ES
was the most common, followed by AP and AT. We also identified the top 20 significant survival-related ASEs
of the seven AS types. Prognostic models were constructed based on risk score and ASEs types (AA, AP, AD,
AT, ES, ME, RI, and ALL) in order to evaluate the diagnostic significance of aberrant ASEs in the prognosis of
TC. We then plotted Kaplan–Meier survival curves of risk score and the risk scores of each type of ASEs. The
results show that seven types of ASEs were associated with poor prognosis in TC patients (P < 0.05). We also used
ROC curves to determine whether AS patterns can be used as an early predictor of the incidence of TC. Results
indicated that AA (AUC: 0.937), AD (AUC: 0.965), AT (AUC: 0.964), ES (AUC: 0.999), ME (AUC: 0.999), and
RI (AUC: 0.837) all had an AUC > 0.6, of which, ES and ME best predicted the incidence of TC. Moreover, the
integrated predictor model of TC showed an AUC of 0.882. Cox regression was used to explore the impacts of
clinicopathological parameters and risk scores on the prognosis of TC patients, with results indicating that age
and risk score (All) were the risk factors for TC patients. We also investigated whether TC-ASEs are regulated by
various SFs. The results showed that the expression of 90 SFs was associated with the OS of 469 ASEs in the TC
cohort. The 10 most significant relations between genes and SFs were HSPB1, ZC3H11A, NOSIP, SNRPB, SNRPF,
WDR83, ZNF346, THOC6, FAM50A, and CLK1. In addition, UBL5 and PTCD2-72456-AT were identified as hub
genes or AS events with degrees ≥ 10. Previous studies have reported that UBL5 plays an evolutionarily conserved
role in pre-mRNA splicing, the integrity of which is important for the fidelity of chromosome s egregation40.
Xu et al.41 found that the PTCD2 protein regulates the processing of RNA transcripts involving cytochrome b
derived from mitochondrial DNA. Our findings provide detailed information about the mechanisms through
which ASEs function in TC development and progression.
Conclusions
Although this study had some limitations (e.g. lack of therapeutic strategies, small sample size, TC subtype
research, and lack of validation experiments), we have shown that ASEs are frequent in TC and are associated
with patient prognosis. These ASEs may be part of a prognostic signature in TC. Our findings may provide a basis
for splicing perturbations in TC and related SFs that might be implicated in these modifications. In addition,
the methods used in this study can provide novel perspectives in other fields of tumor study, thereby enhancing
future oncology research.
Data availability
RNA-seq data and corresponding clinical data were acquired from the data portal for TCGA (https://portal.gdc.
cancer.gov/).
Received: 7 September 2020; Accepted: 16 February 2021
References
1. Wang, T. S. & Sosa, J. A. Thyroid surgery for differentiated thyroid cancer-recent advances and future directions. Nat. Rev. Endo-
crinol. 14, 670–683 (2018).
Scientific Reports | (2021) 11:4841 | https://doi.org/10.1038/s41598-021-84403-6 8
Vol:.(1234567890)www.nature.com/scientificreports/
2. Mackenzie, E. J. & MortiMer, R. H. Thyroid nodules and thyroid cancer. Med. J. Aust 180, 242–247 (2004).
3. Jung, C. K. et al. The increase in thyroid cancer incidence during the last four decades is accompanied by a high frequency of BRAF
mutations and a sharp increase in RAS mutations. J. Clin. Endocrinol. Metab. 99, E276–E285 (2014).
4. Zhu, J. et al. MiR-506 suppresses papillary thyroid carcinoma cell proliferation and metastasis via targeting IL17RD. Eur. Rev. Med.
Pharmacol. Sci. 23(7), 2856–2862 (2019).
5. NiKiForova, M. N., ChiosEa, S. I. & NiKiForov, Y. E. MicroRNA expression profiles in thyroid tumors. Endocr. Pathol. 20, 85–91
(2009).
6. Veiga, L. H., Neta, G., Gschebrook-KilfoY, B., Ron, E. & Devesa, S. S. Thyroid cancer incidence patterns in Sao Paulo, Brazil, and
the U.S. SEER program, 1997–2008. Thyroid 23, 748–757 (2013).
7. Frohlich, E. & Wahl, R. The current role of targeted therapies to induce radioiodine uptake in thyroid cancer. Cancer Treat. Rev.
40, 665–674 (2014).
8. Nilsen, T. W. & Graveley, B. R. Expansion of the eukaryotic proteome by alternative splicing. Nature 463(7280), 457–463 (2010).
9. Singh, B. & Eyras, E. The role of alternative splicing in cancer. Transcription 8, 91–98 (2017).
10. Climente-González, H., Porta-Pardo, E., Godzik, A. & Eyras, E. The functional impact of alternative splicing in cancer. Cell Rep.
20(9), 2215–2226 (2017).
11. Oltean, S. & Bates, D. O. Hallmarks of alternative splicing in cancer. Oncogene 33(46), 5311–5318 (2014).
12. Frankiw, L., Baltimore, D. & Li, G. Alternative mRNA splicing in cancer immunotherapy. Nat. Rev. Immunol. 19(11), 675–687
(2019).
13. Kahles, A. et al. Comprehensive analysis of alternative splicing across tumors from 8,705 patients. Cancer Cell 34(2), 211-224.e6
(2018).
14. Zhang, Y. et al. Pan-cancer analysis of clinical relevance of alternative splicing events in 31 human cancers. Oncogene 38(40),
6678–6695 (2019).
15. Wang, E. T. et al. Alternative isoform regulation in human tissue transcriptomes. Nature 456, 470–476 (2008).
16. Liu, J. et al. Alternative splicing events implicated in carcinogenesis and prognosis of colorectal cancer. J. Cancer 9, 1754–1764
(2018).
17. Lin, P. et al. Systematic analysis of survival-associated alternative splicing signatures in gastrointestinal pan-adenocarcinomas.
EBioMedicine 34, 46–60 (2018).
18. Huang, Z. G., He, R. Q. & Mo, Z. N. Prognostic value and potential function of splicing events in prostate adenocarcinoma. Int. J.
Oncol. 53, 2473–2487 (2018).
19. He, R. Q. et al. Prognostic signature of alternative splicing events in bladder urothelial carcinoma based on spliceseq data from
317 cases. Cell Physiol. Biochem. 48, 1355–1368 (2018).
20. Xie, Z. C. et al. Prognostic alternative splicing signatures and underlying regulatory network in esophageal carcinoma. Am. J.
Transl. Res. 11(7), 4010–4028 (2019).
21. Wang, C. et al. Whole genome analysis and prognostic model construction based on alternative splicing events in endometrial
cancer. Biomed. Res. Int. 2019, 2686875 (2019).
22. Chen, Q. F., Li, W., Wu, P., Shen, L. & Huang, Z. L. Alternative splicing events are prognostic in hepatocellular carcinoma. Aging
(Albany NY). 11(13), 4720–4735 (2019).
23. Lin, P. et al. Role of global aberrant alternative splicing events in papillary thyroid cancer prognosis. Aging (Albany NY). 11(7),
2082–2097 (2019).
24. Ryan, M. et al. TCGASpliceSeq a compendium of alternative mRNA splicing in cancer. Nucleic Acids Res. 44(D1), D1018–D1022
(2016).
25. Seiler, M. et al. Somatic mutational landscape of splicing factor genes and their functional consequences across 33 cancer types.
Cell Rep. 23(1), 282–296 (2018).
26. Conway, J. R., Lex, A. & Gehlenborg, N. UpSetR: an R package for the visualization of intersecting sets and their properties. Bio-
informatics 33, 2938–2940 (2017).
27. Sauerbrei, W., Royston, P. & Binder, H. Selection of important variables and determination of functional form for continuous
predictors in multivariable model building. Stat. Med. 26, 5512–5528 (2007).
28. Hu, X. et al. Multigene signature for predicting prognosis of patients with 1p19q codeletion diffuse glioma. Neuro Oncol. 19,
786–795 (2017).
29. Tang, Z., Kang, B., Li, C., Chen, T. & Zhang, Z. GEPIA2: An enhanced web server for large-scale expression profiling and interac-
tive analysis. Nucleic Acids Res. 47(W1), W556–W560 (2019).
30. Kozlovski, I., Siegfried, Z., Amar-Schwartz, A. & Karni, R. The role of RNA alternative splicing in regulating cancer metabolism.
Hum. Genet. 136(9), 1113–1127 (2017).
31. Wojtuszkiewicz, A. et al. Pre-mRNA splicing in cancer: The relevance in oncogenesis, treatment and drug resistance. Expert Opin.
Drug Metab. Toxicol. 11(5), 673–689 (2015).
32. Wang, B. D. & Lee, N. H. Aberrant RNA splicing in cancer and drug resistance. Cancers 10(11), 458 (2018).
33. Ghigna, C. et al. Cell motility is controlled by SF2/ASF through alternative splicing of the Ron protooncogene. Mol. Cell 20, 881–890
(2005).
34. Karni, R. et al. The gene encoding the splicing factor SF2/ASF is a proto-oncogene. Nat. Struct. Mol. Biol. 14, 185–193 (2007).
35. Piqué, L. et al. Epigenetic inactivation of the splicing RNA-binding protein CELF2 in human breast cancer. Oncogene 38(45),
7106–7112 (2019).
36. Duan, Y. & Zhang, D. Identification of novel prognostic alternative splicing signature in papillary renal cell carcinoma. J. Cell
Biochem. 12, 672–689 (2020).
37. Takehara, T., Liu, X., Fujimoto, J., Friedman, S. L. & Takahashi, H. Expression and role of Bcl-xL in human hepatocellular carci-
nomas. Hepatology 34, 55–61 (2001).
38. Mercatante, D. R., Mohler, J. L. & Kole, R. Cellular response to an antisense-mediated shift of Bcl-x pre-mRNA splicing and anti-
neoplastic agents. J. Biol. Chem. 277, 49374–49382 (2002).
39. Kutluay, S. B. et al. Genome-wide analysis of heterogeneous nuclear ribonucleoprotein (hnRNP) binding to HIV-1 RNA reveals
a key role for hnRNP H1 in alternative viral mRNA splicing. J. Virol. 93(21), e01048-e1119 (2019).
40. Oka, Y. et al. UBL5 is essential for pre-mRNA splicing and sister chromatid cohesion in human cells. EMBO Rep. 15(9), 956–964
(2014).
41. Xu, F. et al. Disruption of a mitochondrial RNA-binding protein gene results in decreased cytochrome b expression and a marked
reduction in ubiquinol-cytochrome c reductase activity in mouse heart mitochondria. Biochem. J. 416(1), 15–26 (2008).
Author contributions
W.Z.H. designed and analyzed the research study; W.Z.H. and T.Y. wrote and revised the manuscript, W.Z.H.
and Z.Y. collected the data and all authors have read and approved the manuscript.
Scientific Reports | (2021) 11:4841 | https://doi.org/10.1038/s41598-021-84403-6 9
Vol.:(0123456789)www.nature.com/scientificreports/
Funding
This work is not supported by grants.
Competing interests
The authors declare no competing interests.
Additional information
Supplementary Information The online version contains supplementary material available at https://doi.
org/10.1038/s41598-021-84403-6.
Correspondence and requests for materials should be addressed to Y.Z.
Reprints and permissions information is available at www.nature.com/reprints.
Publisher’s note Springer Nature remains neutral with regard to jurisdictional claims in published maps and
institutional affiliations.
Open Access This article is licensed under a Creative Commons Attribution 4.0 International
License, which permits use, sharing, adaptation, distribution and reproduction in any medium or
format, as long as you give appropriate credit to the original author(s) and the source, provide a link to the
Creative Commons licence, and indicate if changes were made. The images or other third party material in this
article are included in the article’s Creative Commons licence, unless indicated otherwise in a credit line to the
material. If material is not included in the article’s Creative Commons licence and your intended use is not
permitted by statutory regulation or exceeds the permitted use, you will need to obtain permission directly from
the copyright holder. To view a copy of this licence, visit http://creativecommons.org/licenses/by/4.0/.
© The Author(s) 2021
Scientific Reports | (2021) 11:4841 | https://doi.org/10.1038/s41598-021-84403-6 10
Vol:.(1234567890)You can also read