AN AGENT-BASED MODEL OF THE LOCAL SPREAD OF SARS-COV-2: MODELING STUDY
←
→
Page content transcription
If your browser does not render page correctly, please read the page content below
JMIR MEDICAL INFORMATICS                                                                                                                  Staffini et al

     Original Paper

     An Agent-Based Model of the Local Spread of SARS-CoV-2:
     Modeling Study

     Alessio Staffini1,2,3, MSc; Akiko Kishi Svensson3,4,5, MD, PhD; Ung-Il Chung3,6,7, MD, PhD; Thomas Svensson3,4,6,
     MD, PhD
     1
      Department of Economics and Finance, Catholic University of Milan, Milan, Italy
     2
      Project Promotion Department, ALBERT Inc, Tokyo, Japan
     3
      Precision Health, Department of Bioengineering, Graduate School of Engineering, The University of Tokyo, Tokyo, Japan
     4
      Department of Clinical Sciences, Lund University, Malmö, Sweden
     5
      Department of Diabetes and Metabolic Diseases, Graduate School of Medicine, The University of Tokyo, Tokyo, Japan
     6
      School of Health Innovation, Kanagawa University of Human Services, Tonomachi, Japan
     7
      Clinical Biotechnology, Center for Disease Biology and Integrative Medicine, Graduate School of Medicine, The University of Tokyo, Tokyo, Japan

     Corresponding Author:
     Alessio Staffini, MSc
     Precision Health, Department of Bioengineering
     Graduate School of Engineering
     The University of Tokyo
     7-3-1 Hongo, Bunkyo-ku
     Tokyo, 113-8655
     Japan
     Phone: 81 080 7058 1309
     Email: alessio.staffini@bocconialumni.it

     Abstract
     Background: The spread of SARS-CoV-2, originating in Wuhan, China, was classified as a pandemic by the World Health
     Organization on March 11, 2020. The governments of affected countries have implemented various measures to limit the spread
     of the virus. The starting point of this paper is the different government approaches, in terms of promulgating new legislative
     regulations to limit the virus diffusion and to contain negative effects on the populations.
     Objective: This paper aims to study how the spread of SARS-CoV-2 is linked to government policies and to analyze how
     different policies have produced different results on public health.
     Methods: Considering the official data provided by 4 countries (Italy, Germany, Sweden, and Brazil) and from the measures
     implemented by each government, we built an agent-based model to study the effects that these measures will have over time on
     different variables such as the total number of COVID-19 cases, intensive care unit (ICU) bed occupancy rates, and recovery and
     case-fatality rates. The model we implemented provides the possibility of modifying some starting variables, and it was thus
     possible to study the effects that some policies (eg, keeping the national borders closed or increasing the ICU beds) would have
     had on the spread of the infection.
     Results: The 4 considered countries have adopted different containment measures for COVID-19, and the forecasts provided
     by the model for the considered variables have given different results. Italy and Germany seem to be able to limit the spread of
     the infection and any eventual second wave, while Sweden and Brazil do not seem to have the situation under control. This
     situation is also reflected in the forecasts of pressure on the National Health Services, which see Sweden and Brazil with a high
     occupancy rate of ICU beds in the coming months, with a consequent high number of deaths.
     Conclusions: In line with what we expected, the obtained results showed that the countries that have taken restrictive measures
     in terms of limiting the population mobility have managed more successfully than others to contain the spread of COVID-19.
     Moreover, the model demonstrated that herd immunity cannot be reached even in countries that have relied on a strategy without
     strict containment measures.

     (JMIR Med Inform 2021;9(4):e24192) doi: 10.2196/24192

     https://medinform.jmir.org/2021/4/e24192                                                              JMIR Med Inform 2021 | vol. 9 | iss. 4 | e24192 | p. 1
                                                                                                                     (page number not for citation purposes)
XSL• FO
RenderX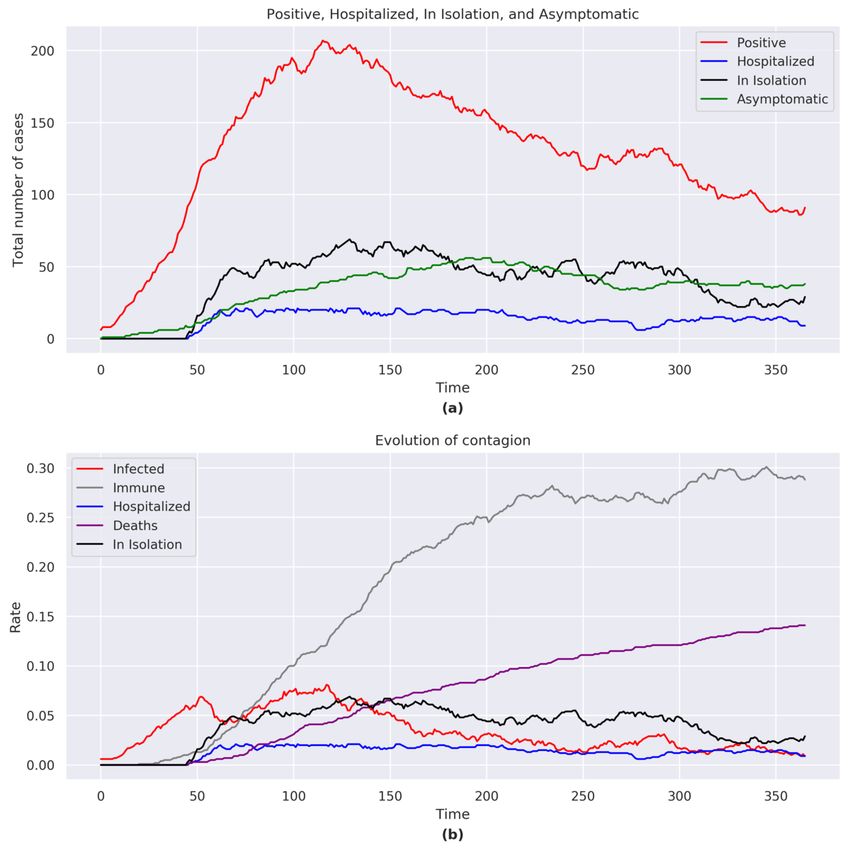
JMIR MEDICAL INFORMATICS                                                                                                              Staffini et al

     KEYWORDS
     computational epidemiology; COVID-19; SARS-CoV-2; agent-based modeling; public health; computational models; modeling;
     agent; spread; computation; epidemiology; policy

                                                                            model that includes demographic information and
     Introduction                                                           nonpharmaceutical interventions, we considered a simplified
     The spread of communicable diseases across a population is a           network structure (specifically, a dynamic random network,
     spatial and temporal process, and the study of the transmission        where the edges are created and destroyed at each period t) with
     dynamics is becoming increasingly important for tackling the           a focus on capturing only the stylized facts for an immediate
     spread appropriately.                                                  evaluation of the effects of changes in model parameters and
                                                                            in policies.
     Agent-based models (ABMs) are a class of computational
     models based on computer simulations of actions and                    The time stamp (in days) of the model accurately reflects the
     interactions of autonomous agents, aimed at evaluating how             timing of the political decisions taken from the end of January
     these actions affect the system as a whole. The agent-based            to July 1, 2020, and the model studies the evolution of the virus
     approach emphasizes the importance of learning through the             from its appearance up to a year later. The parameters we
     agent-environment interaction. This approach is part of a recent       defined were derived from government policies, from real data
     trend in the computational models of learning toward developing        provided by the government bodies, and from medical
     new ways of studying autonomous organisms in virtual or real           knowledge about the virus up to July 1, 2020; beyond this date,
     environments.                                                          the model makes predictions of how the virus would have spread
                                                                            if all the considered variables would have followed the same
     ABMs have proven particularly useful for answering public              evolution (for example, maintaining the containment measures
     health–related questions that are typically unanswerable with          as of July 1 in the 4 countries). There was no knowledge at the
     the traditional epidemiological toolkit [1]. The use of ABMs           time about virus variants nor data about the vaccination
     for studying phenomena related to public health is not recent          campaign, so these have not been included.
     and has been used to study the spread of alcohol consumption
     [2] and eating disorders [3].                                          The hypothesis from which we start is that the spread of a virus
                                                                            depends, in addition to epidemiological factors and the nature
     Agent-based simulation modeling has been used primarily in             of the virus itself, on individual behavior or, more precisely, on
     epidemiological studies of infectious diseases, including the          political decisions that induce appropriate behavioral criteria.
     study of the reactions of the immune system during an infection        Our goal is to show how, through targeted measures, the damage
     [4], the spread of malaria following the movement of mosquitoes        caused by the spread of a pandemic can be limited, both in terms
     in a village in Niger [5], and following the trend of the influenza    of the case-fatality rate and pressure on hospitals.
     virus [6]. Additionally, ABMs have been used to study the trend
     of chronic diseases [7] and to analyze the public health impact        Methods
     of influenza vaccinations in the United States and their
     cost-effectiveness, simulating scenarios where different age           Overview of the Model
     groups of the population were vaccinated [8].                          We implemented the model using NetLogo (free and
     More recently, ABMs have been used in population-based                 open-source software, released under a GNU General Public
     studies of COVID-19, in particular to analyze the effects of           License; Rel. 6.1.0), a multi-agent programmable modeling
     population characteristics [9,10] and of public health measures        environment (source code available on GitHub [18]). The
     on the spread of SARS-CoV-2 [11,12]. The importance of                 simulation was performed using the data of 4 countries (Italy,
     ABMs in the face of a global pandemic is their ability to              Germany, Sweden, and Brazil) that have had different policy
     reproduce situations, starting from real data, otherwise not           approaches for the containment of SARS-CoV-2.
     reproducible in reality.                                               Italy was chosen in our analysis as it was the first country (after
     In this study, we propose an epidemiological ABM for analyzing         China) to report an important diffusion of the virus in its territory
     the propagation of an infectious disease in a network of human         and had to make new decisions and implement measures without
     contacts; in particular, our model studies the effects of political    having the possibility to compare their effectiveness with those
     decisions on the spread of SARS-CoV-2. Other works have                of other similar countries. Germany followed the example of
     been done studying this aspect [13-15], but the approach was           Italy but with a much higher execution speed, relying also on
     to simulate different pre-established situations (eg, implementing     a greater number of intensive care unit (ICU) beds (the highest
     containment measures or performing many diagnostic tests),             in Europe; Source: National Center for Biotechnology
     evaluating their impacts. A work similar to our study [16] starts      Information [19]). Sweden took a different approach from other
     from the same research questions and arrives at similar                European countries: it did not deny the presence and the
     conclusions but uses a completely different methodology. Our           potential consequences of the virus spread in its territory but
     study differs from the previous ones in that it analyzes the effects   decided not to impose any limitation to individual freedoms,
     of the measures adopted by the governments in real time as they        essentially aiming at obtaining herd immunity. Like Sweden,
     are implemented. An increasingly used ABM for modeling                 Brazil did not adopt national measures to contain the spread of
     COVID-19 is Covasim [17]; although we propose a similar                the virus, despite the high number of deaths that this has caused.

     https://medinform.jmir.org/2021/4/e24192                                                          JMIR Med Inform 2021 | vol. 9 | iss. 4 | e24192 | p. 2
                                                                                                                 (page number not for citation purposes)
XSL• FO
RenderX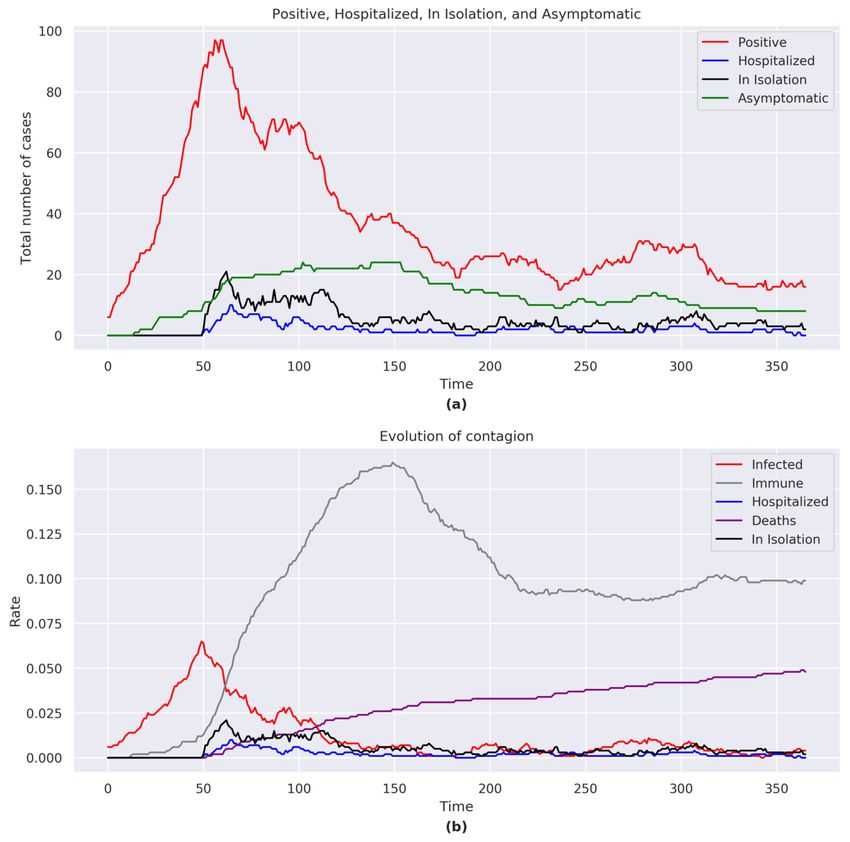
JMIR MEDICAL INFORMATICS                                                                                                                Staffini et al

     A more detailed description of the differences and the reasons        by government bodies (Table 1), key variables related to the
     that led us to choose these 4 countries can be found in               country, population, virus, and implemented policies were taken
     Multimedia Appendix 1.                                                into consideration. We provide a complete list of the measured
                                                                           variables (Table 2; several indexes are the proportional
     The model studied, through the interactions between healthy
                                                                           transformation of the values obtained from Table 1, defined in
     individuals and infected individuals, how the virus spread over
                                                                           the calibration phase of the model). We measured and
     time and how the actions implemented by governments
                                                                           demonstrated the results of how these variables evolved over
     influenced its propagation. Starting from objective data provided
                                                                           time.

     Table 1. Reference data used for constructing the model.
         Demographics                                           Data (%)   Notes
         Italy
             Older than 65 years                                22.60      Source: Eurostat [20]
             Beds for seriously ill patients                    0.26       Source: OECDa [21]
             Recovery rate                                      76.89      Source: World Health Organization [22]
             Case-fatality rate                                 14.55      Source: World Health Organization [22]
             Seriously ill                                      2.40       Source: Ministero della Salute [23]
             Hospitalization rate                               25.40      Source: Ministero della Salute [23]
             Not seriously ill                                  74.60      Source: Ministero della Salute [23]
         Germany
             Older than 65 years                                21.40      Source: Eurostat [20]
             Beds for seriously ill patients                    0.60       Source: OECD [24]
             Recovery rate                                      91.15      Source: World Health Organization [25]
             Case-fatality rate                                 4.67       Source: World Health Organization [25]
             Seriously ill                                      1.48       Source: Worldometer [26]
             Hospitalization rate                               6.20       Source: Worldometer [26]
             Not seriously ill                                  92.30      Source: Worldometer [26]
         Sweden
             Older than 65 years                                19.80      Source: Eurostat [20]
             Beds for seriously ill patients                    0.20       Source: OECD [27]
             Recovery rate                                      12.74      Source: Worldometer [26]
             Case-fatality rate                                 9.02       Source: World Health Organization [28]
             Seriously ill                                      2.55       Source: Worldometer [26]
             Hospitalization rate                               25.68      Source: Worldometer [26]
             Not seriously ill                                  69.30      Source: Worldometer [26]
         Brazil
             Older than 65 years                                8.60       Source: CIAb [29]
             Beds for seriously ill patients                    0.19       Source: AMIBc [30]
             Recovery rate                                      49.81      Source: World Health Organization [31]
             Case-fatality rate                                 4.65       Source: World Health Organization [31]
             Seriously ill                                      2.00       Source: Worldometer [26]
             Hospitalization rate                               8.00       Source: Worldometer [26]
             Not seriously ill                                  90.00      Source: Worldometer [26]

     a
         OECD: Organisation for Economic Co-operation and Development.
     b
         CIA: Central Intelligence Agency.
     c
         AMIB: Associação Medicina Intensiva Brasileira.

     https://medinform.jmir.org/2021/4/e24192                                                            JMIR Med Inform 2021 | vol. 9 | iss. 4 | e24192 | p. 3
                                                                                                                   (page number not for citation purposes)
XSL• FO
RenderX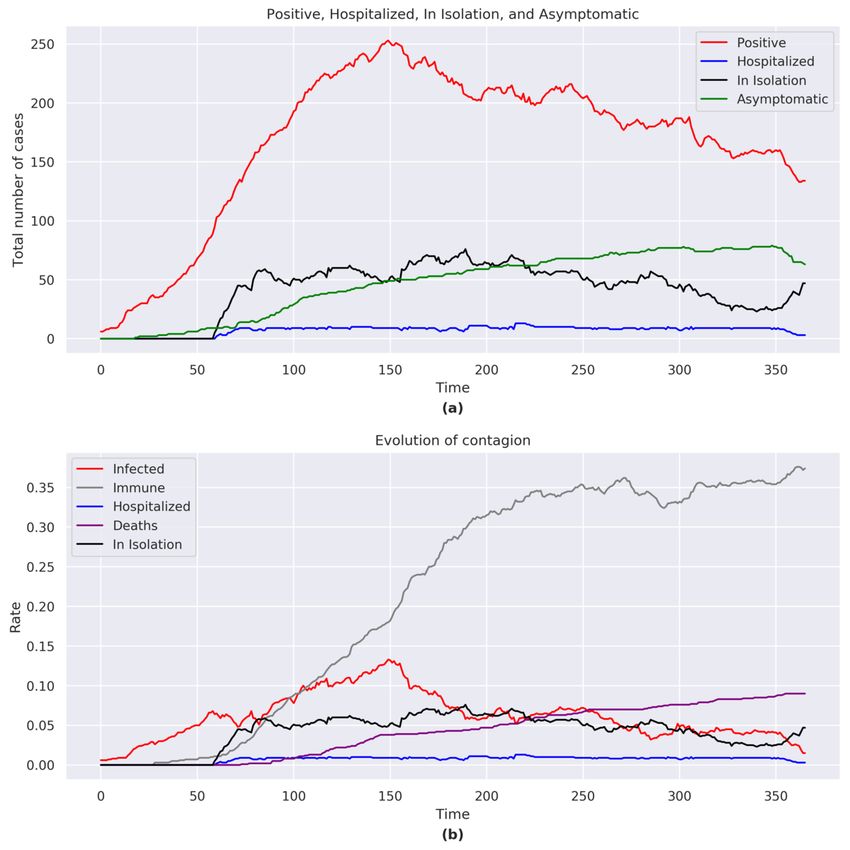
JMIR MEDICAL INFORMATICS Staffini et al
Table 2. List of the model variables.
Variables Italy Germany Sweden Brazil
Total population (units) 1000 1000 1000 1000
Older than 65 years (units) 230 210 200 90
Initial infectious people (units) 6 6 6 6
Transmissibility rate (%) 0.30 0.30 0.30 0.30
Immunity duration: mild cases (days) 100 100 100 100
Immunity duration: severe cases Lifetime Lifetime Lifetime Lifetime
Initial productivity index 2.0 2.0 2.0 2.0
Noncontagion index 0.01 0.01 0.01 0.01
Virus recognition After 100 cases After 60 cases After 100 cases After 100 cases
Beds for seriously ill patients (units) 13 30 20 9
Recovery index 5.0 6.0 1.5 2.5
Case-fatality index 0.8 0.3 0.4 0.3
Seriously ill index 1.5 1.0 1.5 1.3
Not seriously ill index 5.0 5.0 4.7 6.0
Mask use (decrease in transmissibility; %) 14.3 14.3 0 7.15
Physical distancing (decrease in transmissibility; %) 10.2 10.2 10.2 5.1
Infected tourists (max number; units) 2 2 1 1
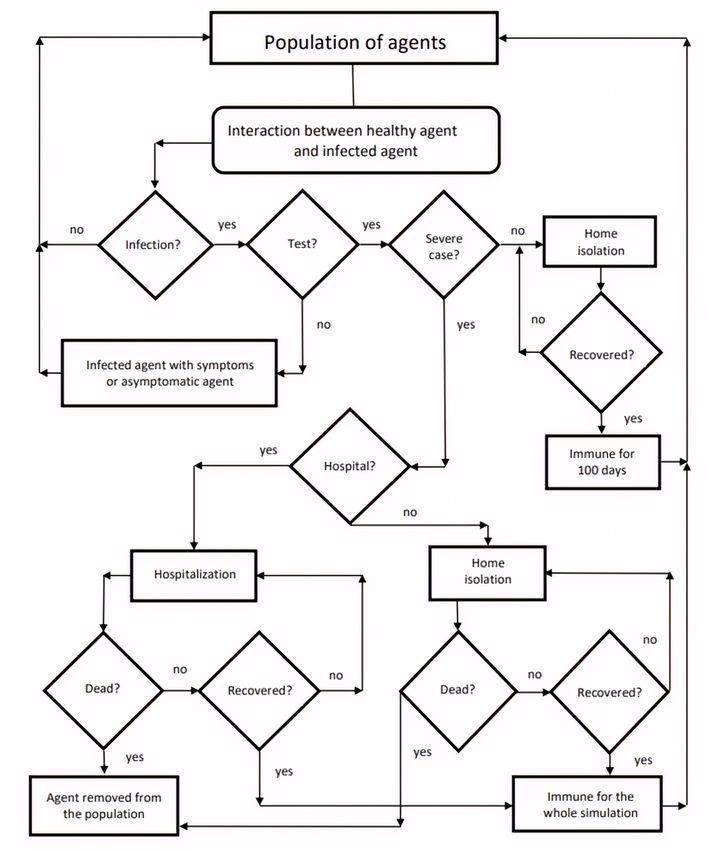
The following shows the (simplified) scheme followed by the
Description of the Model model. The total 1000 agents move randomly within the model
The model examined a sample of the population of each of the environment, simulating daily activities (eg, going to work or
4 countries, fixed at 1000 (i ∈ {1,2,...,1000}). It was similar to school); movement speed was set at a lower level (50%) for
a small neighborhood of a city where the characteristics of the older adult agents (older than 65 years), as they perform fewer
entire population are reproduced (the data we were interested activities (the number of older adults was modeled according
in are reported in Tables 1 and 2). We assumed that an outbreak to the national statistics, see Table 2). Among the agents, some
of COVID-19 has developed in this neighborhood. Naturally, are infected (we denoted them as Ii, and we fixed them at 6 at
government provisions were applied to this neighborhood as time t=0). Moving inside the environment, they come into
they were issued and with the same timing. contact with healthy agents. A healthy agent Hi has a certain
To better explain the logic behind our choices, we should probability P(I) ∈ [0,1] to be infected, defined by the following
imagine the considered space where the agents live as a equation:
laboratory where we applied the different policies, compliance
to nonpharmaceutical measures, health structures, knowledge P(I) = 1 – (1 – TR)n
about the virus, etc. The laboratory space and the number of where TR ∈ [0,1] is the transmissibility rate of the virus, and n
agents go beyond the geographical context, as they are meant is the number of infected neighbors; in our topology the number
to represent an exportable sample for each of the analyzed of infected agents present in a closed ball was determined by
countries. Only the different measures and country specifications B1 = {x ∈ R2:‖x-y‖≤1}, with radius 1 and center y ∈ R2,
influence the results obtained from the simulations. where the healthy agent Hi is located in time t. Notice that P(I)
The time span of the simulation was 1 year, divided into 365 is monotonically increasing with respect to TR and n.
daily cycles. The first cycle coincided with the first infections The propagation of the virus is not immediately recognized as
in the given country. such by the governments, and before this happens, the number
The initialization of the model (at time t=0) requires the loading of infected agents Ii exceeds a certain threshold (see virus
and setting of the required variables for the simulations and recognition in Table 2 for the country-specific threshold values).
analyses. The variables derived from the national and
After the virus is recognized, at each time t, we assume that
governmental bodies, as well as institutional sources for each
each infected agent and those who have come into contact with
country, were automatically loaded following country selection.
them have a probability P(test)=0.5 to perform a virus
In this phase, the model also set the time stamps in which
recognition test [32]. Therefore, half of them do not perform
political decisions were made with respect to the containment
the test and continue to move inside the model space becoming,
measures for the spread of SARS-CoV-2. After the initial
if infected, a symptomatic infected agent or an asymptomatic
setting, the model was ready to simulate the evolution of
infected one. Asymptomatic agents will perform the virus
COVID-19 for the selected country.
https://medinform.jmir.org/2021/4/e24192 JMIR Med Inform 2021 | vol. 9 | iss. 4 | e24192 | p. 4
(page number not for citation purposes)
XSL• FO
RenderX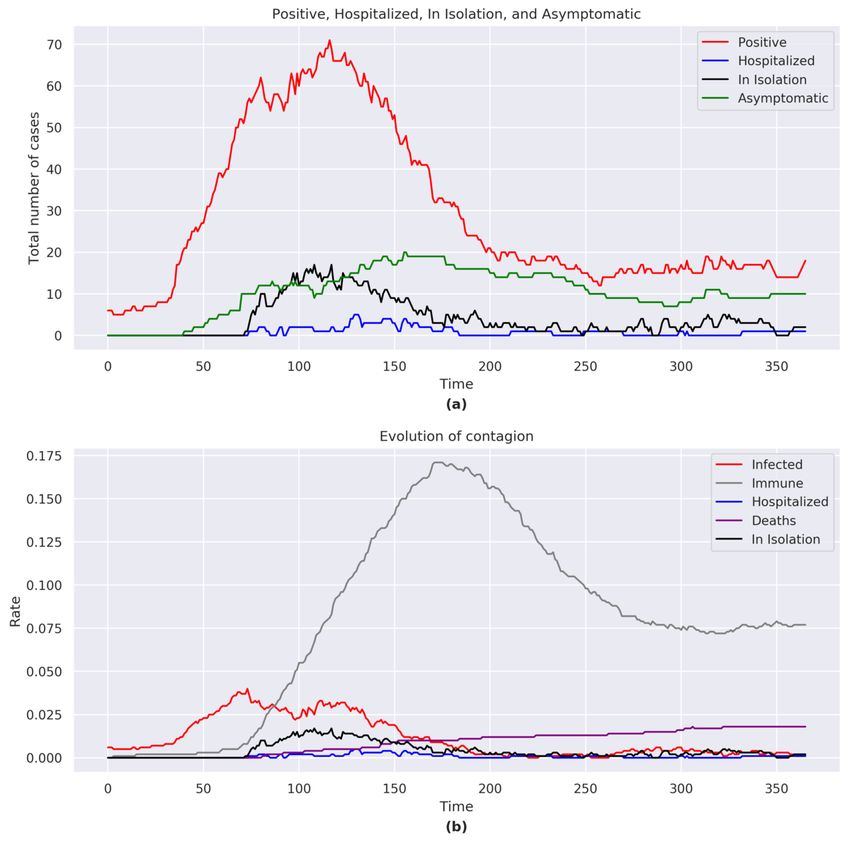
JMIR MEDICAL INFORMATICS                                                                                                              Staffini et al

     recognition test at the next period t + 1 only if they come into       Recovered agents develop antibodies to the virus (ie, they
     contact again with an infected agent, while symptomatic agents         become immune). We denoted the immune agents with IMi.
     will have the same constant probability P(test) to be tested in        For those who were seriously ill, we considered that their
     each period.                                                           antibodies lasted for the whole simulation, while those who
     Infected agents do not present symptoms immediately, but we            were mildly ill will develop an immunity that lasts only for 100
     considered that there is an incubation period that can vary            days [33] (see Table 2). Recent studies [34] confirm that there
     according to age. For individuals younger than 65 years, we set        is a difference in the duration of immunity, which depends on
     the incubation period according to a normal distribution with          the severity of the development of the disease.
     mean 7 (SD 2; IY ~ N(7,4)), while for those who are older than         We also considered noncontagious asymptomatic cases (ie,
     65 years, the incubation period is defined according to a normal       there is a small proportion of healthy individuals who, following
     distribution with mean 3 (SD 1; IO ~ N(3,1)).                          infection, immediately develop antibodies without showing
                                                                            symptoms and never become carriers of the virus). They
     The viral load, and therefore the ability to infect other agents,      transition from Hi in t to IMi in t +1 and are not counted as Ii.
     has not been set the same for all of the Ii agents. For those who
                                                                            Notice that in each t, the sum of all the agents (healthy, infected,
     are in the incubation phase, the viral load is lower, and it           immune, and dead) is equal to 1000.
     increases period by period as the development of the infection
     approaches; for asymptomatic agents, it is lower than for agents       The industrial productivity (economic index) is proportional to
     with mild symptoms, who in turn, will have it lower than               the mobility of the agents. By setting the prepandemic level to
     seriously ill agents (that will need to be hospitalized).              0, the reduced mobility of the agents will lead to a decrease in
                                                                            productivity.
     Infected agents Ii can therefore be of four types: in incubation,
     asymptomatic, mildly ill, and seriously ill (see Tables 1 and 2).      Figure 1 shows a simplified flowchart of the mechanisms
     The mildly ill, when found, are isolated at home; in our model,        previously described.
     this translates to their mobility being set to 0 (but they can still   Political decisions were then applied to this scheme, according
     spread the virus). The seriously ill, when found, will be              to the times and the ways they have been implemented by the
     hospitalized, and their mobility will also be set to 0.                governments of the analyzed countries. Thus, for example, the
     Furthermore, the latter are to be considered in an isolated space,     decision of closing schools will lead to a reduction in the initial
     so we also considered that they will not spread the virus              mobility of the agents; a lockdown of nonessential activities
     anymore.                                                               will further reduce it (with negative repercussions on industrial
     If ICU beds (see beds for seriously ill patients in Table 2) are       productivity, but a positive result in terms of limiting the spread
     saturated, seriously ill patients will be placed in home isolation     of the contagion). The adoption of precautions or medical aids
     (with mobility at 0), but their probability of recovery (see Tables    was translated into the model as a decrease in the transmissibility
     1 and 2) decreases.                                                    rate (see Table 2). We analyzed only a small sample of the
                                                                            population; therefore, in the rest of this study, the political
     Seriously ill patients can die with a probability equal to that        decision of closing the national borders was translated into a
     listed in Table 1 (case-fatality rate) and Table 2 (case-fatality      further limitation on the mobility of agents, while their
     index). For older adults, this probability is higher (we consider      reopening was simulated as a partial restoration of the original
     their greater fragility and the possible presence of other existing    mobility and the introduction of new infected agents (see
     pathologies). Dead agents are denoted with Di; we set both their       infected tourists in Table 2).
     mobility and their transmissibility rate to 0.
                                                                            A more detailed explanation of the parameters and the variables
     Ill patients can recover with a probability equal to that listed in    we used can be found in Multimedia Appendix 1.
     Table 1 (recovery rate) and Table 2 (recovery index).

     https://medinform.jmir.org/2021/4/e24192                                                          JMIR Med Inform 2021 | vol. 9 | iss. 4 | e24192 | p. 5
                                                                                                                 (page number not for citation purposes)
XSL• FO
RenderX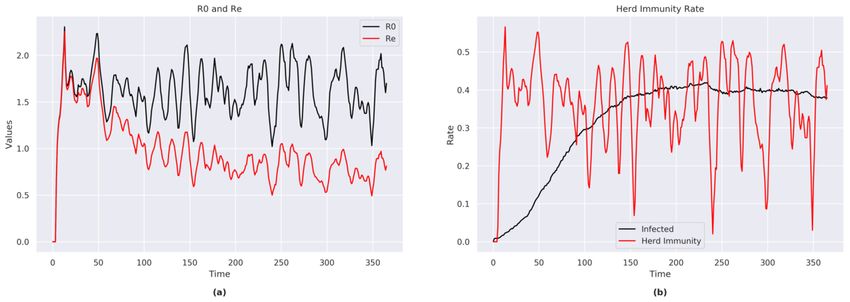
JMIR MEDICAL INFORMATICS                                                                                                               Staffini et al

     Figure 1. Simplified flowchart of interaction mechanisms in the model.

                                                                              Italy
     Results
                                                                              The simulation recorded 309 cases of COVID-19 with 243
     It should be remembered that the reported results were obtained          recoveries and 48 deaths. The case-fatality rate was 15%
     considering the government measures in force until July 1, 2020;         (48/309), with an older adult (older than 65 years) case-fatality
     from this date onward, the forecasts are based on the last known         rate of 65% (31/48).
     measures being kept in place. In the summer of 2020, individual
     behavior and governments’ attitudes were not so strict: therefore,
     despite the model correctly forecasting a second wave, such
     forecasts were underestimated.

     https://medinform.jmir.org/2021/4/e24192                                                           JMIR Med Inform 2021 | vol. 9 | iss. 4 | e24192 | p. 6
                                                                                                                  (page number not for citation purposes)
XSL• FO
RenderX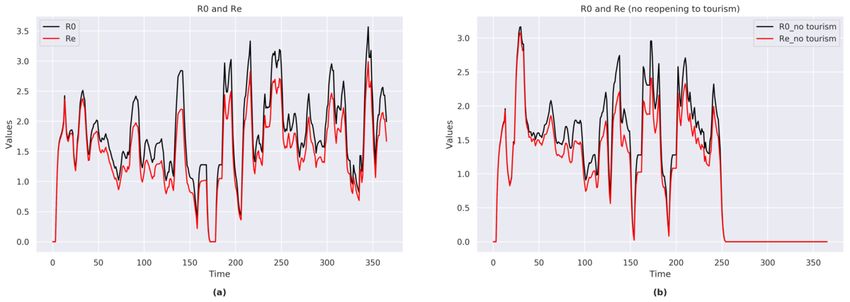
JMIR MEDICAL INFORMATICS                                                                                                                        Staffini et al

     Total Number of COVID-19 Cases, Hospitalizations,                             exponentially with a peak at t=61 (Figure 2a). In the second
     Isolations, and Asymptomatic Infections                                       half of the simulation (t=279), the number of COVID-19 cases
                                                                                   rose but never reached the height of the initial peak.
     At the end of the simulation, the total number of positives was
     17, including 8 asymptomatic, 2 in home isolation, and 0                      The total number of hospitalizations and home isolations reached
     hospitalizations. The number of COVID-19 cases rose                           a peak at t=64.
     Figure 2. (a) Positive, hospitalized, in isolation, and asymptomatic figures for Italy. (b) Evolution of the contagion for Italy. The graphs consider the
     sum of the agents belonging to each category shown in the legend for each day of the simulation.

                                                                                   R0 and RE
     Immunity and Case Fatality
     The proportion of individuals who acquired immunity reached                   The trends of R0 (range 0-3.5) and RE (range 0-3.0) exhibited
     a peak of 16.5% (165/1000) at t=150, albeit with an immunity                  strong fluctuations during the time span of the simulation (Figure
     of 10% (99/1000) at the end of the simulation (Figure 2b). The                3a).
     case-fatality rates increased throughout the simulation despite               A sensitivity analysis conducted in a simulation that assumed
     a decreasing number of cases. At the end of the simulation, the               that national borders remained closed (Figure 3b) showed that
     case-fatality rate was 4.8% (48/1000).                                        no new cases occurred once the no contagion value was reached,
                                                                                   and the borders remained closed.

     https://medinform.jmir.org/2021/4/e24192                                                                    JMIR Med Inform 2021 | vol. 9 | iss. 4 | e24192 | p. 7
                                                                                                                           (page number not for citation purposes)
XSL• FO
RenderX
JMIR MEDICAL INFORMATICS Staffini et al
Figure 3. (a) R0 and Re indexes for Italy (with national borders reopening). (b) R0 and Re indexes for Italy (with no national borders reopening).
Total Number of COVID-19 Cases, Hospitalizations,
Herd Immunity, ICU Beds, and Productivity
Home Isolations, and Asymptomatic Infections
The model showed that immunity was reached in approximately
11% (116/ 1000) of the population. At the end of the simulation, the total number of positive cases
was 19, including 10 asymptomatic, 2 in home isolation, and 1
The simulation indicated that the ICU beds were never saturated; hospitalized. The number of COVID-19 cases rose rapidly with
although at t=66, the occupancy rate reaches 77% (10/13). a peak at t=117 (Figure 4a). After the peak and following the
The model showed a sharp drop in productivity following the adopted containment measures, the number of COVID-19 cases
implementation of containment measures, and the loss in gradually decreased.
productivity at its maximum reached –18.7% (compared to the The total number of hospitalizations and home isolations reached
prepandemic value of 0). a peak around t=110.
Germany
The simulation recorded 270 cases of COVID-19 with 233
recoveries and 18 deaths. The case-fatality rate was 6.7%
(18/270), with an older adult case-fatality rate of 61% (11/18).
https://medinform.jmir.org/2021/4/e24192 JMIR Med Inform 2021 | vol. 9 | iss. 4 | e24192 | p. 8
(page number not for citation purposes)
XSL• FO
RenderXJMIR MEDICAL INFORMATICS Staffini et al
Figure 4. (a) Positive, hospitalized, in isolation, and asymptomatic figures for Germany. (b) Evolution of the contagion for Germany. The graphs
consider the sum of the agents belonging to each category shown in the legend for each day of the simulation.
Conversely, in a situation with open national borders,
Immunity and Case Fatality COVID-19 was not completely eradicated despite the
The proportion of individuals who acquired immunity reached implemented measures.
a peak of 17.1% (171/ 1000) at t=175, albeit with an immunity
below 8% (77/1000) at the end of the simulation (Figure 4b). Herd Immunity, ICU Beds, and Productivity
The case-fatality rate increased throughout the simulation. In The model showed that immunity was reached in approximately
the last part of the simulation, despite new cases of COVID-19, 10% (96/1000) of the population.
the case-fatality rate did not increase. At the end of the
The simulation indicated that the ICU beds were far from being
simulation, the case-fatality rate was 1.8% (18/1000).
saturated, with the highest rate being 17% (5/30) at t=131.
R0 and RE The model showed a sharp drop in productivity following the
The trends of R0 (range 0-3.8) and RE (range 0-3.0) exhibited implementation of containment measures, with a maximum loss
strong fluctuations during the time span of the simulation. of productivity of –18.2% (compared to the prepandemic value
of 0).
The sensitivity analysis showed that no new cases occurred
once the no contagion value was reached (same as the analysis
for Italy; Figure 3b), and the borders remained closed.
https://medinform.jmir.org/2021/4/e24192 JMIR Med Inform 2021 | vol. 9 | iss. 4 | e24192 | p. 9
(page number not for citation purposes)
XSL• FO
RenderXJMIR MEDICAL INFORMATICS Staffini et al
Sweden high values until the end of the simulation. Despite a descending
The simulation recorded 765 cases of COVID-19 with 533 trend in the second half of the simulation, there were situations
recoveries and 141 deaths. The case-fatality rate was 18.4% where the number of cases increased again. Given the high
(141/765), with an older adult case-fatality rate of 43% (61/141). number of positive cases, the infection was not considered under
control.
Total Number of COVID-19 Cases, Hospitalizations,
The total number of hospitalizations and home isolations reached
Home Isolations, and Asymptomatic Infections
a peak around t=129.
At the end of the simulation, the total number of positive cases
was 91, including 38 asymptomatic, 29 in home isolation, and A sensitivity analysis that did not place a limit on the number
9 hospitalized. of ICU beds showed that in the second part of the simulation
there was a sharper decrease, with an overall lower number of
The number of COVID-19 cases reached a peak at t=116 (Figure COVID-19 cases.
5a) with the number of cases decreasing slowly, remaining at
Figure 5. (a) Positive, hospitalized, in isolation, and asymptomatic figures for Sweden. (b) Evolution of the contagion for Sweden. The graphs consider
the sum of the agents belonging to each category shown in the legend for each day of the simulation.
https://medinform.jmir.org/2021/4/e24192 JMIR Med Inform 2021 | vol. 9 | iss. 4 | e24192 | p. 10
(page number not for citation purposes)
XSL• FO
RenderXJMIR MEDICAL INFORMATICS Staffini et al
Immunity and Case Fatality at the end of the simulation) and a decreased case-fatality rate
Immunity was reached in 29% (290/1000) of the population, (80/693, 11.5%).
with a COVID-19 mortality rate of 14% (141/1000) at the end R0, RE, and Herd Immunity
of the simulation (Figure 5b). The recovery rate was 60%
(443/733; we did not count the number of positive agents at the The trends of R0 (range 1.1-2.3) and RE (range 0.5-2.2)
end of the simulation). presented less fluctuations during the time span of this
simulation (Figure 6a).
The sensitivity analysis showed that an increase in the number
of ICU beds would lead to a decrease in the total number of The model showed that immunity was reached in approximately
positive cases and would result in an increased recovery rate 39% (388/1000; we counted the immune plus the currently
(447/588, 76%; we did not count the number of positive agents positive cases) of the population (Figure 6b).
Figure 6. (a) R0 and Re indexes for Sweden. (b) Herd immunity rate for Sweden.
The sensitivity analysis showed that approximately an additional
ICU Beds 40% (an increase of 8 out of the current 20) of the available
In the first part of the simulation, full saturation of ICU beds ICU beds would have been necessary to cope with the peak of
was reached on a number of occasions (Figure 7a). In the second a maximum emergency (at t=116; Figure 7b). An additional
part of the simulation, the bed saturation rate remained above 10% of available beds would have met the needs of the
50%. population throughout most of the simulation period.
Figure 7. (a) Hospital saturation rate for Sweden. (b) Hospital saturation rate for Sweden (with no limit on the number of ICU beds). ICU: intensive
care unit.
individuals in hospital and in home isolation, and the high
Productivity case-fatality rate.
The loss in productivity at its maximum reached –18.8%
(compared to the prepandemic value of 0). The government In the sensitivity analysis without a limit on ICU beds, the
measures have generated a decrease in productivity, and as these productivity was higher than in the main analysis.
measures were still in place as of July 1, 2020, we could not
see a rise due to the restoration of normality. The loss of
productivity was mainly affected by the high number of infected
https://medinform.jmir.org/2021/4/e24192 JMIR Med Inform 2021 | vol. 9 | iss. 4 | e24192 | p. 11
(page number not for citation purposes)
XSL• FO
RenderXJMIR MEDICAL INFORMATICS Staffini et al
Brazil part of the simulation showed that there was a decrease in the
The simulation recorded 883 cases of COVID-19 with 658 number of cases due to the large number of immune individuals.
recoveries and 90 deaths. The case-fatality rate was just over Given the high number of people still positive at the end of the
10% (90/883), with an older adult case-fatality rate of 34% simulation, the infection was not to be considered under control
(31/90) out of total deaths. (Figure 8a).
The total number of hospitalizations and home isolations reached
Total Number of COVID-19 Cases, Hospitalizations,
a peak around t=190.
Home Isolations, and Asymptomatic Infections
At the end of the simulation, the total number of positive cases A sensitivity analysis that did not place a limit on the number
was 137, including 63 asymptomatic, 47 in home isolation, and of ICU beds resulted in a peak of the number of COVID-19
3 hospitalized. cases at t=75, followed by a gradual decrease in the number of
cases.
The number of COVID-19 cases gradually rose throughout most
of the simulation period without reaching a clear peak. The final
Figure 8. (a) Positive, hospitalized, in isolation, and asymptomatic figures for Brazil. (b) Evolution of the contagion for Brazil. The graphs consider
the sum of the agents belonging to each category shown in the legend for each day of the simulation.
https://medinform.jmir.org/2021/4/e24192 JMIR Med Inform 2021 | vol. 9 | iss. 4 | e24192 | p. 12
(page number not for citation purposes)
XSL• FO
RenderXJMIR MEDICAL INFORMATICS Staffini et al
Immunity and Case Fatality The model showed that immunity was reached in approximately
The proportion of immune individuals reached 37% (374/1000) 51% (511/1000) of the population, while a figure of 75% was
of the population (Figure 8b). The proportion of recovered cases required to obtain herd immunity for the entire population.
reached 74% (658/883). The simulation model showed that the number of ICU beds
The sensibility analysis showed that an increase in the number were insufficient with respect to the needs resulting from the
of ICU beds would lead to a decrease in the number of cases spread of the COVID-19 pandemic (Figure 9a).
and would result in a recovery rate of 84% (415/492) and a The sensitivity analysis, which removed the limit on the number
case-fatality rate of 7% (34/492). of ICU beds, showed that, approximately, an additional 75%
(an increase of 7 out of the current 9) of the number of available
R0 and RE, Herd Immunity, ICU Beds, and Productivity
ICU beds would have been necessary to cope with the peak of
The trends of R0 (range 0.5-4.1) and RE (range 0.2-2.5) exhibited maximum emergency (at t=84; Figure 9b).
contained fluctuations during the time span of this simulation
The loss in productivity at most reached –12.4% (compared to
but always remained higher than 1.
the prepandemic value of 0).
Figure 9. (a) Hospital saturation rate for Brazil. (b) Hospital saturation rate for Brazil (with no limit on the number of ICU beds). ICU: intensive care
unit.
lockdown [37]. Our model thus differs from previous models,
Discussion as it focuses on the effects of contagion and on its evolution
Objective over time, considering both the real data made available by
government bodies and the policy measures implemented to
The objective of this study was to present a model that simulates stop or limit the propagation of SARS-CoV-2.
the propagation of the COVID-19 pandemic based on real-world
containment measures, as they were implemented by the The model outputs shown in this paper are the results of several
governments of 4 countries: Italy, Germany, Sweden, and Brazil. simulations for each country. Due to the nature of ABMs, the
The model thus allows for a prediction on the evolution of quantitative results will differ with each simulation. Any
COVID-19 by reporting forecasts on key indexes such as the conditions that occur within the model will vary over time while
case-fatality rate, the recovery rate, herd immunity, ICU bed maintaining parameter values and keeping initial variables
occupancy rates, home isolation rates, and the countries’ constant. Although each simulation will not yield identical
productivity rates. The proposed model is highly flexible and quantitative results for each country, the qualitative behavior
allows for the addition or removal of parameters such as always follows the same trend. Consequently, we have been
requirements and policies. Moreover, the model consequently able to draw some considerations about the analyzed parameters.
studies how the contagion evolves over time. This offers the These are presented on a country by country basis.
possibility to run additional simulations that predict the course Italy
of the pandemic under alternative policies by each government.
The simulations for Italy show a low total number of COVID-19
Previous models of SARS-CoV-2 have assessed the impact of cases compared to the simulations for Sweden and Brazil,
the use of personal protection and early diagnosis [11], studied indicating a success of the adopted containment measures.
the impact of face masks on the spread of the virus [12], and Similarly, the numbers of hospitalized individuals and those in
analyzed the impact of the virus according to age [9,10], family home isolation seemed to remain under control. Overall, this
situation, and the presence of comorbidities [10]. Meanwhile, resulted in a large fluctuation of R0 and RE, where a small
other ABMs have considered the impact of home isolation on increase in the number of infections lead to a large growth in
the saturation of ICU beds [35], assessed infection and fatality the indexes’ values. Additionally, the simulations for Italy
rates assuming a 20-fold underreported number of cases [36], indicated a slow reduction in the number of asymptomatic
or hypothesized the economic effects in Japan of a Tokyo
https://medinform.jmir.org/2021/4/e24192 JMIR Med Inform 2021 | vol. 9 | iss. 4 | e24192 | p. 13
(page number not for citation purposes)
XSL• FO
RenderXJMIR MEDICAL INFORMATICS Staffini et al
individuals, which highlights an increased possibility of new the German simulations showed an older adult case-fatality rate
infections that in turn could be extended to a recommendation of 61% (11/18), the overall case-fatality rate was only 6.7%
not to loosen the implemented containment measures as of July (18/270). Germany’s markedly lower overall case-fatality rate
1, 2020. This is further supported by the trends in immunity, as compared to Italy could be the result of the prompt diagnosis
where the proportion of immune individuals were comparatively and case management due to the widespread controls carried
low. Bearing in mind that our model was implemented at the out by the public health authorities. The same containment
end of June 2020 and that it used statistical data available at measures, however, also result in the low proportion of immune
that time, it was able to correctly predict that, with the reopening individuals (96/1000, 10%), which are far from the proportion
of the national borders and the free movement of people, there necessary to reach herd immunity as indicated by the model
would be a new increase in the number of positive cases (thereby (73%). Consequently, and similar to Italy, the model predicted
partly invalidating national containment efforts). This was that Germany would have had a high risk of possible second
indeed confirmed in our sensitivity analysis where the national waves, as it indeed happened with the reopening of the national
borders remain closed. Such a situation is not replicable in borders.
reality, but it leads to no new cases.
Compared to Italy, Germany also fared better with regard to
Despite its relatively low number of cases, Italy recorded the ICU bed occupancy rates; the simulations indicated that even
second highest case-fatality rate (48/309, 15%; Germany: in the most acute phase of the pandemic, bed occupancy rates
18/270, 6.7%; Sweden: 141/765, 18.4%; Brazil: 90/883, 10%). never exceeded 20% (6/30) of total capacity. It should be kept
Italy’s proportion of older adults ranks among the highest in in mind that Germany has by far the highest number of ICU
the world (Source: Istituto Nazionale di Statistica [38]), which beds in the 4 countries considered in our analysis [18].
could serve to partially explain the exceedingly high case-fatality
Finally, the impact of the pandemic on the German economy
rate. Indeed, the simulation indicates that COVID-19 affects
is evident, as the containment measures had a strong impact on
older adults predominantly, where the case-fatality rate reached
the productivity, which at one point reached –18.2%. However,
65% (31/48) of total deaths.
contrary to the situation for Italy, the forecasts of major
Herd immunity in Italy would be obtained in a situation where economic institutes such as the OECD and the World Bank
70% of the population are immune to SARS-CoV-2. The results considered the German recovery period to reach the precrisis
of the model, however, indicated that only 11% of the Italian values quicker than Italy.
population reached immunity, a number that considers both
immune individuals and active cases. This low proportion of
Sweden
immune individuals is expected given the policy decisions aimed The simulations for Sweden demonstrate a situation that is not
at limiting the spread of the virus. under control a year after the first recorded case and are thus in
stark contrast to those obtained for Italy and Germany. These
Germany discrepancies are most likely due to the comparatively limited
For Germany, our model was able to make a complete analysis containment measures initiated by the Swedish Public Health
of the contagion peak and its gradual descent, as well as Authority. First, both R0 and RE remain at higher values through
predicted possible developments in the coming months. the simulations, with an R0 that never goes below 1. Second, at
The simulations for Germany showed a situation with a the end of the simulation, the total number of COVID-19 cases
comparatively low number of infected individuals and strong was much larger than in Italy and Germany; the high number
fluctuations in R0 and RE indexes. The low infection rates of hospitalized and asymptomatic cases being of particular
resulted in a very low case-fatality rate; however, it also resulted concern. Third, the proportion of recovered cases (443/733,
in a low proportion of immune individuals. Like the simulations 60%) was lower than the corresponding proportion in any of
for Italy, the low number of positive cases and the low the other countries. Fourth, the case-fatality rate (141/765,
proportion of immune individuals was a consequence of the 18.4%) was higher than the rates obtained for Germany, Italy,
policy implementations aimed at containing the spread of and Brazil.
SARS-CoV-2. Overall, the results at the end of the simulation A major difference of Sweden from Italy and Germany was the
for Germany are not too different from the results obtained for low number of available ICU beds. Despite its high focus on
Italy, a situation under control with regard to hospitalizations welfare, Sweden has a low number of ICU beds per capita.
and home isolation cases. Moreover, as for Italy, asymptomatic Although Sweden managed to double the number of ICU beds
cases were still recorded (1%), which indicates a situation where at the start of the pandemic (Source: Folkhälsomyndigheten
SARS-CoV-2 is still present in the population, with the risk of [39]), the pressure on hospitals remains critical throughout the
continued virus spread if the containment measures were to be simulations. Indeed, as the sensitivity analyses showed, Sweden
loosened. The model, starting from the data at the end of June would have required an additional 40% of its ICU capacity at
2020, correctly predicted that this percentage of asymptomatic the peak of the pandemic. Moreover, the sensitivity analysis
people would have led to the formation of new outbreaks and also showed that the case-fatality rate decreased from 18.4% to
a relatively new spread of the virus. 11.5% with a higher number of ICU beds. It is therefore fair to
The simulations for Germany showed two notable differences conclude that an increase in the ICU capacity would have the
compared to Italy. First, the proportion of recoveries was higher potential to save many lives.
in Germany (233/251, 93% vs 243/292, 83%). Second, although
https://medinform.jmir.org/2021/4/e24192 JMIR Med Inform 2021 | vol. 9 | iss. 4 | e24192 | p. 14
(page number not for citation purposes)
XSL• FO
RenderXJMIR MEDICAL INFORMATICS Staffini et al
Despite the adverse outcomes, Sweden does not reach the that the contagion curve in Brazil lowers slowly; the model
threshold of herd immunity as determined by the simulations. predicted that the negative effects of the pandemic will last for
The herd immunity threshold (57%) was derived based on a long time so that it seems likely that other countries (that
specific considerations in the model (ie, lifelong immunity for implemented stronger containment measures) will be able to
those with serious COVID-19 and temporary immunity to those reopen all their activities sooner. The productivity trend reflects
with milder forms of the disease). To the best of our knowledge, this, as there is no rise toward pre–COVID-19 values.
there is no clear data on immunity. Indeed, if the parameters in
The effects of reopening national borders cannot be assessed
the model are accurate, herd immunity for COVID-19 would
for Brazil, which unlike Germany and Italy, has never
be difficult to reach. It is therefore possible to conclude, based
implemented closure of national borders as a measure to contain
on the simulations, that implementing containment measures
the spread of COVID-19.
and recommending the use of face masks have positive effects
in limiting the spread and the consequences of COVID-19, even Principal Results
a year after the first recorded case. By considering 4 countries with different policy approaches in
The simulated productivity drop for Sweden would, unlike the the prevention and containment of the spread of COVID-19,
situations in Italy and Germany, not be influenced by the our simulation model is able to highlight the consequences of
country’s containment measures but rather be a consequence policy decisions on a number of measures. The results obtained
of its large number of COVID-19 cases. from our models showed the importance of prevention through
widespread testing over large areas of territory (Germany) and
Brazil of lockdown measures for the reduction of virus transmissibility
As expected, our model foresees that Brazil has the highest (Italy and Germany). On the other hand, the countries that have
number of COVID-19 cases among the 4 analyzed countries. not adopted these measures (Sweden and Brazil) are facing a
This is most likely due to Brazil’s implemented policy decisions, situation that is not under control. From our results, we also
which are more in line with those of Sweden than Italy and highlight how important the mandatory use of face masks and
Germany. Consequently, Brazil and Sweden share many the imposition of physical distancing are in reducing the number
similarities in the analyses. First, the total case numbers in Brazil of COVID-19 cases. Our study also stresses how important it
resemble those of Sweden and are assumed to be a result of the is to have an adequate number of ICU beds to deal with
less restrictive containments measures. Moreover, R0 and RE emergencies. This is evident particularly in the simulations for
did not exhibit strong fluctuations, with R0 remaining above 1 Sweden and Brazil, where the sensitivity analyses demonstrated
for the duration of the simulation. Despite a situation that could an improvement in both recovery rates and case-fatality rates.
be considered out of control, Brazil displayed a notably lower Finally, the simulations showed that the reopening of national
case-fatality rate than Sweden (10.2% vs 18.4%). This is most borders will not allow individual countries to maintain a
likely due to the low proportion of older adults (8.6% vs 19.8% monotonic decreasing curve of infections; indeed, only the
in Sweden). Another noteworthy difference between Brazil and simulations with the national borders being kept closed led to
Sweden was the encouraging recovery rate of 74% (658/883), a complete stop of the spread of COVID-19.
again most likely due to the two countries’ demographic In the context of an increasing number of positive COVID-19
differences in age. cases, the main priority is the successful containment of the
The proportion of immune individuals in Brazil reached 37% spread of SARS-CoV-2. However, prolonged lockdown
(374/1000) of the population, the highest proportion of all the measures have devastating effects on the economy of a country.
analyzed countries. Despite this high immunization rate, the The results of our model point toward a situation where
model foresees that herd immunity will not be reached due to countries that implemented mild policies against the virus at
a calculated threshold of 75%. Indeed, the total proportion of the start of the pandemic may inevitably need to strengthen
immunized and positive cases at the end of the simulation them in the near future. Consequently, we suggest that the best
reached 51% (511/1000). course of action is to plan and implement aggressive political
actions, both in the contagion containment phase (eg, limitations
The severity of the situation in Brazil was further highlighted on the personal mobility and closure of nonessential activities)
by the sensitivity analyses, identifying a required 75% increase and in the economic recovery phase (eg, strong tax breaks for
in the number of ICU beds for Brazil to cope with its situation. businesses and robust actions to stimulate consumption, as also
According to the models, such an increase in capacity would indicated by the European Central Bank, even if doing this will
notably reduce not only the number of recorded COVID-19 result in a large budget deficit), with a long-term perspective
cases but also the case-fatality rate (from 10.2% to 7%). It is, from the beginning. According to the simulations, such actions
however, questionable whether an ICU capacity increase of may allow nations to overcome the economic impact of the
such magnitude is feasible to implement, as Brazil over the past pandemic sooner. This is important given that the data provided
years has progressively decreased the availability of ICU beds by the international economic organizations (International
(Source: Central Intelligence Agency [29]). Monetary Fund, Organisation for Economic Co-operation and
Brazil has adopted few measures concerning the closure of Development [OECD], World Bank, and others) leave no room
commercial activities (Source: Conselho Nacional de Secretários for optimism [41-43].
de Saúde [40]). This led to a lower drop in productivity (in
absolute terms) than in European countries, with the difference
https://medinform.jmir.org/2021/4/e24192 JMIR Med Inform 2021 | vol. 9 | iss. 4 | e24192 | p. 15
(page number not for citation purposes)
XSL• FO
RenderXJMIR MEDICAL INFORMATICS Staffini et al
Strengths and Limitations additional new and relevant variables as they become available
There are a number of limitations that need to be mentioned. or are deemed necessary by researchers and policy makers.
The main point concerns the input data for the model. We have Future Considerations
retrieved the values from the most reliable sites among those
Further development of the model could allow for comparisons
that provide daily information about the spread of the virus, but
of the outcomes of a number of different policy proposals (eg,
this information is constantly evolving. Consequently, to keep
obligatory vs voluntary use of face masks, whether or not to
the model updated, it is necessary to set up the most recent
increase the number of ICU beds, or whether or not to
information. In this paper, the model photographs the situation
implement lockdown measures). The model could therefore be
at the end of June 2020, and it provides a forecast based on
used to evaluate the needs and requirements for the considered
those data. Another limitation is that we considered only a small
territory, and the policies with the greatest impact over time.
sample (which can be thought of as an infection outbreak). Even
We plan to better explore these points in future research.
if this sample has the same national characteristics, the obtained
results may not perfectly be the same when translated on a larger Additionally, with regard to the economic consequences of the
scale; that said, what we have obtained remains valid when pandemic, further considerations should be made for data
studying a representative outbreak. concerning productivity and the economy in general. At the
time of writing, the return to a situation similar to the one before
The economic results obtained from the model measured only
the pandemic seems likely to occur only after the vaccination
the impact resulting from political decisions to contain the
campaign ends, covering at least 75% of the population [44].
spread of COVID-19. The economic ramifications that will
occur after a complete reopening of borders, such as a decrease Conclusions
in consumption and tourism, an increase in unemployment, and This study used real-world data to analyze how different political
the shutdown of various economic activities, have not been decisions aiming to deal with the spread of SARS-CoV-2
taken into consideration. influence the extent of COVID-19. The results of the simulations
The simulations also have a number of strengths. They take into lead to three main conclusions. First, strict containment
consideration the age distribution of the respective countries. measures, including the mandated use of face masks and the
This is crucial given the impact of COVID-19 on the older adult implementation of social distance, lead to a reduction in the
population. The data in all the simulations is based on official number of COVID-19 cases. Second, the number of ICU beds
statistics, as they are obtained through the national statistical are an important measure to reduce case-fatality rates. Third,
databases of each country. This is a major strength for Sweden, herd immunity cannot be reached, and any national strategy
Germany, and Italy, but a limitation for the analyses relating to aiming to reach herd immunity by loosening containment
Brazil. Moreover, the model can be extended to include measures should be avoided.
Acknowledgments
The authors did not have any sources of funding to report. This research was supported by the Joint Research and Development
Agreement between ALBERT Inc and the Center of Innovation at the University of Tokyo. This research was supported by the
Center of Innovation Program of the Japan Science and Technology Agency (grant number JPMJCE1304).
Authors' Contributions
AS and TS developed and refined the ideas in this paper. AS wrote the first draft. AS and TS discussed it actively and revised
the first draft. AKS and UIC critically revised the manuscript for important intellectual content, until the final agreement on the
submitted version. All authors read and approved the final submitted version of the manuscript.
Conflicts of Interest
None declared.
Multimedia Appendix 1
Supplementary material.
[DOCX File , 27 KB-Multimedia Appendix 1]
References
1. Silverman E, Gostoli U, Picascia S, Almagor J, McCann M, Shaw R, et al. Situating agent-based modelling in population
health research. arXiv 2021 Preprint posted online on February 6, 2020 [FREE Full text]
2. Gorman DM, Mezic J, Mezic I, Gruenewald PJ. Agent-based modeling of drinking behavior: a preliminary model and
potential applications to theory and practice. Am J Public Health 2006 Nov;96(11):2055-2060. [doi:
10.2105/AJPH.2005.063289] [Medline: 17018835]
https://medinform.jmir.org/2021/4/e24192 JMIR Med Inform 2021 | vol. 9 | iss. 4 | e24192 | p. 16
(page number not for citation purposes)
XSL• FO
RenderXJMIR MEDICAL INFORMATICS Staffini et al
3. Zhang D, Giabbanelli PJ, Arah OA, Zimmerman FJ. Impact of different policies on unhealthy dietary behaviors in an urban
adult population: an agent-based simulation model. Am J Public Health 2014 Jul;104(7):1217-1222. [doi:
10.2105/AJPH.2014.301934] [Medline: 24832414]
4. Chiacchio F, Pennisi M, Russo G, Motta S, Pappalardo F. Agent-based modeling of the immune system: NetLogo, a
promising framework. Biomed Res Int 2014;2014:907171. [doi: 10.1155/2014/907171] [Medline: 24864263]
5. Bomblies A. Agent-based modeling of malaria vectors: the importance of spatial simulation. Parasit Vectors 2014 Jul
03;7:308 [FREE Full text] [doi: 10.1186/1756-3305-7-308] [Medline: 24992942]
6. Roche B, Drake JM, Rohani P. An agent-based model to study the epidemiological and evolutionary dynamics of Influenza
viruses. BMC Bioinformatics 2011 Mar 30;12:87 [FREE Full text] [doi: 10.1186/1471-2105-12-87] [Medline: 21450071]
7. Li Y, Lawley MA, Siscovick DS, Zhang D, Pagán JA. Agent-based modeling of chronic diseases: a narrative review and
future research directions. Prev Chronic Dis 2016 May 26;13:E69 [FREE Full text] [doi: 10.5888/pcd13.150561] [Medline:
27236380]
8. DePasse JV, Smith KJ, Raviotta JM, Shim E, Nowalk MP, Zimmerman RK, et al. Does choice of influenza vaccine type
change disease burden and cost-effectiveness in the United States? An agent-based modeling study. Am J Epidemiol 2017
May 01;185(9):822-831 [FREE Full text] [doi: 10.1093/aje/kww229] [Medline: 28402385]
9. Chang SL, Harding N, Zachreson C, Cliff OM, Prokopenko M. Modelling transmission and control of the COVID-19
pandemic in Australia. Nat Commun 2020 Nov 11;11(1):5710. [doi: 10.1038/s41467-020-19393-6] [Medline: 33177507]
10. Wilder B, Charpignon M, Killian JA, Ou H, Mate A, Jabbari S, et al. Modeling between-population variation in COVID-19
dynamics in Hubei, Lombardy, and New York City. Proc Natl Acad Sci U S A 2020 Oct 13;117(41):25904-25910 [FREE
Full text] [doi: 10.1073/pnas.2010651117] [Medline: 32973089]
11. Moore SE, Okyere E. Controlling the transmission dynamics of COVID-19. arXiv. Preprint posted online on March 31,
2020 [FREE Full text]
12. Kai D, Goldstein GP, Morgunov A, Nangalia V, Rotkirch A. Universal masking is urgent in the COVID-19 pandemic:
SEIR and agent based models, empirical validation, policy recommendations. arXiv. Preprint posted online on April 22,
2020 [FREE Full text]
13. Louati D, Haddad G, Bedhiafi W, Bellamine N, Kebir A, Kchaou A, et al. ABM model to explore containment and screening
policies to control COVID-19 virus spread. ResearchGate. Preprint posted online on March 1, 2020. [doi:
10.13140/RG.2.2.32409.16489]
14. Mahdizadeh Gharakhanlou N, Hooshangi N. Spatio-temporal simulation of the novel coronavirus (COVID-19) outbreak
using the agent-based modeling approach (case study: Urmia, Iran). Inform Med Unlocked 2020;20:100403 [FREE Full
text] [doi: 10.1016/j.imu.2020.100403] [Medline: 32835081]
15. Churches T, Jorm L. Flexible, freely available stochastic individual contact model for exploring COVID-19 intervention
and control strategies: development and simulation. JMIR Public Health Surveill 2020 Sep 18;6(3):e18965 [FREE Full
text] [doi: 10.2196/18965] [Medline: 32568729]
16. Kaxiras E, Neofotistos G. Multiple epidemic wave model of the COVID-19 pandemic: modeling study. J Med Internet Res
2020 Jul 30;22(7):e20912 [FREE Full text] [doi: 10.2196/20912] [Medline: 32692690]
17. Kerr CC, Stuart RM, Mistry D, Abeysuriya RG, Hart G, Rosefeld K, et al. Covasim: an agent-based model of COVID-19
dynamics and interventions. medRxiv. Preprint posted online on May 15, 2020. [doi: 10.1101/2020.05.10.20097469]
18. An Agent-Based Model of the Local Spread of SARS-CoV-2: Modeling Study. GitHub. URL: https://github.com/staale92/
abm-local-pandemic-spread [accessed 2021-03-16]
19. National Center for Biotechnology Information. 2012. URL: https://www.ncbi.nlm.nih.gov/ [accessed 2020-06-01]
20. Eurostat. 2018. URL: https://ec.europa.eu/eurostat [accessed 2020-06-01]
21. Italy. OECD. 2018. URL: http://www.oecd.org/italy/ [accessed 2020-06-01]
22. Italy. World Health Organization. URL: https://www.who.int/countries/ita/ [accessed 2020-06-26]
23. Ministero della Salute. URL: http://www.salute.gov.it/portale/home.html [accessed 2020-06-01]
24. Germany. OECD. 2018. URL: http://www.oecd.org/germany/ [accessed 2020-06-01]
25. Germany. World Health Organization. URL: https://www.who.int/countries/deu/ [accessed 2020-06-26]
26. Worldometer. URL: https://www.worldometers.info [accessed 2020-06-01]
27. Sweden. OECD. URL: http://www.oecd.org/sweden/ [accessed 2020-06-01]
28. Sweden. World Health Organization. URL: https://www.who.int/countries/swe/ [accessed 2020-06-26]
29. Brazil. CIA. 2018. URL: https://www.cia.gov/the-world-factbook/countries/brazil [accessed 2020-06-01]
30. AMIB. 2018. URL: https://www.amib.org.br/ [accessed 2020-06-01]
31. Brazil. World Health Organization. URL: https://www.who.int/countries/bra/ [accessed 2020-06-26]
32. Böhning D, Rocchetti I, Maruotti A, Holling H. Estimating the undetected infections in the Covid-19 outbreak by harnessing
capture-recapture methods. Int J Infect Dis 2020 Aug;97:197-201 [FREE Full text] [doi: 10.1016/j.ijid.2020.06.009]
[Medline: 32534143]
33. Rodda LB, Netland J, Shehata L, Pruner KB, Morawski PA, Thouvenel CD, et al. Functional SARS-CoV-2-specific immune
memory persists aftermMild COVID-19. Cell 2021 Jan 07;184(1):169-183.e17 [FREE Full text] [doi:
10.1016/j.cell.2020.11.029] [Medline: 33296701]
https://medinform.jmir.org/2021/4/e24192 JMIR Med Inform 2021 | vol. 9 | iss. 4 | e24192 | p. 17
(page number not for citation purposes)
XSL• FO
RenderXYou can also read