An Alternative Co-Benefit Framework Prioritizing Health Impacts: Potential Air Pollution and Climate Change Mitigation Pathways through Energy ...
←
→
Page content transcription
If your browser does not render page correctly, please read the page content below
climate
Article
An Alternative Co-Benefit Framework Prioritizing Health
Impacts: Potential Air Pollution and Climate Change
Mitigation Pathways through Energy Sector Fuel Substitution
in South Korea
Dafydd Phillips              and Tae Yong Jung *

                                          Graduate School of International Studies, Yonsei University, Seoul 03722, Korea; dafydd.phillips@yonsei.ac.kr
                                          * Correspondence: tyjung00@yonsei.ac.kr

                                          Abstract: South Korea had the highest annual average PM2.5 exposure levels in the Organization for
                                          Economic Co-operation and Development (OECD) in 2019, and air pollution is consistently ranked as
                                          citizens’ top environmental concern. South Korea is also one of the world’s top ten emitter countries
                                          of CO2 . Co-benefit mitigation policies can address both air pollution and climate change. Utilizing
                                          an alternative co-benefit approach, which views air pollution reduction as the primary goal and
                                          climate change mitigation as secondary, this research conducts a scenario analysis to forecast the
                                          health and climate benefits of fuel substitution in South Korea’s electricity generation sector. Health
                                          benefits are calculated by avoided premature mortality and years of life lost (YLL) due to ischemic
                                          heart disease, stroke, chronic obstructive pulmonary disease (COPD), lung cancer, and acute lower
                                          respiratory infections (ALRI). The study finds that use of liquefied natural gas (LNG) instead of coal

                                   over the 2022–2050 period would result in an average of 116 fewer premature deaths (1152 YLL) and
Citation: Phillips, D.; Jung, T.Y. An     80.8 MTCO2 e fewer emissions per year. Over the same period, maintaining and maximizing the
Alternative Co-Benefit Framework          use of its nuclear energy capacity, combined with replacing coal use with LNG, would result in an
Prioritizing Health Impacts: Potential    average of 161 fewer premature deaths (1608 YLL) and 123.7 MTCO2 e fewer emissions per year.
Air Pollution and Climate Change
Mitigation Pathways through Energy        Keywords: air pollution; PM2.5; climate change mitigation; co-benefits; South Korea; LEAP-IBC
Sector Fuel Substitution in South
Korea. Climate 2021, 9, 101. https://
doi.org/10.3390/cli9060101

                                          1. Introduction
Academic Editor: Chris Swanston
                                                Ambient (outdoor) air pollution is a serious problem that affects the health and well-
                                          being of people all over the world, with around 91% of the world’s population residing in
Received: 27 April 2021
Accepted: 17 June 2021
                                          areas where ambient air quality is below World Health Organization (WHO) recommended
Published: 20 June 2021
                                          levels in 2016 [1]. PM2.5 and ground-level O3 , which are associated with respiratory and
                                          cardiovascular diseases and mortality, have potentially the most significant effects on
Publisher’s Note: MDPI stays neutral
                                          human health compared to other air pollutants [2–4]. PM2.5 is particularly detrimental to
with regard to jurisdictional claims in
                                          human health as these particles can be breathed deeply into the lungs and enter the blood-
published maps and institutional affil-   stream [5]. Exposure to PM2.5 increases the relative risk for ischemic heart disease, stroke,
iations.                                  lung cancer, chronic obstructive pulmonary disease (COPD), and acute lower respiratory
                                          infections (ALRI) [6]. In 2015, exposure to PM2.5 caused 4.2 million deaths, representing
                                          7.6% of total global deaths [2]. Reduction of PM2.5 exposure levels has major positive
                                          health impacts. Between 2000 and 2017, the annual PM2.5-related number of deaths in the
Copyright: © 2021 by the authors.
                                          EU decreased (−4.85 per 106 inhabitants) in line with a reduction of PM2.5 levels observed
Licensee MDPI, Basel, Switzerland.
                                          at urban air quality monitoring stations [4]. In the absence of policies to reduce ambient air
This article is an open access article
                                          pollution it is projected that the number of annual deaths due to air pollution exposure
distributed under the terms and           will increase to 6–9 million by 2060 [7].
conditions of the Creative Commons              East Asia is a region that suffers from high levels of ambient air pollution. In 2015,
Attribution (CC BY) license (https://     1.14 million deaths in the region were attributable to PM2.5 exposure, 27% of the year’s
creativecommons.org/licenses/by/          total global PM2.5-related mortality [2]. In 2019, South Korea had the highest annual
4.0/).                                    average PM2.5 exposure levels in the OECD, and in 2012 the total number of deaths due

Climate 2021, 9, 101. https://doi.org/10.3390/cli9060101                                                      https://www.mdpi.com/journal/climate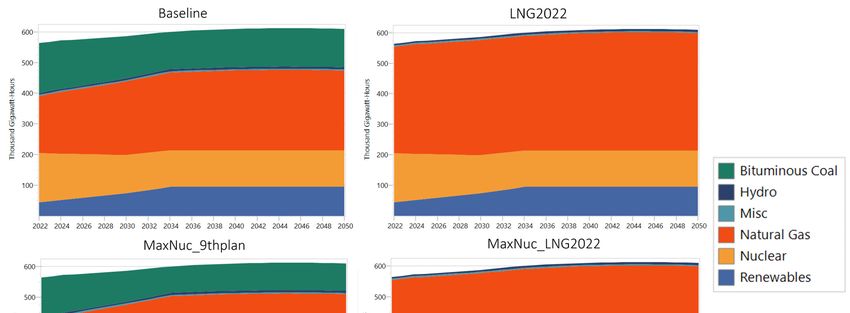
Climate 2021, 9, 101 2 of 15
East Asia is a region that suffers from high levels of ambient air pollution. In 2015,
Climate 2021, 9, 101 2 of 14
1.14 million deaths in the region were attributable to PM2.5 exposure, 27% of the year’s
total global PM2.5-related mortality [2]. In 2019, South Korea had the highest annual av-
erage PM2.5 exposure levels in the OECD, and in 2012 the total number of deaths due to
ambient
to ambientairair
pollution
pollution was
wasestimated
estimatedtotobebe11,523
11,523[8].
[8].Figure
Figure 11 shows population
shows mean population
exposure to PM2.5 in South Korea and the OECD from 2010–2019. The WHO Air Quality
Guidelines for particulate matter (PM) recommend that the PM2.5 exposure levels levels not
not
10µg/m3 3ininthe
exceed 10µg/m theannual
annualmean
mean [9].
[9]. The
The negative
negative impacts
impacts of PM2.5
of PM2.5 exposure
exposure willwill
be-
become
come more
more severe
severe intointo
thethe future
future as South
as South KoreaKorea
is a is a rapidly
rapidly agingaging society,
society, withwith
overover
30%
30%
of of South
South Korea’s
Korea’s population
population forecasted
forecasted to betoaged
be aged
70 or70 or older
older by 2050.
by 2050.
Figure 1.
1. Mean
Meanpopulation
populationexposure to to
exposure PM2.5 µg/m
PM2.5 µg/m 3 , 2010–2019,
3, 2010–2019, South KoreaKorea
South and the
andOECD aver-
the OECD
age [10].[10].
average
Beyond the direct health impacts of air pollution on human health, air pollution has
other negative impacts such as the reduction of tourism and retail sales revenues [11], the
reduction of time people spend in outdoor open spaces [12], as well as higher higher rates of of
depression associated with residing in areas with higher PM2.5
in areas with higher PM2.5 exposure [13].exposure [13].
Climate change
changeisisanother
anothersevere
severeenvironmental
environmental issue
issue thatthat needs
needs to addressed
to be be addressed ur-
urgently. Anthropogenic emissions of greenhouse gases
gently. Anthropogenic emissions of greenhouse gases (GHGs) are causing severe (GHGs) are causing severe
andandir-
irrevocable
revocable damage
damage toto thethe global
global climate
climate system,
system, increasing
increasing thethe likelihood
likelihood of devasting
of devasting im-
impacts
pacts forfor people
people and
and ecosystems[14].
ecosystems [14].South
SouthKorea
Koreaisisoneoneof ofthethe world’s
world’s top
top ten
ten emitter
emitter
countries of CO , yet its efforts to mitigate climate change have been
countries of CO2, yet its efforts to mitigate climate change have been insufficient. Co-ben-
2 insufficient. Co-benefit
mitigation
efit mitigationpolicies cancan
policies address
address both
bothclimate
climate change
change andandairairpollution.
pollution.Co-benefits
Co-benefits are
are
the extra benefits which are gained through climate change
the extra benefits which are gained through climate change mitigation actions, beyond mitigation actions, beyond
the
the direct
direct benefits
benefits of a ofmorea more stable
stable climate
climate [15]. [15]. However,
However, despite despite the evidence
the evidence of theof the
addi-
additional benefits of climate change mitigation policies [16], implementation
tional benefits of climate change mitigation policies [16], implementation of mitigation of mitigation
measures has
measures has been
been slow.
slow.
This study utilizes an
This study utilizes an alternative
alternative co-benefit
co-benefit approach
approach whichwhich viewsviews air
air pollution
pollution re-
re-
duction as the primary goal and climate change mitigation as a
duction as the primary goal and climate change mitigation as a secondary objective. Theresecondary objective. There
are three
are three main
mainreasons
reasonsfor fortaking
takingthisthisapproach.
approach. The The first
first is toisreflect
to reflect democratic
democratic will.will.
Air
Air pollution has been consistently found to be the top environmental concern of Korean
pollution has been consistently found to be the top environmental concern of Korean cit-
citizens [17,18]. Given that air pollution is more of an immediate concern to the Korean
izens [17,18]. Given that air pollution is more of an immediate concern to the Korean elec-
electorate, and given that democratic government should reflect the will of the people, it is
torate, and given that democratic government should reflect the will of the people, it is
reasonable that government policy should prioritize addressing air pollution. Second, the
reasonable that government policy should prioritize addressing air pollution. Second, the
negative impacts of air pollution are experienced after a much shorter period compared
negative impacts of air pollution are experienced after a much shorter period compared
to climate change. While not to downplay the negative impacts of climate change, air
to climate change. While not to downplay the negative impacts of climate change, air pol-
pollution is causing a larger number of avoidable deaths in the near term. Even though
lution is causing a larger number of avoidable deaths in the near term. Even though air
air pollution has a large regional dimension, as in South Korea, which is strongly affected
pollution has a large regional dimension, as in South Korea, which is strongly affected by
by pollutant emissions from China, national government still has the capacity to reduce
pollutant emissions from China, national government still has the capacity to reduce
premature mortality through domestic policy changes. Third, policies framed with a fo-
premature
cus on local, mortality
immediate through domestic
benefits policy
are more changes.
likely Third,widespread
to receive policies framed with and
support a focus
be
on local, immediate
implemented. benefits
Policies are more
primarily likely
focused ontoissues
receive widespread
such as climatesupport
changeand be imple-
of which the
mented.
negativePolicies
impactsprimarily focusedand
are not directly on issues
rapidly such as climate change
experienced by the of which
public arethe negative
less likely
to be supported. The result of focusing on air quality instead of climate change may
lead to the outcome of greater implementation of policies which contain climate change
mitigation components.
In the “9th Basic Plan for Long-term Electricity Supply and Demand (2020–2034)” [19],
hereby after referred to as the “9th Basic Plan”, the South Korean government outlined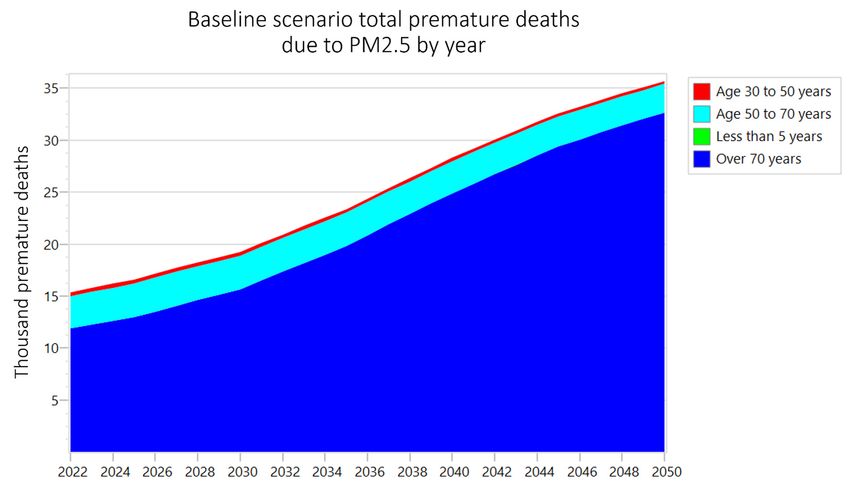
Climate 2021, 9, 101                                                                                            3 of 14

                       its future targets for energy mix capacities by fuel type. Renewable energy (RE) and
                       liquefied natural gas (LNG) capacities are planned to be increased and coal and nuclear
                       energy capacities decreased. The stated goals of the policy are to simultaneously reduce
                       greenhouse gas (GHG) emissions and air pollution, as well as phase out nuclear energy due
                       to safety concerns. Yet the plan still relies heavily on fossil fuel for electricity generation
                       into the future, with 70% of total planned effective capacity being from LNG and coal in
                       2034, raising concerns about how South Korea will totally transform its energy mix in
                       15 years to meet its 2050 carbon neutrality pledge.
                             This research conducts a scenario analysis to forecast the health and climate benefits
                       of further fuel substitution in South Korea’s electricity generation sector, through the
                       increased use of LNG and nuclear power compared to the 9th Basic Plan. The purpose of
                       this research is to provide quantitative evidence for the potential benefits of alternative
                       policy directions in South Korea’s energy policy. This research focuses on LNG and nuclear
                       generating capacities as their increased utilization can be decided by government policy
                       relatively quickly compared to alternative energy sources such as solar and wind. South
                       Korea is seeking to expand its use of renewable energy, but this will take time and faces
                       barriers in the South Korean context.
                             Health benefits are calculated by avoided premature mortality and years of life lost
                       (YLL) due to ischemic heart disease, stroke, COPD, lung cancer, and ALRI. The study finds
                       that use of liquefied natural gas (LNG) instead of coal over the 2022–2050 period would
                       result in an average of 116 fewer premature deaths (1152 YLL) and 80.8 MTCO2 e fewer
                       emissions per year. Over the same period, maintaining and maximizing the use of its
                       nuclear energy capacity, combined with replacing coal use with LNG, would result in an
                       average of 161 fewer premature deaths (1608 YLL) and 123.7 MTCO2 e fewer emissions
                       per year.

                       2. Materials and Methods
                             This study utilizes the Low Emissions Analysis Platform (LEAP) and its Integrated
                       Benefits Calculator (IBC) to calculate the health and climate benefits of fuel substitution
                       in South Korea’s electricity generation sector. Developed at the Stockholm Environment
                       Institute (SEI), LEAP is an integrated, scenario-based modeling tool that can be used
                       to track energy consumption, production, and resource extraction in all sectors of an
                       economy and calculate energy sector and non-energy sector GHG emission sources [20].
                       At least 38 countries have used LEAP to develop their National Determined Contributions
                       (NDCs) under the Paris Agreement. The IBC approximates atmospheric concentrations
                       of air pollutants, such as PM2.5, and then estimates the impacts on human health [21].
                       National emissions of relevant air pollutants and GHGs are calculated from the user-created
                       country model based on the inputted fuel use, activity levels, and emissions factors data.
                       Emissions from the natural background, the rest of the world, are taken from the IIASA
                       GAINS ECLIPSE scenario [22]. LEAP-IBC translates the total emissions into population-
                       weighted concentrations in the target country based on the GEOS-Chem adjoint model,
                       which is a global atmospheric geochemistry model driven by meteorological inputs from
                       NASA satellites [23]. Using integrated concentration exposure-response functions from
                       Cohen et al. [2], which analyzed data from the 2015 Global Burden of Disease study [2],
                       annual premature mortality and years of life lost (YLL) due PM2.5 exposure are calculated.
                       Premature mortality is defined as the sum of deaths per year that are attributable to PM2.5
                       exposure which occur prior to the average life expectancy. YLL is the sum of years of
                       life lost due to premature mortality, calculated by adding the sum of the remaining life
                       expectancy at the age of each premature death.
                             The modeling framework utilized by LEAP-IBC is outlined and applied to Bangladesh
                       in Kuylenstierna et al. [24] The study finds that full implementation of Bangladesh’s NDC
                       and National Action Plan to reduce short-lived climate pollutants (SLCPs) would result in
                       an avoidance of 12,000 premature deaths attributable to ambient PM2.5 exposure in 2030.
                       Nakarmi et al. [25] undertook a similar study using LEAP-IBC to examine the impacts of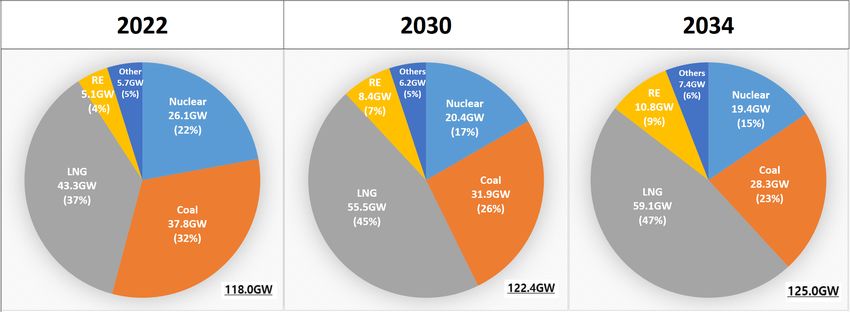
Climate 2021, 9, 101                                                                                            4 of 14

                       short-lived climate pollutants (SLCPs) mitigating measures on human health, agriculture,
                       and climate in Nepal. The research found that implementation of mitigation measures
                       could reduce PM2.5 levels by 87% by 2050, resulting in 29,000 fewer premature deaths
                       and avoiding 1.7 million tonnes of crop loss, leading to a present value economic benefit
                       of 2.7 times more than the total cost incurred in its implementation period of 2010–2050.
                       Previous studies applying LEAP to South Korea have been carried out [26–28], but there
                       has of yet been no published study utilizing LEAP-IBC for South Korea.
                            The base year of this study is 2019 and the scenario years of analysis are 2022–2050.
                       The five diseases for which premature mortality and YLL due to PM2.5 exposure are
                       calculated for are ischemic heart disease, COPD, stroke, lung cancer, and ALRI. Premature
                       mortality and YLL due to ALRI is estimated for the population portion under 5 years old,
                       and, for the other four diseases, estimated for the population aged thirty years and older.
                       The effect of PM2.5 on mortality rates is estimated through the application of the integrated
                       exposure-response functions for each disease from Cohen et al. [2], based on analysis of
                       data from the 2015 global burden of disease.
                            The integrated exposure-response functions (IERs) have the mathematical form:

                                                 IER (β, z) = 1 + α × (1 − e − β (z − z cf )γ+ )                   (1)

                       where z is the level of PM2.5 and zcf is the theoretical minimum risk exposure level
                       (assigned a uniform distribution of 2.4–5.9 µg/m3 of PM2.5) below which no additional
                       risk is assumed, with
                                                         (z − zcf )+ = (z − zcf )                        (2)
                       if z is greater than zcf and zero otherwise. Here, 1 + α is the maximum risk, β is the ratio of
                       the IER at low to high concentrations, and γ is the power of PM2.5 concentration.
                              The baseline mortality rates for each of the five diseases are a key determinant of
                       the total PM2.5-related premature mortality and YLL of this study. The rates of mortality
                       due to each disease for each gender by five-year age bracket for 2019 was accessed from
                       the Korean Statistical Information Service (KOSIS) [29] and assumed to hold constant in
                       every scenario year. A table detailing the 2019 mortality rates by disease is provided in
                       Appendix A. Total population and population portion by five-year age bracket for the
                       base year and baseline scenario is taken from the UN population forecast, medium fertility
                       variant [30]. Life expectancy for each age bracket in the base year is attained from the
                       KOSIS [31] and is projected to increase gradually to 5% by 2050 in all scenarios, in line with
                       the UN life expectancy forecast for South Korea.
                              As the focus of this study is changes in the electricity generation sector, PM2.5 emis-
                       sions from other domestic sectors are estimated according to a simplified framework. The
                       purpose of including other sectors is to ensure a reasonable estimation of the total level of
                       PM2.5 exposure in South Korea to more accurately calculate the health impacts of changes
                       in PM2.5 emissions in the electricity generation sector. As the curve of the relative risk
                       functions flattens at higher levels of PM2.5 exposure, it is essential to include other sectors
                       as, without their inclusion, the positive health impacts of reduced PM2.5 emissions from
                       South Korea’s energy sector would be overestimated.
                              Using data from the Korea Energy Economics Institute (KEEI) [32], ton of oil equiva-
                       lent (TOE) final energy consumption by fuel type for the entire South Korean economy was
                       inputted in the base year 2019. As according to the KEEI data, fuel consumption informa-
                       tion was divided into the following five sectors: industry, transport, residential, commercial,
                       and public. The industrial sector includes agriculture, fishing, mining, manufacturing, and
                       construction. Emission factors for each fuel used in the five sectors, as well as for the elec-
                       tricity generation sector, are inputted according to the sources used in LEAP-IBC [33–36].
                       For the baseline scenario the energy intensity of the industrial sector was set to decrease
                       gradually by 21% by 2040 in accordance with South Korea’s 3rd energy master plan [37].
                       The public, commercial, and residential sectors total energy use in the baseline scenario
                       was projected by using the energy intensity per person of their perspective sectors in the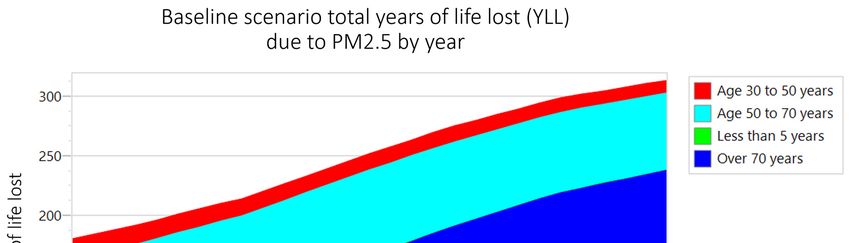
commercial, and public. The industrial sector includes agriculture, fishing, mining, man-
ufacturing, and construction. Emission factors for each fuel used in the five sectors, as well
as for the electricity generation sector, are inputted according to the sources used in LEAP-
IBC [33–36]. For the baseline scenario the energy intensity of the industrial sector was set
Climate 2021, 9, 101 to decrease gradually by 21% by 2040 in accordance with South Korea’s 3rd energy master 5 of 14
plan [37]. The public, commercial, and residential sectors total energy use in the baseline
scenario was projected by using the energy intensity per person of their perspective sec-
tors in
base thetobase
year year totheir
calculate calculate their total
total energy useenergy use according
according to the population
to the population of each
of each scenario
scenario year. The transport sector was calculated using the
year. The transport sector was calculated using the same method, and, additionally, itssame method, and, addition-
ally, itsintensity
energy energy intensity
was projected was projected
to graduallyto gradually
decreasedecrease
until 2040 until 2040 in accordance
in accordance with thewith
3rd
the 3 energy
energy
rd
master master plan. Emission
plan. Emission controlscontrols wereused
were then then used to reduce
to reduce final final emissions
emissions by theby
the electricity
electricity generation
generation sector
sector andandthethefivefive other
other sectors
sectors toto bringthem
bring themininlinelinewith
withsector
sector
emissiondata
emission datafrom
fromthe theNational
NationalCenter
Centerfor forFine
FineDust
DustInformation
Information[38], [38],and
andthe thetotal
totalPM2.5
PM2.5
exposure level of 2019
exposure level of 2019 [9]. [9].
Electricitydemand
Electricity demandisisprojectedprojected to to follow
follow thethe target
target demand
demand of the of9th
theBasic
9th Basic Plan,
Plan, with
with post-2034
post-2034 electricity
electricity demand demand
projectedprojected
from the from the gigawatt
gigawatt hour (GWh) hour per(GWh) pergrowth
person person
growth
rate ratethe
during during
2022–2034the 2022–2034
period ofperiod
0.61%.ofLosses0.61%.fromLosses from transmission
transmission and distri-
and distribution is
bution
set is setas
to 3.54% to according
3.54% as according
to energyto energy from
statistics statistics
the from
Koreathe KoreaPower
Electric Electric Power Cor-
Corporation
poration (KEPCO)
(KEPCO) [39]. An [39]. An additional
additional 4% loss 4% wasloss
addedwas toadded to the transmission
the transmission and distri-
and distribution
bution module to induce the electricity generation module to
module to induce the electricity generation module to produce additional GWhs to account produce additional GWhs
to account
for for the
the fact that notfact that not allGWh
all generated generated
will beGWh will bedue
consumed consumed due to the
to the practical practical
realities of
electricity
realities ofsystems.
electricity The 4% figure
systems. Thewas4% derived
figure was by derived
comparing past total GWhs
by comparing generated
past total GWhs
with total GWhs
generated demanded,
with total minus losses
GWhs demanded, due losses
minus to transmission and distribution.
due to transmission and distribution.
The
The electricity
electricity generation
generationsector sectorin inthe
thebaseline
baselinefollows
followsthe theeffective
effectivecapacities
capacitiesof ofthe
the
9th
9thBasic
BasicPlan,
Plan, outlined
outlinedin inFigure
Figure2, 2,with
withpost-2034
post-2034effective
effectiveenergy
energycapacities
capacitiesassumed
assumedto to
remain the same as the effective energy capacities of 2034. Electricity
remain the same as the effective energy capacities of 2034. Electricity generation is divided generation is divided
into
intobituminous
bituminouscoal, coal, LNG,
LNG, nuclear,
nuclear,hydro
hydro(including
(includingpumpedpumpedstorage),
storage),renewable
renewableenergy
energy
(RE),
(RE), and
and miscellaneous
miscellaneous (oil, (oil, distilled
distilled tower
tower waste
waste heat,
heat, residual
residual heatheat recovery,
recovery,natural
natural
gas
gas pressure turbine, by-product
pressure turbine, by-productgas). gas).South
South Korea
Korea alsoalso
uses uses
some some anthracite
anthracite coalcoal for
for elec-
electricity generation,
tricity generation, butbut it accounts
it accounts for for
only only
aboutabout1%1% of total
of total coalcoal energy
energy generation,
generation, so
so for
for this reason and the fact that the 9th Basic Plan’s future year effective
this reason and the fact that the 9th Basic Plan’s future year effective capacity targets do capacity targets do
not
not distinguish
distinguish between
between bituminous
bituminous and and anthracite
anthracite coalcoal capacity,
capacity,this thisstudy
studyassumes
assumesall all
electricity from coal in South Korea is produced by
electricity from coal in South Korea is produced by bituminous coal only.bituminous coal only.
Figure2.2. Planned
Figure Planned effective
effectivecapacity
capacityby
byyear
yearaccording
accordingto
tothe
the9th
9thBasic
BasicPlan.
Plan.
In
In the
the base
base year
year 2019
2019 and
and previous
previous years,
years, coal
coal has
has been
been used
used toto generate
generate dispropor-
dispropor-
tionally
tionallymore
moreelectricity
electricitythan
thanits
itspercentage
percentageof oftotal
totaleffective
effectivecapacity.
capacity.ForForexample,
example,inin2019,
2019,
coal
coal generated
generated 40%40% ofof electricity
electricity in
in South
South Korea
Korea even
even though
though ititonly
onlyembodied
embodied 32% 32%of of
total
total effective
effective capacity.
capacity. Conversely,
Conversely,in in2019,
2019,37%
37%of oftotal
totaleffective
effectivecapacity
capacitywas
wasLNG LNGbut but
only
only 26%
26% of total electricity
electricity was
was generated
generatedby byLNG.
LNG.InInboth
boththe
the9th
9th Basic
Basic Plan
Plan and
and thethe
3rd
3rd energy master plan the South Korean government has stated
energy master plan the South Korean government has stated its intention its intention to use more
use more
LNG
LNGand andless
lesscoal
coalto
to reduce
reduceairairpollution
pollutionand
andGHG
GHGemissions.
emissions. ToToreflect
reflectthis,
this,the
thecoal
coaland
and
LNG modules were dispatched proportional to their total effective capacities as outlined in
the 9th Basic Plan for each scenario year. Figure 3 shows a comparison of 2019 installed
capacity compared to 2019 generated electricity as a percentage of their respective totals
for each fuel source. Renewable energy (RE) is dispatched according to its full projected
effective capacity according to the 9th Basic Plan for each scenario year. The other energy
modules were dispatched according to their average percent of effective capacity utilized
during the 2016–2019 period.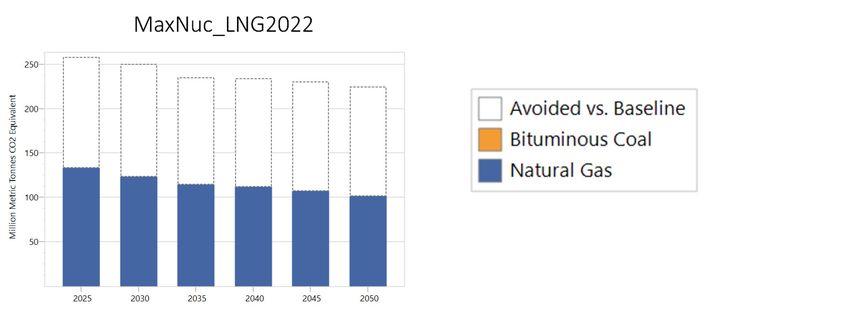
LNG modules were dispatched proportional to their total effective capacities as outlined
in the 9th Basic Plan for each scenario year. Figure 3 shows a comparison of 2019 installed
capacity compared to 2019 generated electricity as a percentage of their respective totals
for each fuel source. Renewable energy (RE) is dispatched according to its full projected
effective capacity according to the 9th Basic Plan for each scenario year. The other energy
Climate 2021, 9, 101 6 of 14
modules were dispatched according to their average percent of effective capacity utilized
during the 2016–2019 period.
Figure3.3.South
Figure SouthKorea
Korea2019
2019installed
installedcapacity
capacitycompared
comparedto
tofinal
finalenergy
energyproduction.
production.
Except for stated changes in the electricity generation sector, all other values, growth
Except for stated changes in the electricity generation sector, all other values, growth
rates, emission factors, etc. are the same in every scenario. Table 1 provides a description
rates, emission factors, etc. are the same in every scenario. Table 1 provides a description
of the baseline and three alternative scenarios. It should be noted that replacing all coal
of the baseline and three alternative scenarios. It should be noted that replacing all coal
electricity generation with LNG does not require the development of additional capacity
electricity generation with LNG does not require the development of additional capacity
beyond that outlined in the 9th Basic Plan.
beyond that outlined in the 9th Basic Plan.
Table 1. Outline of scenarios.
Table 1. Outline of scenarios.
Scenario Name
Scenario Name Description Description
Coal and LNG
Coal and LNG dispatch in proportion dispatch
to their in proportion
effective to their
capacities out-
effective capacities outlined in 9th Basic Plan.
lined in 9th Basic Plan. Renewable energy (RE) dispatches according to
Renewable energy (RE) dispatches according
Baseline its full effective capacity of 9th
Baseline Basic
to its Plan. Nuclear,
full effective capacityhydro, and others
of 9th Basic Plan.
are dispatched according to their average
Nuclear, hydro, percent of effective
and others capacity
are dispatched
according
utilized over to their average
the 2016–2019 period.percent of effective
capacity utilized over the 2016–2019 period.
LNG2022 From 2022 all coal electricity generation ceases and is replaced by LNG.
From 2022 and
2022 nuclear capacity is maintained, all coal
its electricity generation
use maximized. Coalceases
and
LNG2022
MaxNuc_ and is replaced by LNG.
LNG dispatch proportionally to their effective capacities outlined in 9th
9thplan 2022 nuclear capacity is maintained, and its use
Basic Plan.
maximized. Coal and LNG dispatch
MaxNuc_ MaxNuc_ 9thplan capacity is maintained, and its use maximized. From 2022
2022 nuclear proportionally to their effective capacities
LNG2022 all coal electricity generation ceases andinis9th
outlined replaced by LNG.
Basic Plan.
2022 nuclear capacity is maintained, and its use
3. Results MaxNuc_ LNG2022 maximized. From 2022 all coal electricity
generation
Through the created model of South Korea and the ceases and isofreplaced
utilization by LNG.
LEAP-IBC the fol-
lowing results were calculated. South Korea’s total numbers of deaths due to PM2.5 ex-
3.posure
Resultsis projected to rise dramatically over the coming decades, with most premature
deaths and
Through years
theofcreated
life (YLL) lost being
model in the
of South over-70-years
Korea age group, as
and the utilization of shown in Figure
LEAP-IBC the
4 and Figure 5. This is due to the fact that South Korea is an aging society with
following results were calculated. South Korea’s total numbers of deaths due to PM2.5 rising life
expectancy.
exposure is projected to rise dramatically over the coming decades, with most premature
deaths and years of life (YLL) lost being in the over-70-years age group, as shown in
Figures 4 and 5. This is due to the fact that South Korea is an aging society with rising life
expectancy.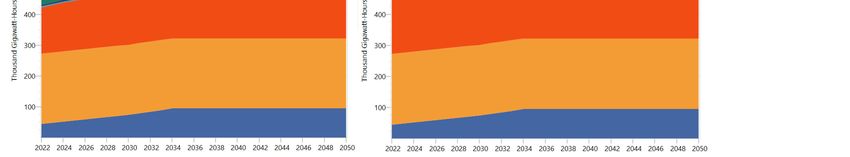
Climate
Climate  2021,9,
 Climate2021,
        2021, 9,9,101
                   101
                  101                                                                                                  777of
                                                                                                                           of14
                                                                                                                          of  15
                                                                                                                             15

                         Figure 4.
                         Figure4.
                         Figure    Projected
                                4.Projected  total
                                   Projectedtotal  premature
                                                   prematuredeaths
                                              totalpremature deathsby
                                                             deaths byage
                                                                    by  agegroup
                                                                       age groupdue
                                                                           group dueto
                                                                                 due  toPM2.5
                                                                                     to  PM2.5in
                                                                                        PM2.5  inbaseline
                                                                                              in  baselinescenario.
                                                                                                 baseline  scenario.
                                                                                                          scenario.

                         Figure5.5.Projected
                         Figure    Projectedtotal
                                             totalyears
                                                  yearsof
                                                        oflife
                                                           lifelost
                                                                lost(YLL)
                                                                     (YLL)by
                                                                          byage
                                                                             agegroup
                                                                                groupdue
                                                                                      dueto
                                                                                          toPM2.5
                                                                                            PM2.5in
                                                                                                  inbaseline
                                                                                                     baselinescenario.
                                                                                                              scenario.

                               Figure
                                 Figure666shows
                                Figure      showsthe
                                           shows     thetotal
                                                    the   totalgigawatt-hours
                                                         total   gigawatt-hours(GWhs)
                                                                gigawatt-hours    (GWhs)produced
                                                                                 (GWhs)  producedby
                                                                                         produced byeach
                                                                                                  by eachenergy
                                                                                                     each energysource
                                                                                                          energy  sourcein
                                                                                                                 source
                         the
                         in   baseline
                          inthe
                             the        and
                                 baseline
                                 baseline     thethe
                                            and
                                           and     three
                                                  the      alternative
                                                       three
                                                      three             scenarios.
                                                               alternative
                                                              alternative   scenarios.
                                                                           scenarios.
                               In each of the three alternative scenarios, population exposure to PM2.5 is reduced
                         compared to the baseline scenario, as shown in Figure 7. The “MaxNuc_LNG2022” scenario,
                         in which 2022 nuclear capacity is maintained and its use maximized, and all remaining
                         coal electricity generation is replaced by LNG, has the largest PM2.5 exposure reduction
                         impact, followed by the “LNG2022” scenario and then the “MaxNuc_9thplan” scenario.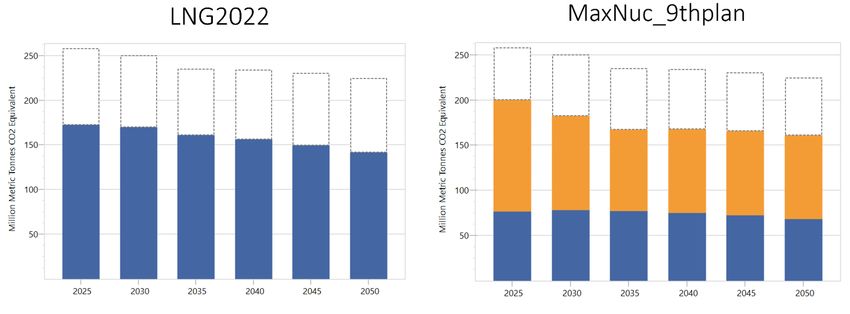
Climate 2021,
Climate 2021, 9,
9, 101
101 88 of
of 15
14
Figure 6. Gigawatt-hour (GWh) production by energy source in each scenario.
In each of the three alternative scenarios, population exposure to PM2.5 is reduce
compared to the baseline scenario, as shown in Figure 7. The “MaxNuc_LNG2022” sc
nario, in which 2022 nuclear capacity is maintained and its use maximized, and all r
maining coal electricity generation is replaced by LNG, has the largest PM2.5 exposur
reduction
Figure 6. Gigawatt-hour
Gigawatt-hour impact,
(GWh)
(GWh) followed
production by thesource
by energy “LNG2022” scenario and then the “MaxNuc_9thplan
in each scenario.
scenario.
In each of the three alternative scenarios, population exposure to PM2.5 is reduced
compared to the baseline scenario, as shown in Figure 7. The “MaxNuc_LNG2022” sce-
nario, in which 2022 nuclear capacity is maintained and its use maximized, and all re-
maining coal electricity generation is replaced by LNG, has the largest PM2.5 exposure
reduction impact, followed by the “LNG2022” scenario and then the “MaxNuc_9thplan”
scenario.
Figure
Figure7.7.Reduction
Reductionin
inpopulation-weighted
population-weightedPM2.5
PM2.5exposure
exposure in
in each
each alternative
alternative scenario.
scenario.
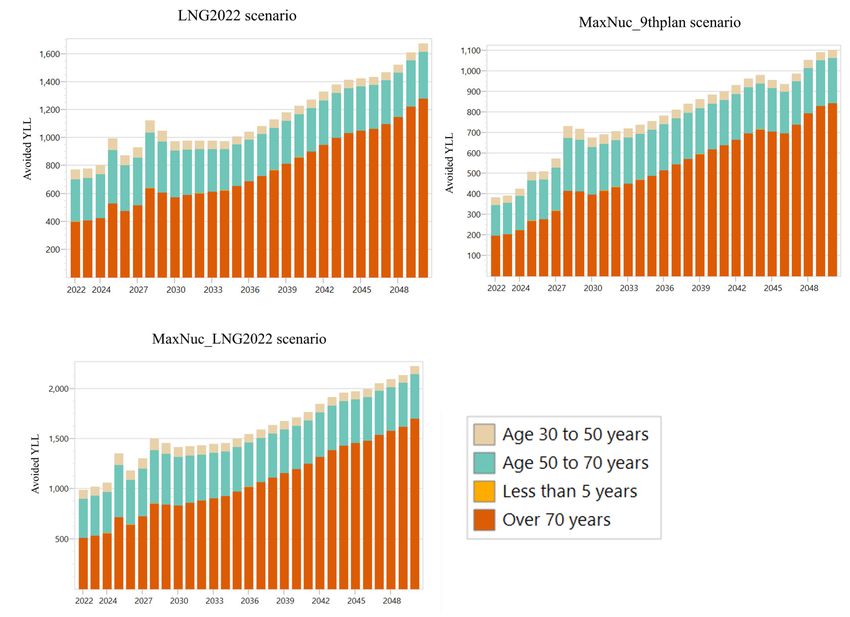
The health and climate benefits of all three scenarios follow the same order in terms of
positive impacts, as shown in Table 2. The “MaxNuc_LNG2022” scenario yields the largest
benefits in terms of both avoided premature mortality, as shown in Figure 8, and also in
terms of GHG emissions mitigation. Given the fact that nuclear power currently has the
lowest cost per GWh produced in South Korea’s energy system, the “MaxNuc_9thplan”
Figure 7. Reduction in population-weighted PM2.5 exposure in each alternative scenario.
scenario, in which 2022 nuclear capacity is maintained and its use maximized, would yield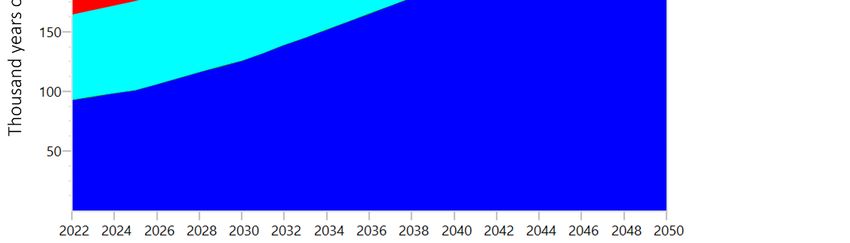
Climate 2021, 9, 101                                                                                                           9 of 14

                                  the greatest health and climate benefits relative to cost. The “LNG2022” scenario would
                                  result in the highest cost-to-benefit ratio as LNG electricity generation is more expensive
                                  than nuclear electricity generation in South Korea.

       Table 2. Avoided premature mortality, years of life lost (YLL), and MtCO2 e emissions (100-year GWP) compared to baseline.

                               LNG2022                              MaxNuc_9thplan                       MaxNuc_LNG2022
                   Premature                            Premature                               Premature
      Year                      YLL         MtCO2 e                      YLL         MtCO2 e                    YLL        MtCO2 e
                   Mortality                            Mortality                               Mortality
      2022               66      771          88.1          33            383         51.1          84           988         121.9
      2023               67      778          87.8          34            392         53.6          88          1020         123.3
      2024               70      805          87.4          37            426         56.0          91          1058         124.6
      2025               87      995          86.2          44            508         58.3         117          1350         125.0
      2026               76      872          85.1          45            510         60.5         103          1182         125.6
      2027               82      928          84.1          51            573         62.7         115          1301         126.1
      2028              100     1122          82.9          65            730         64.7         134          1498         126.5
      2029               94     1049          81.7          64            716         66.7         131          1455         126.8
      2030               88      974          80.7          61            674         68.6         128          1414         127.2
      2031               89      977          78.9          63            690         68.7         130          1424         125.6
      2032               91      978          77.1          65            705         68.7         132          1431         124.0
      2033               92      978          75.4          67            719         68.7         135          1445         122.4
      2034               92      975          73.5          70            736         68.6         138          1456         120.6
      2035               96     1008          74.5          72            754         68.3         143          1500         121.1
      2036              101     1041          75.4          76            782         67.9         150          1545         121.6
      2037              107     1082          76.3          80            812         67.6         157          1590         122.0
      2038              113     1129          77.1          84            839         67.3         164          1635         122.3
      2039              120     1180          77.9          88            862         67.0         170          1674         122.6
      2040              127     1229          78.6          91            885         66.7         177          1712         122.9
      2041              133     1272          79.3          94            901         66.4         185          1766         123.2
      2042              141     1328          79.9          98            930         66.1         195          1844         123.4
      2043              148     1381          80.5         103            963         65.8         205          1914         123.5
      2044              153     1413          81.0         106            980         65.5         212          1958         123.6
      2045              156     1424          81.5         105            955         65.3         216          1973         123.7
      2046              158     1434          81.9         103            936         65.0         220          1993         123.8
      2047              164     1467          82.3         110            987         64.7         229          2054         123.7
      2048              171     1522          82.6         119           1053         64.5         236          2093         123.7
Climate 2021, 9, 101                                                                                                          10 of 15
      2049              183     1610          82.9         124           1091         64.2         242          2135         123.6
      2050              192     1674          83.1         126           1103         64.0         255          2223         123.4

                                             AvoidedYLL
                                  Figure8.8.Avoided
                                 Figure              YLLfor
                                                          foreach
                                                              eachscenario
                                                                   scenariocompared
                                                                            comparedtotobaseline
                                                                                         baselineby
                                                                                                  byyear.
                                                                                                     year.

                                      All three alternative scenarios would have substantial climate change mitigation im-
                                 pacts, with large GHG emissions mitigation in each scenario as shown in Table 2 and Fig-
                                 ure 9. The maintenance and maximization of use of South Korea’s 2022 nuclear electricity
                                 generation capacity shows strong potential to vastly reduce GHG emissions at low rela-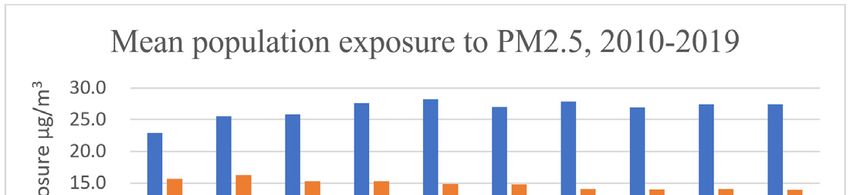
Climate 2021, 9, 101                                                                                                    10 of 14

                       Figure 8. Avoided YLL for each scenario compared to baseline by year.
                             All three alternative scenarios would have substantial climate change mitigation
                             All three alternative scenarios would have substantial climate change mitigation im-
                       impacts, with large GHG emissions mitigation in each scenario as shown in Table 2 and
                       pacts,
                       Figurewith    large
                                9. The     GHG emissions
                                       maintenance            mitigation in
                                                      and maximization     of each
                                                                              use ofscenario  as shown
                                                                                     South Korea’s   2022innuclear
                                                                                                            Table 2electricity
                                                                                                                     and Fig-
                       ure  9. The  maintenance    and  maximization    of  use  of South  Korea’s  2022  nuclear
                       generation capacity shows strong potential to vastly reduce GHG emissions at low relative   electricity
                       generation    capacity
                       cost as nuclear        shows generation
                                          electricity  strong potential   to lowest
                                                                    has the   vastly reduce   GHG
                                                                                       cost per  GWh emissions
                                                                                                       generatedat low   rela-
                                                                                                                    in South
                       tive cost energy
                       Korea’s    as nuclear
                                          mixelectricity
                                               and due to generation   has nuclear
                                                             the fact that  the lowest   cost generation
                                                                                     power    per GWh generated
                                                                                                           does not in  South
                                                                                                                     directly
                       Korea’s    energy mix   and
                       produce any GHG emissions.   due   to the fact that  nuclear   power   generation   does not   directly
                       produce any GHG emissions.

                       Figure 9. Energy sector million tons of CO2 equivalent (MTCO2 e) emissions, and avoided emissions
                       Figure 9. Energy sector million tons of CO2 equivalent (MTCO2e) emissions, and avoided emis-
                       compared to baseline.
                       sions compared to baseline.
                             It should be noted that there is greater uncertainty regarding potential benefits for
                       the post-2034 period. There is no detailed government policy outlining the planned
                       energy mix post-2034; therefore, the baseline scenario of this research assumes that the
                       2034 effective energy capacities will be maintained for the 2035–2050 period. The reason
                       this study includes analysis of 2035–2050, despite the lack of detailed government plans
                       of effective capacities, is that as South Korea has recently announced its 2050 Carbon
                       Neutrality goal it is important to estimate potential benefits of reduced coal use until that
                       year. In Tables 3 and 4 the benefits are divided into the 2022–2034 and 2035–2050 periods for
                       comparison. In the 2022–2034 period, where potential benefits can be contrasted with the
                       detailed 9th Basic Plan, benefits are smaller than the 2035–2050 period but still significant.

                       Table 3. Summary of avoided premature mortality (and YLL) compared to baseline.

                                                   2022–2034          2035–2050           Total         Average per Year
                              LNG2022             1093 (12,203)     2263 (21,193)     3356 (33,396)         116 (1152)
                         MaxNuc_9thplan            698 (7762)       1581 (14,831)     2278 (22,593)          79 (779)
                         MaxNuc_LNG2022           1527 (17,022)     3156 (29,609)     4683 (46,631)         161 (1608)
Climate 2021, 9, 101 11 of 14
Table 4. Summary of avoided MTCO2 e GHG emissions compared to baseline.
2022–2034 2035–2050 Total Average per Year
LNG2022 1069 1275 2344 80.8
MaxNuc_9thplan 817 1056 1873 65
MaxNuc_LNG2022 1619 1968 3588 123.7
4. Discussion and Conclusions
Fuel substitution in South Korea’s electricity generation sector would help mitigate
national PM2.5 levels and thus reduce PM2.5-related premature mortality. As South Korea
is an aging society, the negative effects of high PM2.5 exposure levels will become more
severe in the future, and increased use of LNG and nuclear power would lead to significant
health benefits. Additionally, the increased use of LNG and nuclear would move South
Korea towards a Paris Agreement-compatible low carbon development pathway.
The study finds that use of LNG instead of coal over the 2022–2050 period would
result in an average of 116 fewer premature deaths (1152 YLL) and 80.8 MTCO2 e fewer
emissions per year in South Korea. Over the same period, maintaining and maximizing
use of its 2022 nuclear energy capacity, combined with replacing coal use with LNG, would
result in an average of 161 fewer premature deaths (1608 YLL) and 123.7 MTCO2 e fewer
emissions per year. Maintaining and maximizing its 2022 nuclear electricity generation
capacity would lead to the greatest avoidance of premature mortality and GHG emissions
relative to cost. Given the benefits of maximizing the use of nuclear power, and given that
nuclear power is the cheapest available large-scale electricity option in the near term, the
South Korean government should carefully consider its current plan to phase out nuclear
energy and communicate the costs and benefits of using nuclear power clearly to the public.
However, the limitations to larger-scale use of LNG and nuclear in the context of
South Korea must be acknowledged. South Korea does not have a domestic supply of
natural gas or access to gas pipelines; therefore, it must rely on expensive LNG imports.
The cost and price uncertainty of importing LNG as a fuel source for power generation
is a significant impediment to increased use of LNG. For example, in early 2021, due to a
colder winter in Northeast Asia increasing LNG demand, as well as production problems
in Malaysia, spot market value of LNG cargoes reached a record high. To address this
issue, South Korea is expanding its LNG storage capacities to avoid having to purchase
LNG on the international market at periods of high prices, but LNG will likely remain
expensive relative to other fuel options into the future. Nuclear power is currently the
cheapest electricity generation option available to South Korea, but public opposition to
nuclear power has intensified since the 2011 Fukushima nuclear disaster. Public concern
will need to be addressed first before increasing the use of nuclear power.
Increased use of renewable energy (RE) instead of coal would yield similar health
and climate benefits as nuclear power, but there are significant barriers to the expansion of
renewable energy generating capacity in South Korea. Practical limitations are the lack of
constant wind for wind power generation and lack of space for large solar PV sites [40].
The lack of effective support for small-scale RE providers and local opposition to RE sites
construction are major issues as well. In 2016, 37.5% of canceled or postponed solar PV and
wind power projects in South Korea were the result of local opposition [41]. Profit sharing
has been suggested as a means of reducing local opposition, but this may be insufficient
in isolation. Given the health and climate benefits of renewable energy, its use should be
expanded as much and as rapidly as is possible.
The framing of a policy can have a substantial impact on its chances of being im-
plemented. The alternative co-benefit framework outlined in this research focuses on air
pollution as the primary goal, and climate change as a secondary goal. Focusing on local
benefits, such as reduced air pollution, can lead to greater support for policy action and
tolerance for high initial costs. Climate action is currently not a high-ranking concern of
the South Korean electorate. Therefore, stressing the local and near-term positive outcomesClimate 2021, 9, 101 12 of 14
of climate change mitigation action would be a potential means of improving support
policies containing climate change mitigation effects. Through the increased use of LNG
and nuclear energy, as well as development of renewable energy, both air pollution and
climate change mitigation can be achieved.
The limitations of this study are the long-term uncertainty of total PM2.5 emissions
outside of South Korea’s energy sector and the fact this study assumes that baseline mortal-
ity rates by age bracket for each disease will remain constant throughout the 2022–2050
period. As South Korea’s energy sector is only responsible for a portion of South Korea’s
total PM2.5 exposure levels, the scale of the health benefits of using alternative fuels to coal
will be significantly affected by the changes in PM2.5 emissions from both other domestic
sectors and other countries in the region. Baseline mortality rates for each disease could
rise or fall in the future, which would also affect the amount of premature mortality and
YLL in projections. The certainty of the results of this study could be improved by more
detailed accounting and estimation of future domestic and international PM2.5 emissions
outside of South Korea’s energy sector. Utilizing a concrete government plan with details
of South Korea’s planned post-2034 energy capacities for comparison would also enable a
more accurate calculation of the benefits of alternative energy pathways.
The lack of predictability and consistency between different administrations’ energy
policies is a major issue that needs to be addressed in South Korea. Long-term policy
directions often change with each new administration. For example, in 2014 under the
conservative Park Geun-hye administration the 2nd energy master plan was announced,
which outlined policies until 2035 and included as a key point the goal to maximize the use
of nuclear energy in the energy mix, due to its economic and environmental benefits [42].
However, in 2019 under the liberal Moon Jae-in administration the 3rd energy master plan
was released, which announced the goal to phase out nuclear energy entirely from South
Korea’s energy mix [37]. The lack of long-term commitment to a clear policy direction
in its energy sector will likely be a hindrance to South Korea’s goal of achieving carbon
neutrality by 2050.
As pollution knows no political boundaries, mitigation of air pollution and its negative
impacts requires urgent action to be taken at all governance levels. While this study focuses
on national energy sector policy options to reduce PM2.5 levels in South Korea, South
Korea is strongly affected by air pollutants emitted from neighboring countries, particularly
China [43–46]. Therefore, long-term regional cooperation and the reduction of air pollutant
emissions is essential for a more impactful reduction of PM2.5 levels and PM2.5-related
premature mortality in South Korea.
Author Contributions: Conceptualization, D.P. and T.Y.J.; methodology, D.P.; software, D.P.; vali-
dation, D.P.; formal analysis, D.P.; investigation, D.P.; resources, D.P.; data curation, D.P.; writing—
original draft preparation, D.P.; writing—review and editing, D.P. and T.Y.J.; visualization, D.P.;
supervision, T.Y.J.; project administration, T.Y.J. All authors have read and agreed to the published
version of the manuscript.
Funding: This research received no external funding.
Institutional Review Board Statement: Not applicable.
Informed Consent Statement: Not applicable.
Data Availability Statement: Publicly available datasets (UN Population Prospects 2019, KOSIS
Death Rates by Cause for South Korea 2019, and KEEI Monthly Energy Statistics 2020/12 were used
for scenario development in this study. The data can be found here: https://population.un.org/
wpp/Publications/ (accessed on 4 October 2020), https://kosis.kr/eng/ (accessed on 25 December
2020) and http://www.kesis.net/ (accessed on 11 February 2021) respectively.
Acknowledgments: This research was supported by Charlie Heaps and the rest of the LEAP devel-
opment team of the Stockholm Environment Institute (SEI) through their development and provision
of the Low Emissions Analysis Platform (LEAP)—Integrated Benefits Calculator (IBC).
Conflicts of Interest: The authors declare no conflict of interest.Climate 2021, 9, 101 13 of 14
Appendix A
Table A1. 2019 deaths per 100,000 people by gender in each age bracket due to ischemic heart disease, stroke, chronic
obstructive pulmonary disease (COPD), and lung cancer in South Korea.
Ischemic Heart Ischemic Heart Stroke, Stroke, COPD, COPD, Lung Cancer, Lung Cancer,
Disease, Male Disease, Female Male Female Male Female Male Female
30–34 years old 2.3 0.2 1.8 1.6 0.2 0.1 0.2 0.3
35–39 years old 4.1 0.5 4.5 2.5 0.2 0.1 1.0 0.6
40–44 years old 6.4 0.9 8.2 4.3 0.2 0.1 3.2 2.3
45–49 years old 12.6 1.7 12.8 6.9 0.4 0.3 6.6 4.0
50–54 years old 21.9 2.3 22.0 9.6 1.4 0.6 13.0 7.3
55–59 years old 28.3 4.1 31.1 13.1 3.5 0.6 34.5 11.8
60–64 years old 42.8 8.3 45.0 17.9 8.0 2.1 75.1 22.2
65–69 years old 62.4 15.7 75.9 33.3 21.5 4.0 157.8 34.6
70–74 years old 98.8 34.0 128.9 65.2 45.9 10.3 264.1 55.4
75–79 years old 174.9 96.4 294.9 166.5 123.4 23.0 446.7 89.3
80 years or older 437.3 352.2 702.8 603.7 397.8 140.8 674.1 174.8
References
1. World Health Organisation (WHO). Ambient Air Pollution. Available online: https://www.who.int/teams/environment-
climate-change-and-health/air-quality-and-health/ambient-air-pollution (accessed on 3 January 2021).
2. Cohen, A.J.; Brauer, M.; Burnett, R.; Anderson, H.R.; Frostad, J.; Estep, K.; Balakrishnan, K.; Brunekreef, B.; Dandona, L.; Dandona,
R.; et al. Estimates and 25-Year Trends of the Global Burden of Disease Attributable to Ambient Air Pollution: An Analysis of
Data from the Global Burden of Diseases Study 2015. Lancet 2017, 389, 1907–1918. [CrossRef]
3. European Environmental Agency (EEA). Air Quality in Europe—2018 Report No. 12/2018; European Environmental Agency (EEA):
Copenhagen, Denmark, 2018. [CrossRef]
4. Sicard, P.; Agathokleous, E.; De Marco, A.; Paoletti, E.; Calatayud, V. Urban Population Exposure to Air Pollution in Europe over
the Last Decades. Environ. Sci. Eur. 2021, 33, 28. [CrossRef] [PubMed]
5. Environmental Protection Agency (EPA). Particulate Matter (PM) Basics. Available online: https://www.epa.gov/pm-pollution/
particulate-matter-pm-basics (accessed on 14 January 2021).
6. Burnett, R.T.; Pope, C.A.; Ezzati, M.; Olives, C.; Lim, S.S.; Mehta, S.; Shin, H.H.; Singh, G.; Hubbell, B.; Brauer, M.; et al. An
Integrated Risk Function for Estimating the Global Burden of Disease Attributable to Ambient Fine Particulate Matter Exposure.
Environ. Health Perspect. 2014, 122, 397–403. [CrossRef] [PubMed]
7. OECD. The Economic Consequences of Outdoor Air Pollution; OECD: Paris, France, 2016; Available online: www.oecd.org/
environment/the-economic-consequences-of-outdoor-air-pollution-%0A9789264257474-en.htm (accessed on 8 December 2020).
8. WHO. Ambient Air Pollution: A Global Assessment of Exposure and Burden of Disease; World Health Organization: Geneva,
Switzerland, 2016.
9. WHO. WHO Air Quality Guidelines for Particulate Matter, Ozone, Nitrogen Dioxide and Sulfur Dioxide; World Health Organization:
Geneva, Switzerland, 2005.
10. OECD. Air Quality and Health: Exposure to PM2.5 Fine Particles—Countries and Regions; OECD Environment Statistics: Paris,
France, 2020. [CrossRef]
11. Yoon, H. Effects of Particulate Matter (PM10 ) on Tourism Sales Revenue: A Generalized Additive Modeling Approach. Tour.
Manag. 2019, 74, 358–369. [CrossRef]
12. Choi, Y.; Yoon, H.; Kim, D. Where Do People Spend Their Leisure Time on Dusty Days? Application of Spatiotemporal Behavioral
Responses to Particulate Matter Pollution. Ann. Reg. Sci. 2019, 63, 317–339. [CrossRef]
13. Jeon, H.S.; Lee, S.; Lee, J.; Chun, J.S. Impacts of Multilevel Factors on Depressive Symptoms among Adolescents in South Korea.
Child. Youth Serv. Rev. 2020, 119, 105591. [CrossRef]
14. Intergovernmental Panel on Climate Change (IPCC). Climate Change 2014: Synthesis Report. Contribution of Working Groups I, II
and III to the Fifth Assessment Report of the Intergovernmental Panel on Climate; IPCC: Geneva, Switzerland, 2014; Available online:
https://www.ipcc.ch/report/ar5/syr/ (accessed on 24 February 2021).
15. OECD. Ancillary Benefits and Costs of Greenhouse Gas Mitigation; OECD: Paris, France, 2000. [CrossRef]
16. Parry, I.; Veung, C.; Heine, D. How Much Carbon Pricing Is in Countries’ Own Interests? The Critical Role of Co-Benefits. Clim.
Chang. Econ. 2015, 6, 1550019. [CrossRef]
17. Air Pollution No. 1 Environmental Concern for Koreans: Survey; The Korea Times: Seoul, Korea, 2020; Available online: https:
//www.koreatimes.co.kr/www/nation/2020/07/371_292668.html (accessed on 4 September 2020).
18. Polled Citizens, Experts Prioritize Fine Dust in Environmental Policies; The Korea Times: Seoul, Korea, 2020; Available online:
https://www.koreatimes.co.kr/www/nation/2020/06/371_291148.html (accessed on 4 September 2020).Climate 2021, 9, 101 14 of 14
19. Ministry of Trade Industry and Energy Republic of Korea. The 9th Basic Plan for Long-Term Electricity Supply and Demand; Ministry
of Trade Industry and Energy Republic of Korea: Sejong, Korea, 2020. Available online: http://www.motie.go.kr/motie/ne/
presse/press2/bbs/bbsView.do?bbs_seq_n=163670&bbs_cd_n=81 (accessed on 25 January 2021).
20. LEAP Introduction. Available online: https://leap.sei.org/default.asp?action=introduction (accessed on 9 October 2020).
21. Stockholm Environment Institute (SEI). The Long-Range Energy Alternatives Planning-Integrated Benefits Calculator (LEAP-IBC) Key
Features in LEAP-IBC; Stockholm Environment Institute: Stockholm, Sweden, 2017; Available online: https://mediamanager.sei.
org/documents/Publications/SEI-Factsheet-LEAP-IBC-2.pdf (accessed on 21 September 2020).
22. IIASA ECLIPSE V5a Global Emission Fields. Available online: https://iiasa.ac.at/web/home/research/researchPrograms/air/
ECLIPSEv5a.html (accessed on 17 February 2021).
23. Henze, D.K.; Hakami, A.; Seinfeld, J.H. Development of the Adjoint of GEOS-Chem. Atmos. Chem. Phys. 2007, 7, 2413–2433.
[CrossRef]
24. Kuylenstierna, J.C.I.; Heaps, C.G.; Ahmed, T.; Vallack, H.W.; Hicks, W.K.; Ashmore, M.R.; Malley, C.S.; Wang, G.; Lefevre, E.N.;
Anenberg, S.C.; et al. Development of the Low Emissions Analysis Platform—Integrated Benefits Calculator (LEAP-IBC) Tool to
Assess Air Quality and Climate Co-Benefits: Application for Bangladesh. Environ. Int. 2020, 145, 106155. [CrossRef] [PubMed]
25. Nakarmi, A.M.; Sharma, B.; Rajbhandari, U.S.; Prajapati, A.; Malley, C.S.; Kuylenstierna, J.C.I.; Vallack, H.W.; Henze, D.K.;
Panday, A. Mitigating the Impacts of Air Pollutants in Nepal and Climate Co-Benefits: A Scenario-Based Approach. Air Qual.
Atmos. Health 2020, 13, 361–370. [CrossRef]
26. Park, N.B.; Yun, S.J.; Jeon, E.C. An Analysis of Long-Term Scenarios for the Transition to Renewable Energy in the Korean
Electricity Sector. Energy Policy 2013, 52, 288–296. [CrossRef]
27. Hong, J.H.; Kim, J.; Son, W.; Shin, H.; Kim, N.; Lee, W.K.; Kim, J. Long-Term Energy Strategy Scenarios for South Korea: Transition
to a Sustainable Energy System. Energy Policy 2019, 127, 425–437. [CrossRef]
28. Lee, S.; Park, J.W.; Song, H.J.; Maken, S.; Filburn, T. Implication of CO2 Capture Technologies Options in Electricity Generation in
Korea. Energy Policy 2008, 36, 326–334. [CrossRef]
29. Korean Statistical Information Service (KOSIS). Deaths and Death Rates by Cause (236 Item), Sex, and Age (by Five-Year Age Group);
Korean Statistical Information Service (KOSIS): Daejeon, Korea, 2020; Available online: https://kosis.kr/eng/ (accessed on 25
December 2020).
30. United Nations Department of Economic and Social Affairs. World Population Prospect 2019: Population by Age Groups—Both Sexes
2019; United Nations: New York, NY, USA, 2019.
31. Korean Statistical Information Service (KOSIS). Complete Life Tables; Korean Statistical Information Service (KOSIS): Daejeon, Korea,
2020; Available online: https://kosis.kr/statHtml/statHtml.do?orgId=101&tblId=DT_1B42 (accessed on 10 November 2020).
32. Korean Energy Economics Institute (KEEI). Monthly Energy Statistics 2020/12; Korean Energy Economics Institute: Ulsan, Korea,
2020; Available online: http://www.kesis.net/sub/sub_0003.jsp (accessed on 11 February 2021).
33. IPCC. IPCC Guidelines for National Greenhouse Gas Inventories Stationary Combustion; IPCC: Geneva, Switzerland, 2006; Volume 2. [CrossRef]
34. EEA; Berdowski, J.J.M.; Verhoeve, P. EEA Combustion in Energy and Transformation Industries; European Environment Agency:
Copenhagen, Denmark, 2016; pp. 1–124.
35. Bond, T.C.; Streets, D.G.; Yarber, K.F.; Nelson, S.M.; Woo, J.H.; Klimont, Z. A Technology-Based Global Inventory of Black and
Organic Carbon Emissions from Combustion. J. Geophys. Res. Atmos. 2004, 109, 1–43. [CrossRef]
36. Battye, R.; Battye, W.; Overcash, C.; Fudge, S. Development and Selection of Ammonia Emission Factors. In EPA Contract 68-D3
0034; EPA: Research Triangle Park, NC, USA, 1994; pp. 1–111.
37. Ministry of Trade, industry and Energy (MOTIE). Third Energy Master Plan; Ministry of Trade, Industry and Energy: Sejong,
Korea, 2019.
38. National Center for Fine Dust Information, Emissions by Sector. Available online: https://airemiss.nier.go.kr (accessed on 26
December 2020).
39. Korea Electric Power Corporation KEPCO. 2020 KEPCO in Brief ; Korea Electric Power Corporation: Naju, Korea, 2020; Available online:
https://home.kepco.co.kr/kepco/KO/ntcob/list.do?boardCd=BRD_000098&menuCd=FN05030102 (accessed on 13 March 2021).
40. Jung, T.Y.; Park, C. Estimation of the Cost of Greenhouse Gas Reduction in Korea under the Global Scenario of 1.5 ◦ C Temperature
Increase. Carbon Manag. 2018, 9, 503–513. [CrossRef]
41. Kim, K.J.; Lee, H.; Koo, Y. Research on Local Acceptance Cost of Renewable Energy in South Korea: A Case Study of Photovoltaic
and Wind Power Projects. Energy Policy 2020, 144, 111684. [CrossRef]
42. Ministry of Trade, Industry and Energy (MOTIE). Second Energy Master Plan; Ministry of Trade, Industry and Energy: Sejong,
Korea, 2014.
43. Kim, Y.; Kim, S.W.; Yoon, S.C.; Kim, M.H.; Park, K.H. Aerosol Properties and Associated Regional Meteorology during Winter
Pollution Event at Gosan Climate Observatory, Korea. Atmos. Environ. 2013, 85, 9–17. [CrossRef]
44. Lee, S.; Ho, C.H.; Choi, Y.S. High-PM10 Concentration Episodes in Seoul, Korea: Background Sources and Related Meteorological
Conditions. Atmos. Environ. 2011, 45, 7240–7247. [CrossRef]
45. Lee, S.; Ho, C.H.; Lee, Y.G.; Choi, H.J.; Song, C.K. Influence of Transboundary Air Pollutants from China on the High-PM10
Episode in Seoul, Korea for the Period October 16–20, 2008. Atmos. Environ. 2013, 77, 430–439. [CrossRef]
46. Lee, H.; Park, S.S.; Kim, K.W.; Kim, Y.J. Source Identification of PM2.5 Particles Measured in Gwangju, Korea. Atmos. Res. 2008,
88, 199–211. [CrossRef]You can also read