An analysis of the distributional impact of excise duty in Uganda using a tax-benefit microsimulation model - unu-wider
←
→
Page content transcription
If your browser does not render page correctly, please read the page content below

WIDER Working Paper 2020/70

An analysis of the distributional impact of
excise duty in Uganda using a tax-benefit
microsimulation model

Susan Namirembe Kavuma,1 Christine Byaruhanga,2 Nicholas
Musoke,3 Patrick Loke,4 Michael Noble,5 and Gemma Wright6

June 2020
Abstract: The distributional analysis of consumption taxes is useful for establishing the welfare
impact of tax policy. This paper uses the UGAMOD microsimulation model to establish the tax
incidence and welfare impact of excise duty in Uganda. The results reveal that households in the
top deciles pay more in excise duty as a percentage of their consumption than households in the
bottom deciles. Post-fiscal consumption is almost the same as pre-fiscal consumption for the first
seven deciles, but there is a sharp reduction in post-fiscal consumption in the tenth decile. The
paper also examines a policy reform in excise duty on mobile phone airtime, notes an annual
increase in tax revenue of UGX 8,371 million, and does not observe an overall change in income
inequality or poverty. It concludes that UGAMOD is a useful tool for tax policy makers to evaluate
the impact of tax reforms on revenue collection and welfare.
Key words: excise duty, microsimulation, poverty, Uganda
JEL classification: D31, E17, H20, H22
Acknowledgements: The results presented here are based on UGAMOD v1.4. UGAMOD is
developed, maintained, and managed by UNU-WIDER in collaboration with the EUROMOD
team at the University of Essex’s Institute for Social and Economic Research, Southern African
Social Policy Research Insights, and local partners in Ecuador, Ethiopia, Ghana, Mozambique,
Tanzania, Uganda, Viet Nam, and Zambia under the aegis of the SOUTHMOD project. The local
partners for UGAMOD are the Uganda Revenue Authority and Makerere University. The authors
are indebted to the many people who have contributed to the development of SOUTHMOD and
UGAMOD. The results and interpretation presented in this publication are solely the authors’
responsibility.

1 Makerere University, Kampala, Uganda, corresponding author: suzkav@yahoo.com; 2 Southern African Social Policy Research

Institute, Cape Town, South Africa; 3 Uganda Revenue Authority, Kampala, Uganda; 4 Uganda Revenue Authority, Kampala,
Uganda; 5 Southern African Social Policy Research Institute, Hove, United Kingdom; 6 Southern African Social Policy Research
Institute, Hove, United Kingdom
This study has been prepared within the UNU-WIDER project on SOUTHMOD – simulating tax and benefit policies for
development with funds received by the Ministry for Foreign Affairs of Finland.
Copyright © UNU-WIDER 2020
Information and requests: publications@wider.unu.edu
ISSN 1798-7237 ISBN 978-92-9256-827-6
https://doi.org/10.35188/UNU-WIDER/2020/827-6
Typescript prepared by Merl Storr.
The United Nations University World Institute for Development Economics Research provides economic analysis and policy
advice with the aim of promoting sustainable and equitable development. The Institute began operations in 1985 in Helsinki,
Finland, as the first research and training centre of the United Nations University. Today it is a unique blend of think tank, research
institute, and UN agency—providing a range of services from policy advice to governments as well as freely available original
research.
The Institute is funded through income from an endowment fund with additional contributions to its work programme from
Finland, Sweden, and the United Kingdom as well as earmarked contributions for specific projects from a variety of donors.
Katajanokanlaituri 6 B, 00160 Helsinki, Finland
The views expressed in this paper are those of the author(s), and do not necessarily reflect the views of the Institute or the United
Nations University, nor the programme/project donors.
1     Introduction

There is renewed commitment to fund national development goals and sustainable development
goals (SDGs) using domestic revenue rather than external resources, as declared by the Addis Tax
Initiative in 2016. This commitment is premised on the notion that domestic resources offer a
stabler and more sustainable source of income, and offer citizens an opportunity to hold their
leaders accountable, which promotes good governance. Like other developing countries, Uganda
faces a long-term financing need to implement its development agenda and realize the SDGs. To
raise more domestic revenue, the government of Uganda has implemented several tax policy
reforms, such as the establishment in 1991 of the Uganda Revenue Authority (URA), an institution
with a mandate to collect domestic revenue; the introduction of value added tax (VAT) in 1996;
and the subsequent modernization of tax administration systems such as the E-tax system.

The tax reforms in Uganda have resulted in increased tax revenue over time, with a tax-to-gross
domestic product (GDP) ratio increasing from 10.7 per cent in 2000 to 15.1 per cent in 2018.
Despite the improved performance of the tax policy, Uganda’s taxes collection is still below the
average tax-to-GDP ratio for African countries. The Organization for Economic Cooperation and
Development (OECD) estimated the tax-to-GDP ratio of 26 African countries including Uganda
at 17.2 per cent in 2017, as compared with Uganda’s ratio of 13.5 per cent (OECD 2019). As is
common in most developing countries, the tax structure in Uganda is dominated by indirect taxes,
which contributed two thirds (64.1 per cent) of total tax revenue in 2018 (OECD 2019). The
concern therefore is the progressivity of indirect taxes, which is documented to be less than that
for direct taxes. In many countries, microsimulation models have been widely used to analyse
redistributive aspects of tax policy reforms (e.g., Bourguignon and Spadaro 2006; Decoster et al.
2011; Leahy et al. 2011; Maskaeva et al. 2019). Microsimulation models are desirable because they
are less costly and time-consuming than field-based impact evaluation studies. In Uganda’s case,
there is scant literature that analyses the distributive impact of taxes in general and excise duty in
particular on the welfare of citizens.

In the past, few studies attempted to analyse the distributional effects of indirect taxes, due to data
limitations and lack of consensus on the conceptual framework for analysing the consumption tax
incidence (Warren 2008). Recently developed static microsimulation models such as EUROMOD
have addressed the data challenge by enriching the microsimulation models with expenditure data,
making them more attractive for analysing the distributional effects of indirect taxes using the
EUROMOD framework (e.g., Decoster et al. 2011; Gcabo et al. 2019; Immervoll et al. 2007; Jara
and Tumino 2013; Leahy et al. 2011). This study uses UGAMOD—a tax-benefit microsimulation
model for Uganda (Waiswa et al. 2020) built using the EUROMOD software (University of Essex
2019)—to analyse the distributional effect of the excise duty in Uganda in 2019. The study has
relevance for the design of appropriate tax policy, and will add to the body of knowledge in related
literature.

2     Literature review

Internationally, excise duties are typically used to raise revenue from consumption patterns that
are socially costly, such as drinking alcohol or smoking tobacco (‘sin taxes’), as well as pollution-
related activities (‘green taxes’) (Junquera-Varela et al. 2017). Levell et al. state:

                                                  1
The main economic justification for the use of excise taxes is to correct socially
costly behaviour that is not taken into account by individuals when deciding what
and how much to consume. These costs may be borne by others or society at large,
or by the consumer in the future. (Levell et al. 2016: 230)
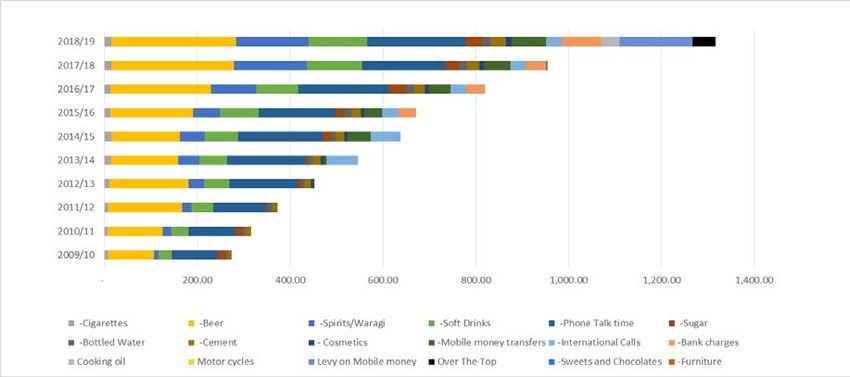
Low-income countries such as Uganda have particularly low excise duty-to-GDP ratios compared
with countries in other income groups (Figure 1).
Figure 1: Excises as percentage of GDP by country income group, 2000 to 2012
Source: Junquera-Varela et al. (2017: 87). Licensed under CC BY 3.0 IGO.
Figure 1 also demonstrates the shift to imposing excise duties to raise more revenue, which has
increased the excise tax-to-GDP ratio over time in low-income countries. This shift is in line with
the recommendations of the International Monetary Fund (IMF), which has highlighted the
potential of excise duty for raising additional revenue, particularly in sub-Saharan Africa (IMF
2011). Beegle et al. (2018) also highlight the potential for indirect taxes to be used to raise additional
revenue in African countries in order to finance progressive spending, particularly if the taxes are
tailored towards goods that are consumed by non-poor people.
The contribution of excise duties to Uganda’s tax revenue comprised nine per cent of tax revenue
in 2018–19 (URA 2019b). For countries within the OECD, the role of excise duties has shrunk,
from 10.5 per cent of tax revenue on average in the mid-1970s to 7.8 per cent on average by 2016
(OECD 2018). Nevertheless, the contribution of excise duties to tax revenue in Uganda is only
one percentage point higher than the OECD average, and Estonia, Greece, Latvia, Lithuania,
Mexico, Poland, Slovenia, and Turkey each derive more than ten per cent of their tax revenue
from excise duties (OECD 2018). Thus the contribution of excise duties to overall tax revenue in
Uganda is not exceptional internationally.
The level at which the excise duty is charged is informed by decisions about the relative priorities
of generating revenue and minimizing negative externalities, which can work in opposition to one
another: introducing a higher excise duty might increase revenue on the one hand, and yet on the
other hand might curb expenditure on the item, which in turn would reduce revenue (Levell et al.
2016). The World Bank argues that ‘the combined indirect tax rate from VAT and excises should
2not be above the maximum revenue-yielding rate unless the only objective is to reduce
consumption’ (Junquera-Varela et al. 2017: 30).
Excise duty on cigarettes provides a case in point, as this can be an important revenue stream and
yet relates to a practice that is damaging to health, with global public health initiatives to reduce
the practice. Ntale and Kasirye (2018) examine excise duty on cigarettes in Uganda and stress the
importance of pegging the tax to inflation, simplifying the rules, and incorporating ‘other’ tobacco
products in order to maximize revenue. Moore and Prichard (2017) highlight the potential to
increase revenue by raising excise duties on cigarettes in low-income countries, especially in Africa,
where consumer spending is rising quickly, and in the context of evidence from elsewhere which
suggests that consumption would only be curbed over the long term.
Regarding the implementation of excise duties, these differ from VAT in that excise duties are
normally collected once at the point at which a good is released for consumption; VAT is then
usually charged on top (OECD 2018). The excise duty is calculated either ad quantum (when a fixed
amount is levied per unit of the product) or ad valorem (when the tax is calculated as a percentage
of the selling price) (OECD 2018), or sometimes—as will be seen in the next section for certain
taxes in Uganda—some combination is used.
Although it is generally accepted that excise duties are likely to be regressive because they are
usually flat-rated, there are instances when they could be progressive. For example, when excise
duties are levied on luxury goods that are only purchasable by the very wealthy, the duties could
be progressive (ActionAid 2018; Junquera-Varela et al. 2017). Levell et al. (2016) emphasize that
even if excise duties are regressive, their corrective role may be the priority, and more than
counterbalanced by the tax and benefit system as a whole; they suggest that ‘understanding the
distributional impact of excise taxes can be important in determining how to adjust other aspects
of the tax and benefit system to offset excise tax reforms that on their own would be regressive’
(Levell et al. 2016: 207). It is therefore important to explore the distributional impact of excise
taxes, and to determine how low-income households are affected.
Within the literature, only a few studies analyse the redistributive impact of indirect taxes in the
Ugandan context. Jellema et al. (2016) adopted the commitment to equity (CEQ) approach and
analysed the redistributive impact of Uganda’s tax and social spending programmes, using 2012–
13 Uganda National Household Survey (UNHS) data. The CEQ approach simultaneously analyses
the incidence of government revenue and spending. With respect to excise duties, they found that
they had an equalizing effect (meaning that they reduced inequality).
Using GAUSS software, Ssewanyana and Okidi (2008) built a model of Uganda’s tax system called
UGATAX, which was underpinned by the 1999–2000 UNHS. They undertook analysis using
assumptions of constant consumption and constant expenditure. They analysed the tax incidence
of indirect taxes (VAT and excise duty) while assuming constant consumption behaviour and
expenditure between the time periods. They also assumed total tax compliance of all households
consuming vatable and excisable commodities. The analysis used per capita adult equivalent
household consumption to analyse the tax incidence. The study noted that poor households bore
a greater burden of indirect taxes, especially VAT, followed by excise duties and graduated tax. 1
Increasingly, tax-benefit microsimulation models are used to analyse the redistributive impact of
indirect taxes because of the availability of detailed expenditure data in household surveys that can
1 Graduated tax was a direct tax which replaced the hut tax introduced in Uganda during the colonial era. It was
abolished in 2005.
3be used to underpin such models. Popular among the microsimulation models is the EUROMOD
framework, which is a tax-benefit microsimulation model for countries in the European Union.
As an example, Decoster et al. (2011) used the EUROMOD framework to analyse the
redistributive impact of a tax shift from labour to consumption. They considered a 25 per cent
decrease in social security contributions with an increase in the VAT rate. They used a
consumption-based approach to analyse the distributional impact of the reform on welfare and
government budget. Their analysis considered subgroups such as expenditure deciles, poor and
non-poor groups, and employment status.
Over time, the EUROMOD software has been applied in several countries in the Global South,
including Uganda, under the auspices of the SOUTHMOD programme (Decoster et al. 2019).
These static microsimulation models use household survey data on income and expenditure to
ascertain the impact of tax policy and benefit schemes on poverty, inequality, and government
revenue. Thus far, the distributional effect of indirect taxes has been explored only in the context
of South Africa with respect to VAT using the South African model SAMOD, which also uses the
EUROMOD microsimulation software (Gcabo et al. 2019), and in a comparative paper on six
African countries (Gasior et al. 2018).
3 Excise duty in Uganda
Uganda’s tax regime, as per international norms and standards, is comprised of various tax
instruments, which include both direct and indirect taxes. Indirect taxes are levied on goods and
services, thus taxing consumption. Indirect domestic taxes in Uganda are VAT and excise duty
(charged on some selected locally produced and imported goods and services).
As was highlighted in the previous section, excise duties are typically applied to a specific category
of products, out of a desire to address externalities that are usually negative to society, and also to
influence human behaviour, such as by taxing alcohol and cigarettes (MoFPED 2019). Thus, excise
duties are deemed to be ‘repair costs’ for the incidental damage the products cause to health, the
environment, or public finances. Excises by and large also encourage an ‘ability-to-pay’ approach,
for example by taxing luxury items that are disproportionately consumed by higher-income
individuals, such as perfumes and some expensive alcohols. In the most recent past, however,
Uganda has shifted its policy approach to broaden the underlying motives of the excise regime,
and has thus tended to use excise duties as a revenue-raising tool. This has been observed with the
introduction of taxes on mobile payments, airtime, social media, sugar, cement, and cooking oil.
These are applied partly due to the relative ease of administration as they are seen as ‘low-hanging
fruit’, targeting products with few producers in well-developed markets.
Uganda has undergone a number of tax reforms over the past decade geared towards broadening
the tax base, increasing the efficiency of collection, creating incentives for the private sector to
pay, and ensuring equity (MoFPED 2019; SEATINI 2019). The reforms have usually been directed
towards rationalizing the tax structure and rates, widening the tax base, reducing exemptions, and
simplifying procedures. These reforms to excise duty—such as the harmonization of excise duties
applied to telecommunication services, and the introduction of new product and service lines upon
which excise duty is charged, together with compliance initiatives—have resulted in modest
growth in excise revenue to GDP, reflected by a rising tax-to-GDP ratio (Figure 2).
4Figure 2: Excise duty revenue as percentage of GDP
Excise Duties
1.40%
EXCISE DUTY/GDP
1.20% 1.19%
1.00% 0.98% 0.96%
0.85% 0.92% 0.92%
0.80% 0.82%
0.66% 0.73%
0.60% 0.64%
0.40%
0.20%
0.00%
2009/10 2010/11 2011/12 2012/13 2013/14 2014/15 2015/16 2016/17 2017/18 2018/19
FINANCIAL YEAR
Source: authors’ calculations based on data from URA reports and Uganda Bureau of Statistics.
Partly as a result of reforms in the excise duty regime, revenue has increased astronomically,
especially from local excise duty (see Figure 3), by about 380 per cent over the past decade. The
increase in revenue, especially domestically, can be largely attributed to the increase in excisable
items, from eight in the financial year 2009 to 2010, to 18 in 2018 to 2019 (Figure 4).
Most notably, the recent growth in excise revenue has also coincided with the growth in the
contribution from excise duties to overall domestic taxes revenue. As a proportion of total
consumption taxes and total taxes, excise duties increased from 20.1 per cent and 8.3 per cent
respectively in the financial year 2013 to 2014, to 22.7 per cent and 9.0 per cent in 2018 to 2019.
This is at least in part due to the introduction of new excisable items in 2018 to 2019, including
the mobile payment levy, the ‘over-the-top’ (OTT) social media tax, and a duty of UGX 200 per
litre of cooking oil. Collections from the financial year 2018 to 2019 indicate that the mobile
payment levy and cooking oil duty performed beyond expectations and surpassed their respective
targets. In contrast, collections from the OTT tax were less than 20 per cent of the target, largely
attributable to poor policy design, which facilitated high avoidance (by using virtual private
networks, for example), and to administrative difficulties, as remittance depends on a consumer’s
choice to pay.
A comparison of excise duty with other tax heads over time shows an upward trend of revenue
from excise duty, which has surpassed the proportion of revenue from corporate tax (Figure 5).
Therefore, excise duty has emerged as an important revenue source, with a proportionality ranking
third in Uganda’s tax structure.
Excise tax in Uganda is imposed on specified imported or locally manufactured goods and services.
The applicable rates may be specific (ad quantum) or ad valorem. The tax is imposed on the value of
the import; in the case of locally manufactured goods, the duty (local excise duty) is payable on the
ex-factory price of the manufactured good (URA 2015). This tax is administered under the Excise
Act of 2014, while the changes in the rates of duty are listed in the Second Schedule of the Excise
Duty Act (Amended) of 2014 (URA 2019a). For imported items, excise duty in Uganda is
administered under the East African Excise Management Act of 2012.
5Persons supplying excisable goods and services are required to register and file monthly returns to
the tax authority by the 15th day of the month following the month in which delivery of the goods
was made. Failure to comply with the requirement leads to penalties (URA 2019a). The current
rates and a list of items liable for excise duty, as laid out in part one of the Second Schedule of the
Excise Duty Act of 2014, are provided in Table A1 in the Appendix.
Figure 3: Excise revenue, 2009–10 to 2018–19
Local Excise duty -Excise duty (imports)
1,400.00
EXCISE REVENUE (UGX BNS)
1,200.00
1,000.00
800.00
600.00
400.00
200.00
-
2009/10 2010/11 2011/12 2012/13 2013/14 2014/15 2015/16 2016/17 2017/18 2018/19
FINANCIAL YEARS
Source: authors’ calculations based on data from URA reports.
Figure 4: Local excise duty collection by product, 2009–10 to 2018–19
Source: authors’ calculations based on data from URA reports.
6Figure 5: Comparison of tax revenue sources over time
35.00%
30.00%
25.00%
20.00%
15.00%
10.00%
5.00%
0.00%
2009/10 2010/11 2011/12 2012/13 2013/14 2014/15 2015/16 2016/17 2017/18 2018/19
PAYE Corporation Tax Withholding Tax
Local Excise duty Value Added Tax Other Domestic Taxes
Source: authors’ calculations based on data from URA reports.
4 Methodology
A tax-benefit microsimulation model for Uganda called UGAMOD version 1.4 (Waiswa et al.
2020) is used to analyse the distributional impact of excise duty in Uganda for the year 2019.
UGAMOD is a static microsimulation model that was built using EUROMOD software version
3.1.8 (University of Essex 2019). The model does not account for behavioural changes in
tax/benefit reforms, and by default it assumes full compliance of taxpayers and beneficiaries. The
model is underpinned by the UNHS data for 2016 to 2017, which contains 15,721 households and
74,422 individuals (Uganda Bureau of Statistics 2017). The UNHS data is nationally representative
and collected by Uganda’s National Bureau of Statistics, a statutory government institution with
the mandate to collect national statistics. In the survey, respondents were asked to report their
expenditure on various commodities such as foods, beverages, tobacco, water, furniture, etc.
UGAMOD simulates excise tax for 15 different items. 2 Excise duty is calculated on either an ad
valorem or an ad quantum basis, or as a combination of the two. During the preparation of the
underpinning data set, expenditure items which are subject to excise are stripped of excise taxes.
As VAT is charged in addition to excise in Uganda, this is also stripped off during the data
preparation stage. This enables the expenditure items to be brought into the model net of excise
and VAT. Within the model, the expenditure items are then uprated using five subcategories of
the consumer price index: food, non-food, 3 fuel, alcohol, and tobacco.
The version of UGAMOD used to analyse the distributional impact of excise taxes has been
modified in order to consider constant budget shares (instead of assuming constant consumption).
2 The items are sugar, mineral water, soft drinks, fruit juices, other juices, domestic beer, gin (waragi), cigarettes, vehicle
fuel (petrol and diesel), engine gear and different oil/petroleum jelly, kerosene/paraffin, mobile phone airtime, mobile
payments, and furniture.
3Non-food items refer to items that are non-durable but frequently consumed, such as house rent, utility bills, medical
expenses, and laundry.
7The assumption behind constant budget shares is that a household spends the same share of its
budget on items that are subject to indirect taxes, regardless of any increases or decreases in its
overall budget (De Agostini et al. 2017). In the case of a reform that alters the budget available to
the household, the absolute expenditure on a good is scaled proportionally to the change in the
budget.
It should be noted that the simulated amounts of excise duty differ from reported excise duty
revenue as captured by the URA. This can occur for a number of reasons, including that excise
duty revenue will be obtained from additional sources such as companies (and such expenditure
would not be captured in a household survey), or that overall expenditure is over- or under-
captured. It is also the case that UGAMOD does not simulate all excise duties. Nevertheless, it is
assumed that there is no need to scale up (or down) the simulated excise duty prior to examining
its distributional impact. For the financial year 2016 to 2017, UGAMOD simulated UGX 859.982
billion in revenue from excise duty. This is slightly more than the UGX 819.785 billion actual
revenue collected, and less than the target of UGX 866.847 billion (Waiswa et al. 2020).
5 Results
5.1 Consumption
In this section, the distributional effects of excise duty in Uganda are examined using population-
weighted consumption deciles in 2019.
Figure 6: Mean monthly per capita household consumption and mean monthly per capita household consumption
after excise, 2019
250000200000
Thousands of UGX
100000 150000
50,000
0
1 2 3 4 5 6 7 8 9 10
Mean Consumption Mean consumption after excise
Deciles
Source: authors’ calculations using UGAMOD 1.4 and UNHS 2016–17 data set.
8Figure 6 depicts the mean monthly per capita household consumption and the mean monthly per
capita household consumption after excise taxes in thousands of UGX in 2019. The green bar
represents mean consumption, and the red bar represents mean consumption after the deduction
of excise taxes. The first seven deciles have a similar mean monthly per capita household
consumption before and after excise taxes are deducted. In decile one (the poorest), the mean
monthly per capita household consumption is UGX 20,467, which decreases marginally to UGX
20,334 after the deduction of excise taxes. From decile seven, there begins to be a slight reduction
in the mean monthly per capita household consumption after excise taxes are deducted, indicating
that households in the upper deciles are paying more excise taxes relative to those in the bottom.
This subsequently reduces their per capita household consumption. There is a sharp increase in
mean monthly per capita household consumption between deciles nine and ten. Households in
decile ten (the richest) have a mean monthly per capita household consumption of approximately
UGX 276,563. Their mean monthly per capita consumption decreases to UGX 238,598 after
excise taxes are paid.
Figure 7: Excise duty as percentage of total excise duty, and consumption as percentage of total consumption, by
consumption decile, 2019
50
40
30
%
20
10
0
1 2 3 4 5 6 7 8 9 10
Percentage of total consumption Percentage of total excise
Deciles
Source: authors’ calculations using UGAMOD 1.4 and UNHS 2016–17 data set.
Figure 7 depicts the excise and consumption for each decile as a percentage of total excise and
total consumption respectively. The green bar represents the percentage of total consumption, and
the red bar represents the percentage of total excise. In decile one (the poorest), per capita
consumption accounts for 3.2 per cent of total consumption, and per capita excise accounts for
1.4 per cent of total excise. In each of the first six deciles, per capita excise accounts for less than
five per cent of total excise, while per capita consumption accounts for less than ten per cent of
total consumption. In deciles nine and ten, the share of total excise exceeds the share of total
consumption; in the final decile, consumption accounts for approximately 29 per cent of total
consumption, and excise accounts for 52 per cent of total excise. This indicates that the majority
of excise tax is being paid by households in the top deciles, particularly decile ten.
9Figure 8 depicts excise duty expenditure per decile as a percentage of consumption per decile. In
decile one (the poorest), households’ expenditure on excise duties makes up approximately 0.5 per
cent of their consumption. Expenditure on excise duty increases from the fifth to the tenth decile.
In decile ten (the richest), households’ expenditure on excise duties makes up approximately two
per cent of their total consumption. Households in lower deciles spend a smaller percentage of
their consumption on excise duty compared with households in the upper deciles, and therefore
excise duty has a degree of progressivity.
Figure 8: Excise duty expenditure per decile as percentage of consumption, 2019
Source: authors’ calculations using UGAMOD 1.4 and UNHS 2016–17 data set.
Figure 9 shows the share of excise duty for excisable items within each consumption decile (see
also Table A2 in the Appendix). A considerably large share of the excise duty paid by households
in the lower (poorer) deciles is for local gin. In decile one, 89 per cent of excise duty is paid on
local gin. By contrast, only two per cent of the excise duty expenditure in the tenth decile (the
richest) is paid on local gin. Vehicle fuel contributes the largest share of excise duty for households
in the upper deciles, with 69 per cent of the share in decile ten (the richest). By contrast, vehicle
fuel only makes up a small share of excise in the lower deciles, with an approximately two per cent
share of vehicle fuel in decile one. Domestic beer comprises a share of between 14 and 24 per cent
for households in deciles five to nine, but has a much lower share in the other deciles. Mobile
phone airtime accounts for a small share of excise duty for households in the lowest and highest
deciles.
10Figure 9: Share of total excise duty items within each consumption decile, 2019
100
80 60
percent
40 20
0
1 2 3 4 5 6 7 8 9 10
excise on sugar excise on mineral water
excise on soda excise on fruit juice
excise on other juices excise on domestic beers
excise on foreign beers excise on gin
excise on cigarettes excise on vehicle fuel
excise on engine oil excise on kerosene/paraffin
excise on cellphone/airtime excise on mobile money
excise on furniture
Deciles
Source: authors’ calculations using UGAMOD 1.4 and UNHS 2016–17 data set.
Figure 10: Share of grouped excise duty items within each consumption decile, 2019
100
80
60
percent
40
20
0
1 2 3 4 5 6 7 8 9 10
Sin Tax Items Fuel Items
Other excise items
Deciles
Source: authors’ calculations using UGAMOD 1.4 and UNHS 2016–17 data set.
11The share of excise items by consumption deciles is illustrated further by grouping excise items
into three categories: sin tax items, fuel items, and all other excisable items (Figure 10). Sin tax
items consist of excise on all alcoholic beverages and cigarettes, and make up the largest share of
excise duty in the lower deciles. In the poorest households (decile one), sin tax items make up the
largest share of excise duty at 88 per cent of the total excise duty paid in that decile. The share of
excise on sin tax items starts to decline across the deciles, with the lowest share of 14 per cent
being in the richest households (decile ten). Fuel items consist of excise on vehicle fuel (both petrol
and diesel) and kerosene. Excise on fuel items forms the largest share of excise duty in the richest
decile (decile ten). The share of fuel items is just under two per cent of excise duty paid in decile
one, compared with 69 per cent in decile ten. The total combined share of all other excisable items
consists of excise on sugar, mineral water, soft drinks, fruit juices, other juices, mobile phone
airtime, mobile payments, and furniture. The largest contributor to the combined share of the
other excisable items is excise duty paid on mobile phone airtime (see Table A3 in the Appendix).
Although this only makes up a small share of duty paid in the poorer and richest deciles, mobile
phone excise duty contributes just over ten per cent of total excise in deciles five, six, and seven.
The ‘other’ category comprises remaining excisable commodities such as soft drinks, sugar, and
furniture.
5.2 Poverty and inequality
Having examined the incidence of excise duties across deciles of consumption, it is instructive to
examine the impact of excise duties on poverty and inequality.
5.2.1 Poverty
In Table 1, a reform scenario has been modelled in which no excise duties are payable on goods
currently subject to excise duties, and the impact on consumption-based poverty net of indirect
taxes is presented (post-fiscal consumption-based poverty). From the table it is clear that in the
absence of excise duties, post-fiscal consumption-based poverty reduces by around one percentage
point. Male-headed households experience the greatest reduction, whereas households with older
persons experience the least reduction. There are also small decreases in the average normalized
poverty gap. The difference between male-headed households and households with older persons
indicates that households with older persons spend less on excise duty items than male-headed
households.
Table 1: Consumption-based poverty net of indirect taxes
2019 2019 with no excise Difference from base
duties payable
Share of poor population, in %
All 22.13 21.05 -1.08
Poor households out of...
... male-headed households 22.20 21.02 -1.18
... female-headed households 21.93 21.11 -0.82
... households with children 23.25 22.14 -1.12
… households with older persons 23.07 22.42 -0.65
Source: authors’ calculations using UGAMOD 1.4 and UNHS 2016–17 data set.
125.2.2 Impact of grouped excise items on poverty
In this section, the impact of grouped excise items on consumption-based poverty net of indirect
taxes (post-fiscal consumption-based poverty) is explored. From Table 2, it is evident that sin tax
items increase consumption-based poverty by the greatest magnitude (0.91 percentage points)
compared with scenarios where excise is only payable on fuel items, or on all other remaining
excise items. The scenario in which excise is only payable on fuel items demonstrates that poverty
would increase by 0.61 percentage points, whereas the scenario where excise is payable on all other
excisable items combined would lead to the smallest increase in poverty of 0.60 percentage points.
It is worth noting again that male-headed households experience the greatest increase in poverty,
whereas households with older persons experience the least. The differences between the different
types of household indicate that male-headed households spend more on grouped categories of
excise duty items than households with older persons, which have the smallest increase in poverty
in all reform scenarios. Households with children experience the greatest increase in poverty after
male-headed households.
Table 2: Impact of grouped excise items on poverty
Poverty 2019 with no 2019 with excise 2019 with excise 2019 with excise
excise duties duties payable payable only on payable only on
payable only on sin tax fuel items all other items
items
Share of poor population, in %
All 21.05 21.96 21.66 21.65
Poor households out of...
... male-headed households 21.02 21.99 21.66 21.63
... female-headed households 21.11 21.90 21.68 21.73
... households with children 22.14 23.08 22.78 22.76
... households with older persons 22.42 23.00 22.64 22.73
Source: authors’ calculations using UGAMOD 1.4 and UNHS 2016–17 data set.
5.2.3 Inequality
As regards inequality, the situation is reversed (Table 3). In the absence of excise duty, there is a
small increase in inequality measured using both the Gini coefficient and the P80/P20 ratio. This
indicates that those at the top of the income distribution experience a greater increase in their post-
fiscal income—in the absence of excise duty—than those at the bottom of the income distribution.
Table 3: Inequality after taxes and transfers
Income 2019 2019 with no excise Difference from base
duties payable
Gini (household income) 0.3902 0.3948 0.0046
P80/P20 2.95 2.99 0.04
Source: authors’ calculations using UGAMOD 1.4 and UNHS 2016–17 data set.
135.2.4 Impact of grouped excise items on inequality
Consistently, inequality is reduced by the introduction of each group of excise items, as compared
with a situation with no excise duties payable. The biggest reduction is attributed to the scenario
where excise is only payable on fuel items. In this reform scenario, there is a reduction of 0.0039
in the Gini coefficient. There are also reductions in the P80/P20 ratios in all three reform
scenarios. The reductions in the P80/P20 ratios are a result of the greater reductions experienced
in the post-fiscal incomes of those at the top end of the income distribution compared with those
at the bottom of the income distribution.
Table 4: Impact of grouped excise items on inequality
Income inequality 2019 with no excise 2019 with excise 2019 with excise 2019 with excise
duties payable duties payable only payable only on fuel payable only on all
on sin tax items items other excise items
Gini (household 0.3948 0.3935 0.3910 0.3927
income)
P80/P20 2.99 2.97 2.96 2.97
Source: authors’ calculations using UGAMOD 1.4 and UNHS 2016–17 data set.
5.3 Impact of a reform in the excise duty on airtime
In this section, the impact of a reform in the excise duty on airtime from the current tax of 12 per
cent to 15 per cent is examined, with no change in other taxes and benefits. Comparing the base
and the reform scenario, we find that an increase in the rate will lead to an increase in revenue
from indirect taxes of UGX 8,371 million. The increase in the excise duty rate does not impact on
overall poverty; however, there is a slight increase in poverty in female-headed households, as
shown in Table 5.
Table 5: Impact of a reform in excise duty on airtime on poverty
Poverty 2019 2019 reform airtime Difference from
base
Share of poor population, in %
All 22.13 22.13 0.00
Poor households out of...
... male-headed households 22.20 22.20 0.00
... female-headed households 21.93 21.94 0.01
... households with children 23.25 23.26 0.00
... households with older persons 23.07 23.07 0.00
Source: authors’ calculations using UGAMOD 1.4 and UNHS 2016–17 data set.
14The increase in the excise duty rate leads to a small decrease in inequality, as presented in Table 6.
This is a result of the decrease in the post-fiscal incomes of those at the bottom of the income
distribution and the fact that incomes at the top of the income distribution have remain unchanged.
Table 6: Impact of a reform in excise duty on airtime on inequality
Consumption inequality 2019 2019 reform airtime Difference from base
Gini (household consumption) 0.3902 0.3901 0.0000
P80/P20 2.95 2.95 0.00
Quantiles of distribution and median
20th 485,234.46 485,146.50 -87.96
40th 688,495.75 688,006.95 -488.80
50th 809,448.27 809,374.37 -73.91
60th 952,490.54 952,490.54 0.00
80th 1,430,124.31 1,430,124.31 0.00
Source: authors’ calculations using UGAMOD 1.4 and UNHS 2016–17 data set.
Figure 11: Excise duty on mobile phone airtime as percentage of total excise duty expenditure within each decile,
before and after the reform, 2019
Source: authors’ calculations using UGAMOD 1.4 and UNHS 2016–17 data set.
15Figure 11 depicts the percentage share of excise duty on mobile phone airtime as a percentage of
total excise duty expenditure in each decile, before and after the reform in 2019. The blue bars
represent the base scenario, and the red bars represent the reform scenario. The increase in excise
duty on mobile phone airtime results in the increase in the share of total excise paid on mobile
phone airtime across the deciles. In the first decile, this share increases from 3.54 per cent to 4.83
per cent. Although the increase in the excise duty rate on mobile phone airtime has effectively
increased the price of airtime, households continue to spend the same share of their budget on
airtime.
Households in deciles five, six, and seven have the largest share of excise on mobile phone airtime,
and this share increases by a greater margin after the increase in the excise duty rate.
6 Conclusion and recommendations
This paper has analysed the distributional impact of excise duty in 2019 in Uganda, using the
UGAMOD microsimulation model version 1.4. Overall, excise duty in Uganda has a degree of
progressivity, as households in the top deciles pay more excise duty as a percentage of their
consumption than households in the bottom deciles. Post-fiscal consumption is almost the same
as pre-fiscal consumption for the lower deciles (first to seventh), and we have only noted a sharp
reduction in post-fiscal consumption in the tenth decile. The items were put into three groups: i)
sin taxes, which include taxes on alcoholic beverages and cigarettes; ii) excise on fuel items such
as petrol, diesel, and kerosene; and iii) other excisable items, including all remaining items such as
sugar, mineral water, soft drinks, fruit juices, mobile phone airtime, mobile payments, and
furniture. Sin taxes made up 88 per cent of excise duty expenditure for the poorest households
and only 14 per cent for the richest households. On the other hand, two per cent of the excise
duty paid by the poorest households was spent on fuel, while the richest households paid 69 per
cent of their excise duties on fuel. Among the other items, the excise on mobile phone airtime was
the largest contributor, paid mainly by households in the middle deciles (five, six, and seven) with
an average of ten per cent.
Scenarios were introduced to further analyse the impact of the various excise duties on poverty
and inequality. A comparison of a baseline with all excise duties paid and a reform of no excise
duty payable showed a reduction in poverty of 1.08 percentage points. It was found that sin taxes
increased poverty by 0.91 percentage points, while excise duty on fuel increased poverty by 0.61
percentage points, and excise duty on other items by 0.60 percentage points, when compared with
a baseline of no excise duty payable. Overall, the impact of excise duties on poverty was minimal,
and although it was greater for sin taxes, we do not advocate their reduction, because they are
meant to correct behaviour by restricting the consumption of alcohol and cigarettes.
With regard to income inequality, a comparison between the baseline of excisable duty payable
and a reform of no excise duty payable showed that the reform increased inequality by 0.0046
percentage points, which is minimal. A further analysis of the items driving the results of the
impact of excise duty on income inequality revealed that the biggest reduction stemmed from
excise duty payable on fuel items.
A reform scenario was explored whereby the excise duty on mobile phone airtime was increased
from the current 12 per cent to 15 per cent, with no change in all other taxes and benefits. The
reform resulted in an increase in revenue of UGX 8,371 million annually. This increase did not
change overall poverty and inequality, but might be a good tax reform if the objective is to raise
more tax revenue.
16In conclusion, overall excise duties in Uganda are progressive and therefore inequality-reducing.
In a bid to raise more tax revenue, the URA can use the UGAMOD model to build scenarios and
investigate the impact of a tax reform on revenue collection, poverty reduction, and inequality.
This information can then be used to inform tax policy reforms.
References
ActionAid (2018). ‘Progressive Taxation Policy Brief: Excise Taxes’. Johannesburg: ActionAid.
Atkinson, A., and J. Stiglitz (1972). ‘The Structure of Indirect Taxation and Economic Efficiency’.
Journal of Public Economics, 1: 97–119.
Beegle, K., A. Coudouel, and E. Monsalve (eds) (2018). Realizing the Full Potential of Social Safety Nets
in Africa. Washington, DC: World Bank.
Bourguignon, F., and A. Spadaro (2006). ‘Microsimulation as a Tool for Evaluating Redistribution
Policies’. Working Paper 2006-30. Rome: Society for the Study of Economic Inequality.
De Agostini, P., B. Capéau, A. Decoster, F. Figari, J. Kneeshaw, C. Leventi, K. Manios, A. Paulus,
H. Sutherland, and T. Vanheukelom (2017). ‘EUROMOD Extension to Indirect Taxation:
Final Report’. Technical Note EMTN 3.0. Colchester: University of Essex, Institute for Social
and Economic Research.
Decoster, A., J. Loughrey, C. O’Donoghue, and D. Verwerft (2011). ‘Microsimulation of Indirect
Taxes’. International Journal of Microsimulation, 4(2): 41–56.
Decoster, A., J. Pirttilä, S. Sutherland, and G. Wright (2019). ‘SOUTHMOD: Modelling Tax-
Benefit Systems in Developing Countries’. International Journal of Microsimulation, 12(1): 1–12.
Gasior, K., C. Leventi, M. Noble, G. Wright, and H. Barnes (2018). ‘The Distributional Impact of
Tax and Benefit Systems in Six African Countries’. Working Paper 2018/155. Helsinki: UNU-
WIDER.
Gcabo, R., B. Moche, W. Steyn, B. Moahlodi, J. Pirttila, M. Noble, G. Wright, H. Barnes, and F.
Masekesa (2019). ‘Modelling Value-Added Tax (VAT) in South Africa: Assessing the
Distributional Impact of the Recent Increase in the VAT Rate and Options for Redress
Through the Benefits System’. Working Paper 2019/13. Helsinki: UNU-WIDER.
IMF (2011). ‘Revenue Mobilization in Developing Countries’. Washington, DC: IMF, Fiscal
Affairs Department.
Immervoll, H., H.J. Kleven, C.T. Kreiner, and E. Saez (2007). ‘Welfare Reform in European
Countries: A Microsimulation Analysis’. Economic Journal, 117: 1–44.
Jara, X. and A. Tumino (2013). ‘Tax-Benefit Systems, Income Distribution and Work Incentives
in the European Union’. International Journal of Microsimulation, 6(1): 27–62.
Jellema, J., N. Lustig, A. Haas, and S. Wolf (2016). ‘The Impact of Taxes, Transfers and Subsidies
on Inequality and Poverty in Uganda’. Working Paper 443. Washington, DC: Center for
Global Development.
Junquera-Varela, R.F., M. Verhoeven, G.P. Shukla, B. Haven, R. Awasthi, and B. Moreno-Dodson
(2017). ‘Strengthening Domestic Resource Mobilization: Moving from Theory to Practice in
Low- and Middle-Income Countries’. Directions in Development. Washington, DC: World
Bank. https://doi.org/10.1596/978-1-4648-1073-2.
17Leahy, E., S. Lyons, and R.S.J. Tol (2011). ‘The Distributional Effects of Value Added Tax in
Ireland’. Economic and Social Review, 42(2): 213–35.
Levell, P., M. O’Connell, and K. Smith (2016). ‘Excise Duties’. In C. Emmerson, P. Johnson, and
R. Joyce (eds), The IFS Green Budget: February 2016. London: Institute for Fiscal Studies.
Maskaeva, A., Z. Bochkaeva, J. Mmasa, M. Msafiri, and E. Iramba (2019). ‘Microsimulation
Analysis of the Impact of Indirect Tax-Benefit on Income Distribution and Poverty
Alleviation in Tanzania’. Working Paper 2019/16. Helsinki: UNU-WIDER.
MoFPED (2019). ‘Domestic Revenue Mobilisation Strategy 2019/20–2023/24’. Kampala:
Government of Uganda.
Moore, M., and W. Prichard (2017). ‘How Can Governments of Low-Income Countries Collect
More Tax Revenue?’ Working Paper 70. Brighton: Institute of Development Studies,
International Centre for Tax and Development.
Ntale, A., and I. Kasirye (2018). ‘Using Taxation to Control Tobacco Consumption in Uganda’.
Policy Brief 100. Kampala: Economic Policy Research Centre.
OECD (2018). Consumption Tax Trends 2018: VAT/GST and Excise Rates, Trends and Policy Issues.
Paris: OECD. Available at: read.oecd-ilibrary.org/taxation/consumption-tax-trends-
2018_ctt-2018-en (accessed 18 February 2020).
OECD (2019). ‘Revenue Statistics in Africa in 2019’. Paris: OECD. Available at:
www.oecd.org/tax/tax-policy/brochure-revenue-statistics-africa.pdf (accessed 11 March
2020).
SEATINI (2019). ‘Fair Tax Monitor’. Kampala: Tax Justice Network Africa.
Ssewanyana, S.N., and J.A. Okidi (2008). ‘A Microsimulation of the Uganda Tax System
(UGATAX) and the Poor from 1999 to 2003’. Research Series 55. Kampala: Economic Policy
Research Centre.
Uganda Bureau of Statistics (2017). Uganda National Household Survey (UNHS) 2016/2017.
Kampala: Uganda Bureau of Statistics.
University of Essex (2019). ‘EUROMOD Software v3.1.8’. Colchester: University of Essex.
URA (2015). Taxation Handbook: A Guide to Taxation in Uganda, Second Edition. Kampala: URA.
URA (2019a). ‘Excise Duty Act, 2014 (Amended)’. Kampala: URA.
URA (2019b). Revenue Performance Report 2019. Kampala: URA.
Waiswa, R., J.O. Ayo, M. Noble, C. Byaruhanga, S. Kavuma, and G. Wright (2020). ‘SOUTHMOD
Country Report Uganda - UGAMOD v1.4, 2016–2019’. SOUTHMOD Country Report.
Helsinki: UNU-WIDER.
Warren, N. (2008). ‘A Review of Studies on the Distributional Impact of Consumption Taxes in
OECD Countries’. Social, Employment, and Migration Working Paper 64. Paris: OECD.
18Appendix
Table A1: Excise duty in respect of excisable goods and services
Excisable good or service Duty rate
2017–18 2018–19
1. Cigarettes
a) Soft cup (other soft cup) - -
Locally manufactured UGX 55,000 per 1,000 UGX 55,000 per 1,000
sticks sticks
Imported UGX 75,000 per 1,000 UGX 75,000 per 1,000
sticks sticks
b) Hinge lid - -
Locally manufactured UGX 80,000 per 1,000 UGX 80,000 per 1,000
sticks sticks
Imported UGX 100,000 per 1,000 UGX 100,000 per 1,000
sticks sticks
c) Cigars, cheroots, and cigarillos containing 200% 200%
tobacco
d) Smoking tobacco, whether or not containing 200% 200%
tobacco substitutes in any proportion
e) Homogenized or reconstituted tobacco 200% 200%
f) Other 200% 200%
2. Beer
a) Malt beer 60% or UGX 1,860 per 60% or UGX 1,860 per
litre, whichever is higher litre, whichever is higher
b) Beer whose local raw material content, excluding 30% or UGX 650 per 30% or UGX 650 per
water, is at least 75% by weight of its constituent litre, whichever is higher litre, whichever is higher
c) Beer produced from barley grown and malted in 30% or UGX 950 per 30% or UGX 950 per
Uganda litre, whichever is higher litre, whichever is higher
d) Opaque beer - 30% or UGX 650 per
litre, whichever
is higher
3. Spirits
a) Un-denatured spirits made from locally produced 60% 60% or UGX 2,000 per
raw materials litre, whichever is higher
b) Un-denatured spirits made from imported raw 100% or UGX 2,500 per 100% or UGX 2,500 per
materials litre, whichever is higher litre, whichever is higher
c) Ready-to-drink (other) spirits 80% 80% or UGX 1,500 per
litre, whichever is higher
4. Wine
a) Wine made from locally produced raw materials 20% 20% or UGX 2,000
per litre, whichever is
higher
b) Other wines 60% or UGX 6,000 per 80% or UGX 8000,
litre, whichever is higher per litre, whichever is
higher
195. Non-alcoholic
a) Non-alcoholic beverages not including fruit or 13% or 240 UGX per 12% or UGX 200 per
vegetable juices litre, whichever is higher litre, whichever is higher
b) Fruit juice and vegetable juice, except juice made 13% or UGX 300 per 13% or UGX 300 per
from at least 30% of pulp from fruit and vegetables litre, whichever is higher litre, whichever is higher
grown in Uganda
c) Powder for reconstitution to make juice or dilute- - 15% of the value
to-taste drinks, excluding pulp
6. Mineral water, bottled water, and other water 10% 10%
purposely for drinking
7. Cement UGX 500 per 50 kg UGX 500 per 50 kg
8. Fuel
a) Motor spirit (gasoline) UGX 1,100 per litre UGX 1,200 per litre
b) Gas oil (automotive, light, amber for high-speed UGX 780 per litre UGX 880 per litre
engines)
c) Other gas oils UGX 630 per litre UGX 630 per litre
d) Gas oil for thermal power generation to national Nil Nil
grid
e) Illuminating kerosene UGX 200 per litre UGX 200 per litre
f) Jet A1 and aviation fuel UGX 630 per litre UGX 630 per litre
g) Jet A1 and aviation fuel imported by registered Nil Nil
airlines, companies with designated storage
facilities or with contracts to supply airlines
9. Cane or beet sugar and chemically pure sucrose in UGX 100 per kg UGX 100 per kg
solid form
10. Cane or beet sugar for industrial use 0% 0%
Sacks and bags of polymers of ethylene and other 120% 120%
plastics under its HS codes 3923.21.00 and
11. 3923.29.00 except vacuum packaging bags for
food, juices, tea, and coffee
12. Cosmetics and perfumes, except creams used by 10% 10%
albinos in the treatment of their skin
13. Telecommunications services
a) Airtime on mobile cellular, landlines, and public 12% and 5% 12% of the fees charged
payphones
b) Over-the-top services - UGX 200 per user per
day of access
c) Internet data - Nil
d) Money transfer or withdrawal services, including 10% of the fees charged 15% of the fees charged
transfers and withdrawal services by operators
licensed or permitted to provide communications or
money transfers or withdrawals but not including
transfers and withdrawal services provided by
banks
e) Value added services 20% 20%
f) Mobile money transactions of receiving, - 0.5% of the value of the
payments, and withdrawals transaction
g) Incoming international calls, except calls from the USD 0.09 per minute USD 0.09 per minute
Republic of Kenya, the Republic of Rwanda, and
the Republic of South Sudan
14. Ledger fees, ATM fees, withdrawal fees, and 10% of the fees charged 15% of the fees charged
periodic charges, and other transaction and non-
transaction charges, excluding loan-related charges
periodically charged by financial institutions
2015. Motor vehicle lubricants 10% 10%
16. Furniture
(a) Specialized hospital furniture Nil Nil
(b) Furniture manufactured in Uganda using local Nil Nil
materials but excluding furniture which is
assembled in Uganda
(c) Other furniture 20% 20%
17. Cooking oil - UGX 200 per litre
18. Motorcycles at first registration - UGX 200,000
Source: Second Schedule of the Excise Duty Act of 2014.
Table A2: Shares of individual excise duty items within each consumption decile, 2019
Consumption deciles
1 2 3 4 5 6 7 8 9 10
Sugar 2.9 4.0 3.3 3.3 4.1 3.8 3.3 2.0 1.4 0.5
Mineral water 0.0 0.1 0.0 0.2 0.1 0.4 1.5 0.6 0.7 0.9
Soft drinks 1.0 4.6 1.9 3.3 5.9 5.2 7.1 6.8 6.4 4.6
Fruit juice 0.0 0.0 0.1 0.2 0.0 0.5 0.2 0.2 0.3 1.9
Other juices 0.1 0.6 0.6 0.4 1.1 0.6 0.8 0.9 0.8 1.2
Domestic beer 0.4 8.8 11.8 9.6 11.5 16.9 14.8 15.4 19.9 7.0
Foreign beer 0.0 0.2 3.1 3.3 3.0 0.6 1.8 1.8 1.7 4.7
Gin (waragi) 87.7 65.2 64.8 54.7 45.6 32.4 39.4 21.6 11.6 2.5
Cigarettes 0.2 0.1 0.2 0.2 0.2 0.2 0.2 0.1 0.1 0.0
Vehicle fuel 1.9 4.5 2.7 11.6 14.5 21.9 16.3 36.9 44.0 69.2
Engine oil 0.0 0.0 0.0 0.0 0.0 0.0 0.0 0.0 0.0 0.0
Kerosene 0.0 0.0 0.1 0.0 0.0 0.1 0.0 0.0 0.0 0.0
Mobile phone airtime 3.5 7.9 7.4 9.3 10.6 11.2 10.3 9.5 9.1 4.2
Mobile payments 0.0 0.0 0.0 0.0 0.0 0.1 0.0 0.0 0.0 0.1
Furniture 2.1 4.1 3.9 4.0 3.4 5.9 4.2 4.1 4.0 3.2
Total share excise items 100 100 100 100 100 100 100 100 100 100
Source: authors’ calculations using UGAMOD 1.4 and UNHS 2016–17 data set.
21Table A3: Shares of grouped excise duty items within each consumption decile, 2019
Consumption deciles
1 2 3 4 5 6 7 8 9 10
Sin tax items 88.4 74.3 79.9 67.7 60.3 50.1 56.2 39.0 33.3 14.3
Fuel items 1.9 4.5 2.8 11.6 14.5 22.1 16.3 36.9 44.0 69.2
Sugar 2.9 4.0 3.3 3.3 4.1 3.8 3.3 2.0 1.4 0.5
Mineral water 0.0 0.1 0.0 0.2 0.1 0.4 1.5 0.6 0.7 0.9
Soft drinks 1.0 4.6 1.9 3.3 5.9 5.2 7.1 6.8 6.4 4.6
Fruit juice 0.0 0.0 0.1 0.2 0.0 0.5 0.2 0.2 0.3 1.9
Other juices 0.1 0.6 0.6 0.4 1.1 0.6 0.8 0.9 0.8 1.2
Engine oil 0.0 0.0 0.0 0.0 0.0 0.0 0.0 0.0 0.0 0.0
Mobile phone airtime 3.5 7.9 7.4 9.3 10.6 11.2 10.3 9.5 9.1 4.2
Mobile payments 0.0 0.0 0.0 0.0 0.0 0.1 0.0 0.0 0.0 0.1
Furniture 2.1 4.1 3.9 4.0 3.4 5.9 4.2 4.1 4.0 3.2
Total share excise items 100 100 100 100 100 100 100 100 100 100
Notes: sin tax items include excise on domestic beer, foreign beer, local gin, and cigarettes. Fuel items include
excise on vehicle fuel (petrol and diesel) and kerosene. All other excise items are displayed individually, although
they are summed together to produce the ‘other excise items’ seen in Figure 10.
Source: authors’ calculations using UGAMOD 1.4 and UNHS 2016–17 data set.
22You can also read