An early assessment of the Flowchart Dementia in general practice - Health Sciences - THOON
←
→
Page content transcription
If your browser does not render page correctly, please read the page content below
15-8-2016   An early assessment of the
            Flowchart Dementia in
            general practice
            Health Sciences
            Master thesis

            J.M.R. Terpstra

            Examination committee
            Dr. J.G. van Manen
            S.I.M. Janus, MSc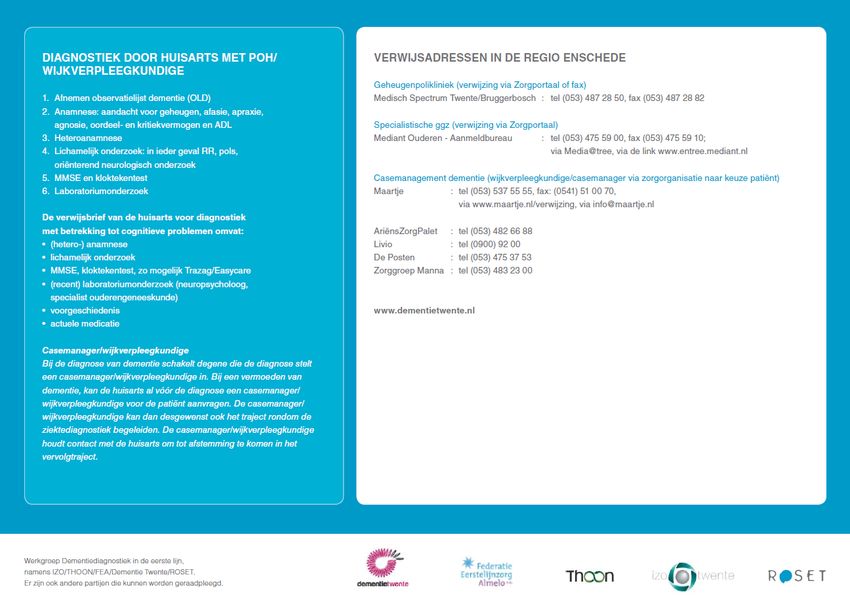
Master Thesis

Surname:                Terpstra
Given name:             Jill Marie Regine
E-mail:                 j.m.r.terpstra@student.utwente.nl

Master Program          Health Sciences
Track                   Health Technology Assessment and Innovation
Faculty                 Faculty of Science and Technology (TNW)
Department              Department of Health Technology and Services Research (HTSR)
Date                    15-08-2016

First supervisor:       Dr. J.G. van Manen
Second supervisor:      S.I.M. Janus, MSc
External supervisors:   K. Dorsman – Twentse Huisartsen Onderneming Oost Nederland
                        (THOON)
                        S.M. van Vliet – Twentse Huisartsen Onderneming Oost Nederland
                        (THOON)

                                            1
Abstract
Introduction: The population of the Netherlands is ageing rapidly. Consequently, the number of
people diagnosed with dementia is increasing. Statistics show that in January 2011 there were 51.900
people diagnosed with dementia by a general practitioner, of which 19.900 men and 32.000 women.
When diagnosed in an early stage, the effects of treatment plans and pharmacological treatments
are likely to have the maximum impact. In 2013 a collaboration started between several
organisations in the region Twente. Together their goal is to increase the expertise concerning
dementia. The expectation is that the provided care will be better for patients and their family when
health care providers have a better understanding of the disease. The flowchart dementia is a tool
used to support general practitioners and nurse specialists in diagnosing dementia. The flowchart
describes the steps a general practitioner can take and the process of referring to a specialist. After
the implementation of the flowchart in the pilot program, the facilitators and barriers of the
flowchart will be determined. The effects, as perceived by the GPs, will also be evaluated.
Methods: A combination of quantitative and qualitative data was collected to get more insights in
the perceived effects of the flowchart dementia. The questionnaire consists of open and closed
questions. The closed questions are based on the Measurement Instrument for Determinants of
Innovation (MIDI) questionnaire. The open questions were formulated to receive extra information
about the effects for the GP and the patient when using the flowchart dementia. The results of the
closed questions were used to determine the facilitators and barriers when using the flowchart
dementia. This data was analysed to see if there are important factors according to the GPs that are
of influence on the usage of the flowchart. The results of the open questions were coded and
systematically analysed to gain insights in the opinions of the GPs.
Results: A total of 22 responses were used in the analysis. According to the GPs the flowchart
dementia is easy to use and a useful addition to their usual care. However, several barriers cause the
innovation not to be used in every general practice. The overall comments made by the GPs were
positive.
Conclusion: The overall effects for both the patient and the GP are positive. The flowchart dementia
has made some promising steps toward more expertise of GPs concerning dementia in the region
Twente. There are still steps that can be taken to improve the implementation process, but the
overall the opinion of the GPs is positive. The recommendation is to further distribute this flowchart
and give training to every GP in the region Twente, to stimulate the GPs to use it. More research is
needed in a later stage to investigate the actual health effects for the patients.
Key words: Dementia, General practice, Flowchart Dementia, MIDI, Twente, Diagnosis, Theory of
Planned Behaviour (TPB).
2Table of contents
Master Thesis .......................................................................................................................................... 1
Abstract ................................................................................................................................................... 2
Introduction............................................................................................................................................. 4
Current state in Twente ...................................................................................................................... 9
Methods ................................................................................................................................................ 11
Study population ............................................................................................................................... 11
Data collection................................................................................................................................... 11
Questionnaire .................................................................................................................................... 12
Data analysis ...................................................................................................................................... 15
Results ................................................................................................................................................... 16
Time to diagnose ............................................................................................................................... 21
Time to referral ................................................................................................................................. 21
The GP’s perceived effects for the patient........................................................................................ 22
Advantages and disadvantages ......................................................................................................... 23
Other remarks ................................................................................................................................... 23
Discussion .............................................................................................................................................. 27
Conclusion ............................................................................................................................................. 32
References ............................................................................................................................................. 33
Appendices ............................................................................................................................................ 36
Appendix A: Flowchart Dementia...................................................................................................... 36
Appendix B: Questionnaire ............................................................................................................... 38
Appendix C: Coded answers to open questions in Dutch ................................................................. 45
3Introduction
The population of the Netherlands is ageing rapidly. Consequently, the number of people diagnosed
with dementia is increasing (World Health Organization, 2012). Statistics collected by the
Rijksinstituut voor Volksgezondheid en Milieu (RIVM) show that in January 2011 there were 51.900
people diagnosed with dementia by a general practitioner (GP), of which 19.900 men and 32.000
women (Poos & Meijer, 2014). All of these patients were undergoing treatment at the time.
Furthermore, in 2011 approximately 12.700 new cases of dementia were identified in the
Netherlands (Poos & Meijer, 2014). The impact of a disease like dementia is huge. In addition to the
financial impact on society, which is an estimated €4,8 billion – or 5,3% of the total health care costs
– in 2011 alone (Meijer, 2014), the effects are enormous on the patient and their direct environment
(Fox et al., 2013). The impact of dementia on health care providers, family and society can be
physical, psychological, social and economic (World Health Organization, 2015). The changes in
behaviour and psychological symptoms that are caused by dementia are of great influence on the
quality of life of both the patient and their family (World Health Organization, 2012). After the first
signs of dementia, patients have an average life expectancy of eight years to ten years (Papma,
2014c). The course of the disease varies greatly between patients and depends on the type and
cause of dementia, but is always progressive (Papma, 2014c). Most of the patients that suffer from
dementia will pass away due to comorbidity, for example cardiovascular disease (Moll van Charante
et al., 2012). To prevent comorbidity and the progression of the disease early diagnosis is essential
(Moll van Charante et al., 2012).
When dementia is diagnosed in an early stage, the effects of treatment plans and pharmacological
treatments are likely to have the maximum impact (Milne, 2010). With early diagnostics the ability to
cope or learn to cope with the disease increases, for both the patients and their family (Clare et al.,
2005). A short support programme for relatives of patients with dementia showed a reduction of
placement in care homes by 28% (Banerjee et al., 2007). Research in the UK showed that the
advantages of early diagnosis of dementia are mostly for the families and the people who take care
of the patients (ILiffe et al., 2003). Advantages to the patients were the reduction of uncertainty, the
planning of support, the exclusion of a cure, accepting the diagnosis and a better possibility to avoid
a crisis (ILiffe et al., 2003). This research also showed that in some cases the relatives would pressure
the GPs to refer to a specialist or that an early diagnosis could have a destructive effect for the
patient (ILiffe et al., 2003).
4To better understand the current process of diagnosis and the importance of an early diagnosis for
patients suffering from dementia, a further examination of the different methods of diagnosis is
required.
The first recognition of dementia related symptoms usually takes places in the general practice. The
general practitioners indicate that they look for changes over time in the behaviour of their older
patients to recognize dementia (Hansen et al., 2008). Diagnosing dementia by the general
practitioner can be divided into four stages (Moll van Charante et al., 2012):
1. Recognition of symptoms, by the patient and their surroundings;
2. Determination of dementia according to DSM-IV criteria 1;
3. Referral to specialist for further diagnosis;
4. Developing treatment plan for patient and the caregivers.
Important tools for the diagnosing of dementia have been developed over the years. The two most
frequently used methods are the Mini-mental state examination (MMSE) and the clock drawing test
(Moll van Charante et al., 2012). The Mini-mental state examination is used to measure cognitive
functioning within ten minutes. It measures orientation, short term memory, language, recognition
and the ability to reproduce a geometric figure (Moll van Charante et al., 2012). With the clock
drawing test, or klokteken test (KTT), the patient is asked to draw a circle, add all the numbers and
set the indicators of the clock to ten past eleven. This test measures different cognitive abilities and
is easy to use (Moll van Charante et al., 2012).
There is no cure available for patients who suffer from dementia (World Health Organization, 2015),
therefore the focus of treatment is on improving the quality of life of the patient and supporting the
families. The treatment consists of a treatment plan and a support plan, these are adjusted over time
to have the best possible treatment for the patient. Case management is often used for dementia
patients, the case manager is primarily a health care provider and will support the patient in the
whole process. (Richtlijn Diagnostiek en Behandeling van dementie, 2014).
A GP has a large variety of conditions and symptoms to diagnose, so the use of guidelines for a
particular disease is sometimes too specific (Pimlott et al., 2009b). The process of diagnosing
dementia is more complicated than other chronic conditions because of the complexity of the brain
(Pimlott et al., 2009b). Especially in an early stage dementia is not always recognized due to
uncertainty of the diagnosis (Pimlott et al., 2009b).
1
A memory defect, one or more cognitive dysfunctions, a dysfunction that gives a significant limitation to social
or professional functioning in comparison to the previous level of functioning, and no sign of delirium.
5A number of obstacles were identified that could delay or prevent the delivery of appropriate care.
Although GPs indicated that they think dementia should be diagnosed in an early stage, they feel
embarrassed to perform a cognitive examination in an early stage when dementia is not clearly
present (van Hout et al., 2000). The uncertainty of the disease being present is the most important
factor for not giving the diagnosis to patients (Vassilas & Donaldson, 1998).
In order for a GP to recognize all the symptoms of dementia and thus accurately diagnosing the
patient, several factors are important. Among others, it is important that the GPs have the required
knowledge, skills and motivation for an innovation to be successful in their practice (Wensing et al.,
1998). A study in the Netherlands showed that knowledge and skills transfer are necessary to achieve
change, however this is not enough by itself. “Other barriers that may prohibit change include an
inadequate practice organization, lack of time, negative financial incentives, negative attitudes in
colleagues, or resistance from patients” (Wensing et al., 1998). To remove these barriers, the
influence of a managerial body and influence of a social kind can help (Wensing et al., 1998).
Other barriers to successfully diagnose dementia in general practice have also been found in other
studies. Among those is a study in Germany, where there is scepticism towards the dementia
diagnosing process (Thyrian & Hoffmann, 2012). One third of the GPs felt competent to take care of
patient with dementia, they also agreed that continuous guidelines and education are needed to
have an optimal diagnosis (Thyrian & Hoffmann, 2012). However, general practitioners in Canada
indicated that future guidelines should accurately reflect the daily challenges of physicians (Pimlott
et al., 2009a). Although, research in the UK showed that GPs are not always willing to apply evidence
based guidelines (Cranney et al., 2001). They think that the guidelines are only applicable in an ideal
situation and when the patient meet the same standards that were used in the trial (Cranney et al.,
2001). Some GPs viewed the guidelines as well-informed suggestions, while others saw it as a
standard of care that has to be followed (Pimlott et al., 2009a). Others think that guidelines are an
informational resource and will become less useful when used more frequently (Pimlott et al.,
2009a).
An educational intervention for the diagnosis of dementia in the UK showed that a lack of time and
unknown effectiveness of an intervention might be a discouragement for GPs to participate in an
educational trial (Iliffe et al., 2012). The factor time can be seen as both a barrier and an enabler.
When a GP has more appointments over time, small changes in the patient will be noticed. But time
is also a barrier, over time patients will suffer from comorbidity (Pimlott et al., 2009b).
6Research in Australia shows that several factors are important to determine the effectiveness of a
new dementia screening (Grimshaw et al., 2004). A systematic review shows that the effectiveness
and efficiency of guideline dissemination and implementation strategies result in improvements in
overall care in 86,6% of the observations (Grimshaw et al., 2004). The main factor that must improve
is the GPs identification of dementia, the distinction between dementia and other diseases, the GPs
elimination of reversible causes of cognitive dysfunction and the active management by referring to
the correct specialist in a certain situation (Pond et al., 2012). Outcomes that are important for the
patients and their support are a more acceptable process for the patient and better health outcomes
for the patient (Pond et al., 2012). Research in the UK showed that early diagnosis has positive
effects on the quality of life of a patient with dementia (Banerjee et al., 2007).
Before a new method of screening, or any healthcare innovation, can be broadly adopted, it needs to
be distributed and accepted by its users. An important theory for the diffusion of innovations was
developed by Rogers in 1983 (Rogers, 1983). The diffusion of innovation model describes five steps in
the decision making process for clinical changes (Rogers, 1983; Sanson-Fisher, 2004). At first the
developers of an innovation need the knowledge about the clinical change (Sanson-Fisher, 2004).
After that the individual clinicians have to be persuaded about the advantages of the innovation
(Sanson-Fisher, 2004). When clinicians are persuaded about the advantages they need to read,
attend workshops and communicate with other clinicians to decide whether to adopt or reject an
innovation (Sanson-Fisher, 2004). If a clinician is positive, he needs to incorporate the innovation in
the daily activities (Sanson-Fisher, 2004). At last the clinician needs to discuss and compare the
innovation with peers (Sanson-Fisher, 2004).
To have a successful implementation of an innovation in any field, the users of the innovation must
embrace it. Therefore, they must show the intention to perform certain behaviour by using the
innovation. The issues concerning the likelihood of a general practitioner implementing a new
guideline can be placed in the categories mentioned in the Theory of Planned Behaviour (Kortteisto
et al., 2010). When applied to this theory, this suggests that general practitioners have a slight
tendency towards a negative attitude when it comes to implementing a new innovation. The Theory
of Planned Behaviour (TPB) is a model that is used to explain human behaviour. This model states
that individuals act in a certain way because they consider all possible implications of their actions in
a rational way (Morrison & Bennett, 2010). A central factor in this theory is the individual’s intention
to perform a given behaviour (Azjen, 1991). Three different factors are of influence on the intention
of behaviour, attitude (1), the subjective norm (2) and perceived behavioural control (3). The attitude
is a positive or negative view toward the behaviour. The subjective norm is the perceived social
7pressure to behave in a certain way. The perceived behavioural control is the perceived ability to
perform the behaviour. The model can be found in
. The resources and opportunities of a person determine in some extent the likelihood to perform
certain behaviour, but even more important is the perceived behavioural control (Azjen, 1991). The
TPB suggests that a GPs intention to use an innovation is determined by his positive or negative
opinion of the technology (1), the perception of the opinions of relevant others on whether or not he
or she should use the technology (2) and the perception of the availability of resources and skills to
use the innovation (3) (Chau & Hu, 2001).
This TPB is an important tool to predict and understand how people handle new innovations. If they
have a negative attitude towards an innovation they will be less likely to use it. Therefore, it is
important that all these factors of the TPB are positive to have a successful implementation.
According to a study in Australia, the attitude and subjective norms are the most important
predictors for the adoption of a healthcare innovation and the willingness to use it (O'Connor, 2007).
Research in Finland showed that the subjective norm, perceived behavioural control and attitude are
important factors to predict the use of clinical guidelines in general practice (Kortteisto et al., 2010).
The most important factor for the intention to use of a new innovation for GPs is the perceived
behavioural control (Kortteisto et al., 2010). This research also shows that the Theory of Planned
Behaviour is a suitable theoretical framework for the implementation of guidelines in general
practice (Kortteisto et al., 2010). A research in the UK also showed that the perceived behavioural
control and the attitude, but not the subjective norm, were predictors for following guidelines
(Rashidian & Russel, 2011).
Figure 1. Theory of Planned Behaviour
8Current state in Twente
In 2013 a collaboration started between several organisations: Twentse dementieketens, Twentse
Huisartsen Onderneming Oost Nederland (THOON), Regionale Ondersteuningsstructuur
Eerstelijnszorg Twente (ROSET), Federatie Eerstelijnszorg Almelo (FEA) and IZO Twente. Their goal is
to increase the expertise concerning dementia in general practice. The expectation is that the
provided care will be better for patients and for their family when health care providers understand
dementia better.
The other goal is to detect dementia in an early stage. To achieve these goals different tools are
available to train medical professionals, one of these tools is the flowchart dementia. The flowchart
was developed by different professionals in the region of Twente. An advisor of ROSET coordinated
and supported the process of creating the flowchart. Several specialists were involved in this process:
general practitioners, geriatric specialists, case managers, clinical geriatrician and neurologists. To
help the new practices implement the flowchart, training and an e-learning course have been made
available.
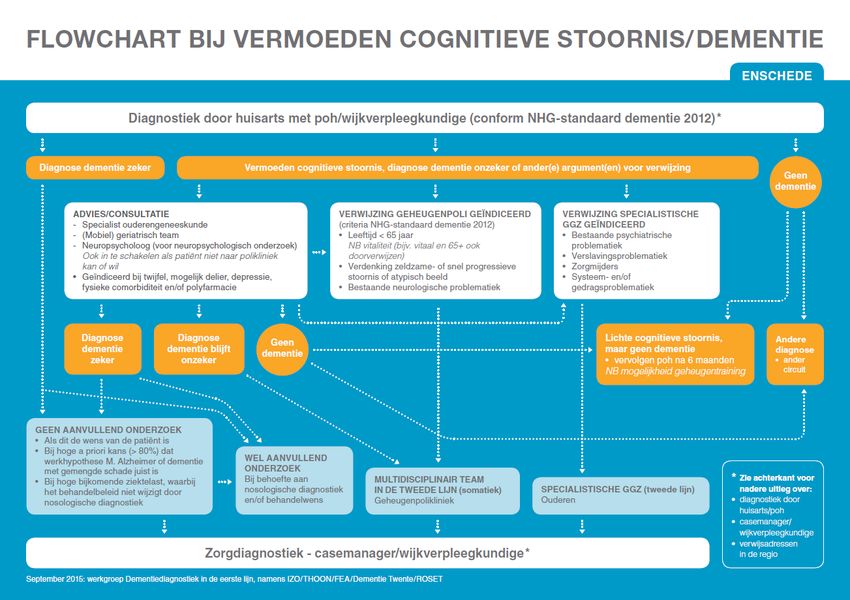
The flowchart dementia is a tool to support general practitioners and nurse specialists in diagnosing
dementia. The flowchart describes the steps a general practitioner can take as well as the process of
referring to a specialist. This tool describes when to refer to a specialist and what external parties can
be of use for a specific patient. The contact information of several organisations that are involved
with dementia are mentioned. See Appendix A: Flowchart Dementia for the flowchart dementia.
This flowchart should be used by general practitioners when symptoms point to dementia. In this
case the general practitioner can request a case manager. The case manager is responsible for
guiding the patient through the dementia care process and advise him/her, so he will receive the
best possible care. A case manager also has a central position in the network and is able to cooperate
with different healthcare providers and keep everyone who is involved in the process up to date
(Minkman et al., 2009). The strategies for case management vary in terms of care organization and
content. This variation depends on the regional and local practices and random factors (Verkade et
al., 2010).
In this study we will focus on the flowchart dementia, that is part of the new pilot dementia,
developed by Dementie Twente. At the moment numerous general practices in the region Twente
are using these new tools for diagnosing dementia. One of the organisations involved in this pilot
program is THOON. Among its members a few general practices have joined the pilot program
dementia. If the results of the pilot program are positive, further implementation of this method will
be considered among all general practices. After the implementation of the flowchart in the pilot
program, the effects of this new method of diagnosing will be measured. To get a first impression of
9the impact of the pilot program, perceived differences between the new diagnosing method and the
old method according to the GPs are investigated. The main goal of this research is to determine the
facilitators and barriers for the general practitioners when using the flowchart dementia and if
possible the effects of the flowchart for the GP and the patient.
Therefore, the following to research questions were formulated:
‘What are the facilitators and/or barriers in the primary care process, after the implementation of
the new flowchart in diagnosing dementia, from the perspective of the GP?’
‘What effects of the implementation of the new flowchart dementia do the GPs experience,
compared to the previous diagnosing methods?’
10Methods
The aim of this study is to evaluate the facilitators, barriers and the effects of the new pilot dementia
in Twente, according to the GPs. This study is a mixed methods research, it combines qualitative and
quantitative data.
The measurement instrument for determinants of innovations (MIDI) is used as a basis for the
questionnaire (Fleuren et al., 2014). This instrument can be used to measure determinants that can
affect the implementation of a new innovation. MIDI has three different categories that will be
evaluated in this research: determinants of the innovation, determinants of the organisation and
determinants of the user. Each of these categories consist of questions that can be used to evaluate
different factors. MIDI is a framework that can be used to evaluate an innovation, therefore the
questionnaire was adjusted for this research. This section of the questionnaire serves as the
quantitative part of the study. Open questions are used to get extra information and determine the
effects of the flowchart dementia. These questions about the use, effects and opinions of the GPs in
the process of implementation provide the qualitative data for analysis.
Study population
In a qualitative study the population is often relatively small and selectively chosen (Plochg et al.,
2007). The following inclusion criteria are used for the selection of participants in this research.
General practices are included when they are joining the new case management and early diagnostic
pilot of Dementie Twente. Four different regions are included:
Northwest-Twente: municipalities Almelo, Tubbergen, Twenterand, Hellendoorn, Wierden and
Rijssen-Holten.
Central-Twente: municipalities Borne, Hengelo and Hof van Twente.
Northeast-Twente: municipalities Oldenzaal, Tubbergen, Losser and Dinkelland.
Southeast-Twente: municipalities Enschede and Haaksbergen.
The total number of members of the organisation THOON is 188, while FEA has 137 members. These
GPs will all be included in this research.
Data collection
The recruitment of general practices for the questionnaires is done with the help of the organisation
THOON. THOON sent an e-mail to all practices to inform them about this research and send a link
with the questionnaire. The questionnaire is distributed among general practices that participate in
the pilot. The questionnaire is published mid-April and was available until the end of May. The
question ‘Are you familiar with the flowchart dementia?’ was asked, after the questionnaire was sent
to the GPs. This question was sent in an email to get more information about the usage of the
11flowchart dementia. A different link within the email was sent to FEA and THOON to see whether
there is a difference between the organisations.
Questionnaire
MIDI, developed by TNO, was used to determine the effects and the facilitators and barriers within
this implementation process. The MIDI questionnaire evaluates three different categories:
determinants of innovation, determinants of user and the determinants of the organisation. In Table
1 and Table 2 the subject of each questions can be found. The three categories named by MIDI can
be found in the third column.
Some additions or adjustments are made to fit it to this particular research. The following
adjustments were made to the MIDI questionnaire. The questionnaire can be found in Appendix B:
Questionnaire.
Questions 13 and 14 are split up into two questions to check whether there are advantages and
disadvantages in the use of the flowchart dementia. Question 15 is formulated to see if the GPs really
think it is important to have a quicker diagnosis. Question 21 is added to see if the GPs need more
information or education for the use of the flowchart dementia.
Question 29 is also added, this is to check whether the GP thinks it is important to have a faster
diagnosis and if he is able to actually perform a faster diagnosis for his patients. This is one of the
main reasons for the development of the flowchart.
Questions 33, 34, 35, 36 and 37 are open questions that are added to get some more insight in the
opinions of the users of the flowchart, for example time difference in diagnosis and a time to referral
to a specialist. Additional questions were used to determine the perceived health effects on the
patients, process effects and the practical advantages and disadvantages of the use.
The first research question, ‘What are the facilitators and/or barriers in the primary care process,
after the implementation of the new flowchart in diagnosing dementia, from the perspective of the
GP?’ focusses on the facilitators and barriers in the process of implementation of the new flowchart
dementia. Several questions of the questionnaire can be used to find the facilitators and barriers in
this process. These questions are primarily found in the closed part of the questionnaire. For
example, if the information dissemination, time or financial means are limited, the adoption of the
flowchart will be slowed or postponed. These are just examples of possible facilitators and barriers
within this questionnaire, it depends on the results to find the factors that influence this process.
The second research question, ‘What effects of the implementation of the new flowchart dementia
do the GPs experience, compared to the previous diagnosing methods?’ focusses on the effects that
12the GPs experience, after the implementation of the flowchart. The questions from the questionnaire
that can be used to answer this, are focussed on the user and innovation categories. If the flowchart
has a positive effect on the GP, for example a quicker and more efficient way of working, he will be
more motivated to use this flowchart. The most important question to see the effects on the patient
is question 35, this open question gives the GP the opportunity to tell more about the perceived
effects on the patient. The open questions are optional, if it turns out that the response rate on these
questions is low, additional interviews will be held to get this data.
The MIDI that is used in this research has some links to the TPB. In the fourth column of Table 1 and
Table 2 the link is made between the MIDI questionnaire and the TPB. The three categories within
the TPB can be linked to the questions in the categories attitude, subjective norm and perceived
behaviour control, which are used to determine the weak points of the flowchart dementia. If the
attitude towards the innovation is negative, they are not likely to adopt this flowchart. The same
counts for the subjective norm. The greater the perceived behavioural control, the intention to
perform certain behaviour should also be greater. The data that will be collected can specify the
categories in which the negative attitude can be found. With this information THOON will be able to
make a better implementation strategy to further implement the flowchart.
Table 1. Closed questions questionnaire
Innovation/user/ Attitude/subjective norm/
No. Subject organisation perceived behavioural control
1. Knowledge flowchart User Attitude/Perceived behavioural
control
2. Organisation Organisation -
3. Formal guidelines Organisation -
4. Coordination organisation Organisation -
5. Other changes organisation Organisation Attitude
6. Clear pathway activities Innovation Attitude
7. Correct information Innovation Attitude
8. Enough information and materials Innovation Perceived behavioural control
9. Too complex Innovation Attitude/Perceived behavioural
control
10. Connection with normal work Innovation Attitude
11. Effects are visible Innovation Attitude
1312. Appropriate for patients Innovation Attitude
13. Advantages User Attitude
14. Disadvantages User Attitude
15. Important to have quicker User Attitude
diagnosis
16. Part of job User Attitude/Subjective norm
17. Patient satisfaction User Attitude
18. Patient cooperation User Attitude
19. Support colleagues User Subjective norm
20. Knowledge to use User Attitude/Perceived behavioural
control
21. Need for extra information User Perceived behavioural control
22. Enough personnel Organisation -
23. Enough financial means Organisation -
24. Enough time Organisation -
25. Enough materials to use Organisation -
26. Transfer knowledge Organisation -
27. Easy access information Organisation -
28. Feedback to Dementie Twente Organisation -
29. Quicker diagnosis expectation Innovation Attitude
30. Expectation of use by colleagues User Subjective norm
31. Able to stick to flowchart User Perceived behavioural control
32. Colleagues using the flowchart User Subjective norm
Table 2. Open questions questionnaire
Innovation/user/ Attitude/subjective norm/
No. Subject organisation perceived behavioural control
33. Time to diagnose Innovation Attitude
34. Quicker referral Innovation Attitude
35. Effects on patients Innovation Attitude
36. Advantages/disadvantages User Attitude
37. Other remarks - -
14Data analysis
The data will be processed with the use of SPSS and Microsoft Excel. Descriptive statistics will be
used to determine the main results of the questionnaire. All the results will be shown in a table with
the total of people who gave a specific answer and the percentages of the total group, to have an
overview of the opinion of the general practitioners. This way it can be determined whether there is
a positive, neutral or negative attitude towards a question. The answer categories ‘totally disagree’
and ‘disagree’ will be grouped as negative, the answer categories ‘totally agree’ and ‘agree’ will be
grouped as positive. The ‘neutral’ answer will be grouped as neutral, this way there are three
categories in the results table. Also a boxplot will be made to have a visual overview of the means,
medians and range of the answers that are given by the GPs.
The results of the open questions will be coded with 4 different colours to have an overview of the
results. The four different categories for this coding are: Positive, negative, never used/no answer
and neutral/unclear. These answers will be translated in English, but the original Dutch results can be
found in Appendix C: Coded answers to open questions in Dutch.
15Results
The questionnaire was sent to all members of FEA and THOON, this is a total of 325 GPs.
The total number of GPs that filled in this questionnaire is 22 (n=22), this brings the response rate to
6.8%. The average age of the population is 51 years and there are slightly more male respondents
than females.
The response rate on the question, ‘Are you familiar with the flowchart dementia?’ is 21.5%, 70 out
of 325 GPs answered this question. The response rate for FEA (10.2%) was lower than THOON
(29.8%). A total of 85.7% of the FEA respondents are familiar with the flowchart and a total of 75.0%
of the THOON respondents are familiar with the flowchart.
Table 3. Familiarity flowchart dementia
FEA THOON
Are you familiar with the flowchart dementia? n (%) n (%)
Yes 12 (85.7%) 42 (75.0%)
No 2 (14.3%) 14 (25.0%)
n 70
At first the data that was collected by the closed questions was analysed. The summary of the data
that is explained in the next part can be found in Table 4, Table 5 and Table 6.
In Table 5 a connection is made with the Theory of Planned Behaviour. Not every subject can be
matched to a category of the TPB, these are left open and will not be taken into account for this
analysis.
The closed questions have been answered positively by the general practitioners. The only question
that was answered negatively was in the category subjective norm. This question was about
perception of use by their colleagues. They indicated that they expect that only a minority will be
using the flowchart. The overall attitude towards the flowchart dementia is positive, most questions
are answered positively or neutral with a tendency towards positive. The GPs indicated that they
have not used the flowchart as much as they would have wanted to, so that could be a reason for the
large neutral group. But those who have used the flowchart are in general very positive. The answers
that are categorized as ‘perceived behavioural control’ are also very positive, only one factor was
answered neutrally. With this information we can conclude that the perceived behavioural control
and the attitude of the GPs towards the flowchart dementia is good. They think it is a useful
innovation and see themselves capable of actually using it.
16The open questions are also answered in a positive way. The attitude is the only factor that can be
researched for the open questions. But the overall attitude towards the flowchart is positive. The GPs
rarely see any obstacles and are happy to use the flowchart now and in the near future.
The overall results of the closed questions indicate that there are more facilitators than barriers after
the implementation of the flowchart dementia. The following barriers were found: a lack of
coordination, other changes within the organisation, no formal guidelines, no knowledge transfer
and the difficulty of giving feedback to Dementie Twente.
On the other hand, the following facilitators were found: a clear pathway of activities, flowchart
based on correct knowledge, not too complex, a good connection with the daily work, appropriate
for patients, no disadvantages, part of the job of the GP, expectation that the patient will cooperate
and sufficient knowledge of the GP to use the flowchart.
Table 4. Demographics
Subject n(%) n(%)
Gender Male Female
13 (59.1%) 9 (40.9%)
Organisation THOON FEA
12 (54.5%) 10 (45.5%)
Table 5. Facilitators and barriers of the MIDI questionnaire combined with the TPB
Negative
Totally Positive
disagree and Totally agree and
disagree Neutral agree
Subject n(%) n(%) n(%)
Attitude
Clear pathway activities 1 (4.5%) 7 (31.8%) 14 (63.6%)
Correct information - 5 (22.7%) 17 (77.3%)
Connection with normal work 2 (9.1%) 7 (31.8%) 13 (59.1%)
Effects are visible 6 (27.3%) 14 (63.6%) 2 (9.1%)
Appropriate for patients - 9 (40.9%) 13 (59.1%)
Advantages 1 (4.5%) 12 (54.6%) 9 (40.9%)
Disadvantages 10 (45.4%) 12 (54.6%) -
Important to have quicker diagnosis 2 (9.1%) 12 (54.6%) 8 (36.3%)
Patient satisfaction - 16 (72.7%) 6 (27.3%)
Patient cooperation - 10 (45.5%) 12 (54.5%)
Quicker diagnosis expectation 2 (9.1%) 12 (54.5%) 8 (36.4%)
No Yes
Other changes organisation 11 (50.0%) 11 (50.0%)
17Attitude + Subjective Norm
Part of job 2 (9.1%) 8 (36.3%) 12 (54.6%)
Attitude + Perceived Behavioural Control
Too complex 13 (59.1%) 6 (27.3%) 3 (13.6%)
Knowledge to use 2 (9.1%) 4 (18.2%) 16 (72.7%)
Knowledge flowchart
No knowledge Know it but haven’t Know it and read it Know it and read it
read it superficially thoroughly
1 (4.5%) - 14 (63.7%) 7 (31.8%)
Subjective Norm
Support colleagues 2 (9.1%) 9 (40.9%) 11 (50.0%)
Expectation of use by colleagues 2 (9.1%) 14 (63.6%) 6 (27.3%)
Colleagues using the flowchart
No one Hardly any A minority A majority Almost All
colleague everyone
1 (4.5%) 4 (18.2%) 9 (40.9%) 4 (18.2%) 2 (9.1%) 2 (9.1%)
Negative 14 (63.6%) Positive 8 (36.4%)
Perceived Behavioural Control
Enough information and materials 2 (9.1%) 9 (40.9%) 11 (50.0%)
Need for extra information 10 (45.5%) 7 (31.8%) 5 (22.7%)
Able to stick to flowchart 3 (13.6%) 11 (50.0%) 8 (36.4%)
No TPB
Enough personnel 4 (18.2%) 7 (31.8%) 11 (50.0%)
Enough financial means 8 (36.3%) 8 (36.4%) 6 (27.3%)
Enough time 5 (22.7%) 15 (68.2%) 2 (9.1%)
Enough materials to use 4 (18.2%) 13 (59.1%) 5 (22.7%)
Transfer knowledge 13 (59.1%) 8 (36.4%) 1 (4.5%)
Easy access information 5 (22.7%) 9 (40.9%) 8 (36.4%)
Feedback to Dementie Twente 17 (77.3%) 5 (22.7%) -
No Yes
Formal guidelines 15 (68.2%) 7 (31.8%)
Coordination organisation 14 (63.6%) 8 (36.4%)
Table 6. Results questionnaire open questions
Subject Results
Attitude
Time to diagnose Positive
Quicker referral Positive
Effects on patients Positive
Advantages/disadvantages Positive
No TPB
Other remarks Positive
18A visual overview of the results can be found in Figure 2. The vertical axis has the numbers 1 to 5,
where 1 is totally disagree and 5 is totally agree. Two questions are answered negatively and you can
see the range goes from 1 to 3, those are questions about disadvantages and feedback to Dementie
Twente. The GPs answered that they see no real disadvantages in the use of the flowchart. They also
indicated that there is no feedback to the developers of the flowchart. A large group of subjects are
answered within the range of 2 to 4, the mean can be used to see if there is a tendency towards
positive or negative.
19Figure 2. Facilitators and barriers of the MIDI questionnaire
Overview facilitators and barriers
5,0 5,0
4,0 4,0
3,0 3,0
2,0 2,0
1,0 1,0
median min max mean
20The open question part of this questionnaire was formed by the following five subjects: Difference in
time needed to diagnose dementia, time to referral to a specialist, effects for the patient,
psychologically, environment patient, health effects and effects on the health care process),
advantages or disadvantages and other remarks or suggestions. An overview of all the answers in
Dutch can be found in Appendix C: Coded answers to open questions in Dutch. In Table 7 the legend
for the open questions can be found. Table 8 gives an overview of the number of answers in each
category. The Table 9 and Table 10 give an overview of the open questions of the questionnaire. The
answers are translated in English and coded according to legend in Table 7.
Time to diagnose
11 out of the 22 GPs indicate that they have not used the flowchart dementia yet, so they do not
know if they will be able to have a faster diagnosis. Two doctors indicated that the use of the
flowchart dementia takes more time than usual for them and the POH. A total of eight doctors
indicated that they are very positive about the flowchart and think it will be faster in diagnosis, in
what way they do not know yet. They know when and where to refer to and which tests they need to
do themselves. This is indicated by the following two quotes. ‘Hard to say, but the pathway is a lot
clearer than before’. ‘Hopefully it will save time, we refer later on in the process and when we refer to
a specialist it is more focused.’
One of the most mentioned comments on this question is the fact that the flowchart is very
structured and clear. The GPs know where to find the information they need now. ‘No, I wouldn’t say
the diagnosis is quicker, but you are able to find the right persons and contact information quicker
now.’
Time to referral
A total of twelve doctors have not used the flowchart yet or have not answered this question. Only
one doctor thinks there is no difference between the moment of referral before and after the
implementation of the flowchart dementia. Nine GPs were very positive about this question. They
indicated that they refer to a specialist later on in the process, with the help of the flowchart
dementia they now know when is the best time to refer to the specialist. ‘I think a number of
referrals can be prevented, when we refer to a specialist it is more specific.’ ‘Later on and more
specific, we now have more knowledge about the NHG guidelines dementia thanks to the flowchart
dementia.’
Before the flowchart was implemented one GP indicated that he/she send every single case of
possible dementia to a specialist. ‘A lot less, I used to send everyone to a specialist for diagnosis.’
When they refer a patient now, they know when a referral is needed. ‘Later, a clear description of
when a referral is needed and meaningful.’
21The GP’s perceived effects for the patient
Ten doctors did not answer this question, the rest of them answered the ones in which they saw
effects. The overall comments were very positive and they think that the flowchart is good for the
patient as well. Some overall comments were made that can be applied for all the effects below.
‘Quicker diagnosis.’ and ‘Better.’
The flowchart stimulates a quicker and more efficient diagnosis, the doctors indicated that these
factors are very important for their patients. By having a fast diagnosis, the uncertainty and stress for
the patients will be reduced. ‘By quickly getting clarity about a possible diagnosis of dementia we can
reduce the uncertainty and distress of the patient.’
‘Less confronting due to less referrals. This may lead to less commotion.’
According to the doctors, patients perceive a timely and effective diagnosis as important. The GPs
indicated that the flowchart improves the diagnosis time and uncertainty around the diagnosis and
therefore assume that the patients experience less uncertainty and stress.
The same factors are important for both the patient and their environment, they want to know for
sure if their family member has dementia. So for them it is important that they have a fast and
efficient diagnosis. When they are informed in an early phase, the tools that are needed to deal with
the patient can be given. ‘The environment of the patient can get the ‘tools’ needed to deal with the
behaviour of the patient.’ ‘Clear information for the family, they know which people to call.’ ‘Less
hassle.’ With this flowchart dementia the GP is the main person to diagnose a patient. But often
worried relatives may push for further examinations because they want to make sure their family
member has dementia. ‘Sometimes they want more examinations, but those are not always needed.’
The effects, as a result of the flowchart dementia, on the health of the patient, are not very clear yet.
The GPs made the following statements about the possible health effects of the flowchart. ‘Now a
patient can get the right care at the right place.’ ‘Quicker diagnosis is better for the further guidance.’
‘Less demanding examinations.’. These comments are not about the health effects for the patients,
but more the indirect effects of the flowchart. Obviously a quicker and less stressful diagnosis is
better for a patient.
The main effect on the healthcare process that was mentioned by the doctors was the better
communication between healthcare professionals. With the flowchart dementia all contact
information that is needed within one of the regions is summarized on the second page. This makes
the communication much easier. ‘Shorter lines of communication.’ and ‘All health care providers have
22the same view on dementia now.’ With these short lines of communication and less referral to the
hospital the costs will be lowered as well. ‘Less costs and hassle to go to the hospital.’
The majority of the doctors indicated that they haven’t used the flowchart as much as we expected.
But they hope to use it in the near future. ‘Nice flowchart to use in the general practice.’
The current course for a patient with dementia is much clearer for both the GP and the patient.
‘Overall a clearer pathway where the patient has more clarity early on.’
Advantages and disadvantages
According to the GPs there are no disadvantages of the use of the new flowchart dementia. Five
people indicate that they have not used it yet so they don’t know. Ten doctors are very positive and
think it is a great addition to their practice. The fact that the flowchart is very structured is one of the
most mentioned comments. ‘Logical steps and a better guide to referral.’, ‘A nice overview with all
the information that is needed.’ and ‘Very clear’.
One GP also indicated that it is easy for the patient and cheaper than before. ‘Easy for the patient
and cheaper. When the situation is unclear, you can still refer to a specialist.’
Other remarks
Two doctors indicated that they are very positive about the flowchart and hope to use it a lot in the
future. One GP thinks that they won’t use the flowchart as much as expected because there are not
many patients with dementia in their practice that they need to diagnose. One other doctor
commented that their practice is doing another major implementation process that has first priority.
The overall comments made by the GPs were very positive, according to these open questions there
would be no reason why the flowchart dementia shouldn’t be further implemented in the general
practices. Almost every question that is answered is of a positive nature. They think the flowchart
dementia is a great addition to their usual care.
23Table 7. Legend
Neutral or unclear Positive Negative Not yet in use/ no answer
Table 8. Overview answers open questions
Effects on patients
Effects for the Health Effect on
Time to Quicker Psychological environment effects healthcare Other Advantages and Other
diagnose referral effects patient (family) patient process effects disadvantages remarks
12 12 19 11 17 13 19 10 14
2 - - - - - - - 1
2 3 - - - - - 3 5
6 7 3 11 5 9 3 9 2
n= 22 22 22 22 22 22 22 22 22
Table 9. Open questions overview 33, 34, 36, 37
Time to diagnose Quicker referral Effects on Advantages and disadvantages Other remarks
patients
12 12 10 10 14
We have to do more research Before the existence of the See next When there is a case of Incidence dementia too low in
ourselves and this will take flowchart we have been table for the dementia I will have to get the general practice to use it often
more time. Not clear how working this way in our effects on flowchart because I need the
much yet. practice. The flowchart hasn’t patients. information.
done anything new.
Will take more time for me and I think it will be the same. Before the existence of the At the moment we have other
the POH. flowchart we have been major implementations going on.
working this way in our Our elderly project has been
practice. The flowchart hasn’t running and will be adjusted to the
done anything new. flowchart in May 2016.
Before the existence of the Earlier, the flowchart has given Neutral Flowchart is nothing but rules
flowchart we have been me more information and regarding the diagnosis dementia
working this way in our possibilities for this process.
24practice. The flowchart hasn’t with regional agreements. Nothing
done anything new. new.
Not very clear, it takes more I think a number of referrals Can be used by everyone in the Only in use for 3 months, survey is
time because of all steps. But can be prevented and that they general practice, easier for the held too early.
the flowchart is very punctual. will be more specific. patient and cheaper. Referral is
always possible if there is any
doubt.
Hard to say, the pathway is a Less frequently. Previously, I Clarity. I always thought a specialist team
lot clearer though. referred everyone to a was needed for the diagnosis
specialist. dementia. With the flowchart we
can do it ourselves.
Referral is not always needed Most cases won’t be referred. Clear instruction, referral not First time seeing the flowchart.
with a geriatric specialist you always needed. That’s why my overall opinion is
have a faster diagnosis. neutral.
No, the diagnosis is not faster, Less referrals, because Logical steps and a better Nice flowchart to use in the general
but you can find the right diagnosis can be done in the guide to referral. Does take a practice.
person/number quicker. general practice. This could little more time.
shorten the waiting times for
the specialist.
No, hopefully it will save a lot Later and more specific, we A summary of all information I hope to use it in the future.
of time, because you will refer learned more about the NHG that is needed.
faster and more specific. guidelines because of the
implementation of the
flowchart dementia.
The waiting time for the Later, the flowchart gives a Clear, every possibility
memory clinic be shorter clear description of when a
referral is needed.
I don’t know yet, but the I think later. If you follow the flowchart it is
pathway is a lot clearer very structured.
I don’t see any disadvantages.
More structure and clarity.
25Table 10. Open question overview 35
Psychological effects patient Effects for the environment (family) Health effects patient Effect on healthcare Other effects
process
19 11 17 13 19
By quickly getting clarity about a Quickly getting clarity. Quickly getting Quickly getting clarity. Quickly getting clarity.
possible diagnosis of dementia we clarity.
can reduce the uncertainty and
distress of the patient.
Less confronting for the patient Less hassle. Now a patient can Less costs and hassle to We have to use the
because he won’t be referred as get the right care at go to the hospital. flowchart more
much. the right place carefully and talk about
it afterwards.
Better. By quickly getting clarity about a Less demanding All health care providers Overall a clearer
possible diagnosis of dementia the examinations. have the same view on pathway where the
family can get the tools needed to dementia now. patient has more
deal with the behaviour of the patient. clarity early on.
Faster diagnosis. Faster diagnosis is Knowing what is need
better for further faster.
guidance.
Faster diagnosis. Better. Faster.
Clarity about the diagnosis. Shorter lines of
communication.
Nice overview of information and More clear.
Nicer for the patient to be diagnosed Faster.
by the GP.
Sometimes they want more Better.
examinations, but those are not
always needed. And it is easier to get
the aid of a case manager dementia.
They often want more research to be
done.
Better.
26Discussion
The main objective of this study was to evaluate the facilitators and barriers according to the GPs.
Also the perceived effects of the GP, of the new flowchart dementia, on the diagnosing process for
the GP were evaluated. The overall results of the questionnaire are in line with the results found in
the literature. The link this research has made between the MIDI-questionnaire and the Theory of
Planned Behaviour deepens the conclusions that can be drawn from it. This is the first time this
comparison has been made. Also, for the GPs in the region Twente and the organisations that
created the flowchart, this research can serve as a basis to improve the flowchart itself and its
implementation.
In this study many results from earlier research are confirmed. Barriers and facilitators that were
found in research done elsewhere have also been found here. The lack of coordination within the
organization of the practices is clearly present as a barrier, along with the lack of formal guidelines by
the management (Wensing et al., 1998). The lack of social support can also be a barrier for the GPs to
use the flowchart dementia (Wensing et al., 1998). The short period the flowchart has been in use,
and the lack of visibility of results, is not yet motivating GPs to actively use the innovation, making it
a barrier (Iliffe et al., 2012).
The facilitators observed in this research have some basis in literature. Knowledge of how to use an
innovation has been mentioned as a facilitator, and is also found in this study (Wensing et al., 1998).
The basis of the flowchart in the daily work of the GPs is viewed as positive, making it a facilitator for
this flowchart (Pimlott et al., 2009a). Also, the resistance expected from patients is low, thus
confirming earlier research (Wensing et al., 1998).
This study shows that the overall effects, according to the GPs, for both the patient and the GP are
positive. The perceived effect of a quicker diagnosis being a benefit for both the patient and the GP is
in line with earlier research (ILiffe et al., 2003). The general practitioners indicated that an early
diagnosis has overall positive effects on the patient and the quality of life (Banerjee et al., 2007). The
early diagnosis also enables the family and the patient to learn how to cope with the disease early
on, instead of only being able to respond to a rapidly escalating health condition (Clare et al., 2005).
The position the families take in the diagnosing process is in line with cases described in other
literature (ILiffe et al., 2003).
Many of the facilitators and barriers found can be mapped to a factor in the Theory of Planned
Behaviour. The low perceived complexity, adequate knowledge to use and amount of information
regarding the flowchart have all been mapped to the perceived behavioural control. Research shows
that this is the main factor to determine the intention to use an innovation (Kortteisto et al., 2010).
27The cooperation experienced from patients, along with the connection the flowchart has with daily
work and its basis in correct and factual information are all factors linked to the attitude. Other
studies have identified this as the second important factor that determined the intention to use an
innovation (Rashidian & Russel, 2011). The connection with the Theory of Planned Behaviour is
important, because if all the factors of the TPB are met, the likelihood of a change in behaviour
increases. In this specific situation this would mean that the flowchart will used by a larger number of
GPs.
Limitations
In an attempt to gain more response, two emergency clinics where GPs are stationed, were visited.
At these clinics some additional information was gathered about the usage of the flowchart
dementia. They indicated that it is too early to perform this research, because the flowchart has not
been implemented in every practice. Some GPs indicated that they have not attended the training
were the flowchart was explained, and some find the flowchart hard to use without this training. The
diagnostic process itself is not clarified on the flowchart dementia, when an extra page is added with
the NHG protocols this can be solved. It turned out that GPs are overwhelmed with research
questionnaires by students and research organisations on a daily basis. The low response rate on the
questionnaire can be attributed to this. With this low response rate, it is difficult to draw any final
conclusions from the results. Only a small percentage of the focus group replied to the questionnaire.
Because of this small amount of respondents, the results cannot be generalized to the entire group,
therefore the external validity of the results cannot be guaranteed. The group that did not respond
to the questionnaire has probably not used the flowchart as much as the population that did
respond. The answers of this small group can give a distorted view for the overall population, this can
go both ways. The most likely situation is that GPs that are currently working with, and have a
positive attitude towards the flowchart, have responded to the questionnaire. This would give a
more positive result regarding the flowchart. If the response rate was higher, a comparison could
have been made between different groups within the population to see whether there are
differences.
The question ‘Are you familiar with the flowchart dementia?’ was later added in an email to the GPs
to find out the percentage of people that actually know the flowchart. A similar question was asked
in the questionnaire about the knowledge of the flowchart. The majority of the GPs that filled in this
questionnaire indicate that they know the flowchart and have read it superficially (63.7%) or
thoroughly (31.8%). However, the overall familiarity of the GPs with the flowchart is a much lower, as
shown by the results of the later e-mail question. A total of 14.3% of the FEA members and 25% of
the THOON members indicate that they are not familiar with the flowchart dementia. Only one GP
28You can also read