An incentive based mitigation strategy to encourage coexistence of large mammals and humans along the foothills of Indian Western Himalayas - Nature
←
→
Page content transcription
If your browser does not render page correctly, please read the page content below
www.nature.com/scientificreports
OPEN An incentive‑based mitigation
strategy to encourage coexistence
of large mammals and humans
along the foothills of Indian
Western Himalayas
Ruchi Badola, Tanveer Ahmed, Amanat Kaur Gill, Pariva Dobriyal, Goura Chandra Das,
Srishti Badola & Syed Ainul Hussain*
Escalation of human–wildlife conflict (HWC) is a barrier to the conservation of ecological corridors
across the globe. The existing mechanisms to counter HWC are either economically and socially
taxing, or ineffective for long-term management. We assessed HWC in the corridor linking the
Rajaji and Corbett Tiger Reserves in Uttarakhand, India, and its drivers, along with the benefits
derived by local communities from the forest. We designed an innovative incentive-based mitigation
mechanism to encourage coexistence of people and wildlife around the corridor. Costs incurred due
to conflict and benefits derived from the forest were assessed using semi-structured questionnaire-
based personal interviews (n = 757) with representatives from forest dependent households (hh).
Fuelwood (1678.7 ± 131 kg hh−1 year−1), fodder (4772 ± 186 kg hh−1 year−1) and green/dry grass
(3359 ± 104 kg hh−1 year−1) contributed 3 ± 1%, 6 ± 0.5% and 9 ± 1%, respectively, to the annual income
of dependent households. 69% of the households practising agriculture reported crop damage by wild
animals, 19% of the households that owned livestock reported livestock loss, and 1.58% reported
attack on humans resulting in injuries. The cost incurred due to crop raiding and livestock depredation
was US $ 159.83 ± 1.0 hh−1 year−1 and US $ 229.32 ± 34.0 hh−1 year−1, respectively. Crop loss was
positively associated with the number of crops grown per season and cultivation of sugarcane, wheat
and pulses, and negatively with distance from forest and cultivation of fodder and finger millet.
Livestock depredation was negatively associated with distance from forest and positively with
number of livestock owned, primarily calves. The accounting profit from cultivating a hectare of land,
in the absence of crop depredation by wild animals, was estimated at US $ 3571.84 ha−1 year−1 and
US $ 361.44 ha−1 year−1 for the plains and hills, respectively. This value can be used to calculate the
payments to be paid to local communities to encourage them to adopt HWC resistant agricultural
and pastoralism practices. The net present value of benefits from participating in the payments to
encourage coexistence programme for 5 years, discounted at 12%, was US $ 12,875.7 ha−1 for the
plains and US $ 1302.9 ha−1 for the hills.
The burgeoning human population, coupled with agricultural expansion and unplanned rapid infrastructure
development, has fragmented natural ecosystems1. Fragmentation alters the composition and configuration of a
landscape and impacts the biodiversity2. Though the importance of patches and isolation due to fragmentation
is highlighted by the island biogeography theory3, the application of this theory to the terrestrial environment
is questionable. Meta-population theory suggests that isolated patches may not support populations of species
individually; there should be a certain exchange of individuals and genetic material among the populations4.
Thus, corridors become a significant factor in terrestrial conservation. Forest corridors facilitate shifting of spe-
cies in response to climate change, movement of individuals, and provide several direct and indirect ecosystem
services vital for human w ellbeing5–10.
Wildlife Institute of India, Chandrabani, Post Box # 18, Dehradun, Uttarakhand 248001, India. *email: hussain@
wii.gov.in
Scientific Reports | (2021) 11:5235 | https://doi.org/10.1038/s41598-021-84119-7 1
Vol.:(0123456789)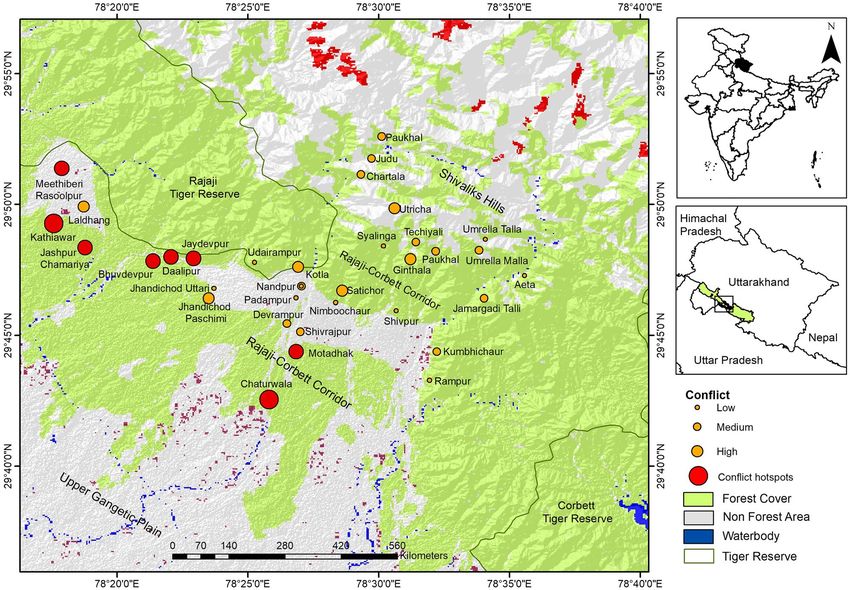
www.nature.com/scientificreports/
In India, most of the corridors connecting large forest patches including protected areas (PAs), are shared by
wild animals and people, mainly natural resource-dependent local c ommunities11,12. These corridors are under
immense pressure due to increasing human population, high demand for land for human settlements within the
corridors and biotic pressures like livestock grazing, extraction of various forest products, mining activities and
various development p rojects11,12. The degradation of habitats, coupled with competition for limited resources,
forces wild animals into human settlements and their vicinity, leading to human–wildlife conflict (HWC) in the
form of crop raiding, livestock depredation and human injuries and deaths, ultimately threatening the survival
of the wild a nimals13,14.
The economic and social losses due to human injuries and casualties, crop damage and livestock depredation
lead to hostility and reduced support for wildlife conservation by local communities. Local people respond to
conflict by poisoning, shooting or trapping wild animals, which counteract conservation measures undertaken
by wildlife managers15. The existing mechanisms available for mitigating HWC include fencing, translocation
and sterilization. These mechanisms are more taxing, both monetarily and physically, and are ineffective in
long-term management16,17. The compensatory schemes in third world countries like India have largely failed
to compensate the incurred losses18–20. Thus, there is a need to find innovative measures to effectively reduce
conflict and create conditions for peaceful coexistence of humans and wild animals.
Incentive-based mechanisms have been shown to be more effective compared to compensatory s chemes21.
Direct payments or incentives, considered a form of payment for ecosystem services (PES)22,23, as an effective con-
servation tool are gaining the approval of the scientific community and increasingly being implemented to garner
the support of local people for conservation actions24. PES is implemented by establishing appropriate prices
and giving financial incentives to landowners in exchange for activities that support conservation i nitiatives25.
Wunder26 defined PES as “a voluntary transaction where a well-defined ecosystem service (or a land use likely to
secure that service) is “bought” by a (minimum of one) ecosystem service buyer from a (minimum of one) ecosystem
service provider; if and only if the service provider secures ecosystem service provision (conditionality)”. This widely
quoted definition highlights the five requirements of PES: (a) voluntary transaction, (b) well-defined ecosystem
service that is traded, (c) ecosystem service buyer, (d) ecosystem service seller or natural resource custodian, and
(e) payment conditional upon provision of ecosystem service or land use practice. By creating a market for the
concerned ecosystem service, PES is primarily implemented with respect to a particular goal such as protection
or management of natural resources of national importance, or to address depletion in resources noticed by at
least one stakeholder g roup27. As long as the benefit is greater than the cost of conservation, support of local
communities and other stakeholders for such initiatives will not be compromised28.
In the present study, we assessed HWC and its drivers in the corridor linking the Rajaji and Corbett Tiger
Reserves (TRs) located in the foothills of Western Himalayas, along with the cost incurred due to crop raiding
and livestock depredation. We also evaluated the monetary contribution of the forest resources to the economy of
forest-dependent communities. To promote coexistence of humans and wildlife, we designed an incentive-based
mechanism on the principles of PES to make people proactive in conservation actions.
Results
Household (hh) characteristics. Of the total households sampled (n = 757), 52% were male and 48% were
female. The households had an average family size of 5.2 ± 0.08 individuals hh−1, with an average landholding of
1.00 ± 0.07 ha hh−1. Households in the hills had a comparatively smaller average family size (4.8 ± 0.1 hh−1) and
landholding (0.38 ± 0.04 ha hh−1) than the plains (Table 1). Only 17% of the household members were illiterate
while the rest had received a formal education up to the eighth grade or more (Table 1). Comparatively, more
people in the plains were educated up to the eighth grade or more than in the hills (Table 1). Households used
a combination of wood, liquefied petroleum gas (LPG), kerosene, biogas and cow dung cakes, and only 20% of
the households were solely dependent on wood for fuel (Table S1). Wood was the major source of fuel for 90.6%
of the households (98.19% in hills; 88.4% in plains) and was supplemented by LPG (67.7%) and others sources
(Table 1). The proportion of households using LPG was higher in the plains (72%) (Table 1). The average con-
sumption of LPG per household was 0.9 ± 0.03 cylinders per month; lower in the hills (0.21 ± 0.02 cylinders per
month) than in the plains (0.8 ± 0.04 cylinders per month).
54.3% of the households relied on a single source of livelihood, 36.5% relied on two sources and 7.4% were
engaged in more than two sources (Fig. S1, Table S2). Agriculture was the mainstay of 70% of the house-
holds with crop cultivation providing an income of US $ 881.51 ± 19.0 year−1. Most of the households (85.4%)
supplemented their income by rearing livestock. The average livestock owned per household was 5.25 ± 0.18,
which provided an income of US $ 95.9 ± 17.5 year−1. Households also earned their livelihood through private
jobs (14%), labour (14%), pension in case of retired government employees (8.9%), business (8.5%), govern-
ment jobs (8.5%), and horticulture (0.09%). Off-farm activities provided an average annual income of US $
1958.57 ± 93.3 year−1. The average total income of household from all the sources (excluding forest resources
income) was US $ 2763.91 ± 377.8 year−1 (Table 1).
Households practising agriculture (91.5%) and rearing livestock (94.5%) was higher in the hills than the plains
(Table 1). Households in the hills mainly grew finger millet or ragi (Eleusine coracana) and vegetables, while
wheat (Triticum spp.), rice (Oryza sativa) and sugarcane (Saccharum officinarum) were the main crops grown in
the plains. The average number of livestock owned in the hills and plains was 4.58 ± 0.34 hh−1 and 5.43 ± 0.21 hh−1,
respectively. The average income generated from crop cultivation and livestock rearing was lower in hills than
the plains. The average income (excluding forest resources) of the households was comparably lower in the hills
(US $ 1980.67 ± 176.0 hh−1 year−1) than in the plains (US $ 2983.92 ± 484.6 hh−1 year−1; Table 1).
Scientific Reports | (2021) 11:5235 | https://doi.org/10.1038/s41598-021-84119-7 2
Vol:.(1234567890)www.nature.com/scientificreports/
Household details
Characteristic Hill Plain Overall
Number of villages sampled 14 23 37
Number of households sampled 166 591 757
Household size 4.8 ± 0.1 5.29 ± 0.10 5.2 ± 0.08
Sex ratio (male:female) 1:0.88 1:0.85 1:0.85
Average age of respondents 33.14 30 30.72
Respondent education (%)
Illiterate 50.9 20.3 17.0
Less than 8th grade 10.5 16.9 19.8
8th grade to 12th grade 35.0 48.1 50.3
Graduate 1.4 8.0 6.7
Postgraduate 2.2 6.8 6.1
Average landholding (ha hh−1) 0.38 ± 0.04 1.17 ± 0.95 1.00 ± 0.07
Source of fuel (%)
LPG* 52.4 (26.6) 72.0 (41.5) 67.7
Kerosene* 42.7 (21.7) 6.2 (3.6) 14.2
Dung* 0.0 2.4 (1.3) 1.8
Wood* 98.1 (50.0) 88.4 (50.9) 90.6
Biogas* 3.0 (1.5) 4.4 (2.5) 4.0
Households practicing agriculture 152 (91.5%) 382 (64.4%) 534 (70.5%)
Annual income from crops (US $) 212.29 ± 36.1 1069.37 ± 588.5 881.51 ± 19.0
Households with livestock 157 (94.5%) 490 (82.9%) 647 (85.4%)
Average livestock (hh−1) 4.58 ± 0.34 5.43 ± 0.21 5.25 ± 0.18
Annual income from livestock (US $ hh−1) 55.78 ± 13.5 107.21 ± 22.8 95.93 ± 17.5
Annual income from off-farm sources (US $ hh−1) 1918.39 ± 171.0 1969.81 ± 109.5 1958.57 ± 93.3
Total annual income excluding forest contribution (US $ hh−1) 1980.67 ± 176.0 2983.92 ± 484.6 2763.91 ± 377.8
Table 1. Characteristics of respondents’ households in the forest corridor linking the Rajaji and Corbett Tiger
Reserves, Uttarakhand, India. (* values in parentheses indicate percentage of total households sampled).
Contribution of forest
Household dependent on forest Extraction (kg hh−1 year−1) Benefit (US $ h
h−1 year−1) product (% hh−1 year−1)
resources (%) Mean ± S.E Mean ± S.E Mean ± S.E
Resource Hills* Plains* Overall Hills Plains Overall Hills Plains Overall Hills Plains Overall
Fuelwood 90.4 (19.8) 64.6 (50.5) 70.4 2304 ± 106 1433 ± 176 1678.7 ± 131 122 ± 5.6 76 ± 9 89 ± 7 6 ± 0.7 3 ± 0.7 3±1
Fodder 85.5 (18.7) 11.2 (8.7) 27.5 4904 ± 233 4486 ± 302 4772 ± 186 259 ± 12 237 ± 16 252 ± 10 9 ± 0.3 4 ± 0.1 6 ± 0.5
Grass 68.1 (14.9) 6.1 (4.7) 19.7 3705 ± 87 2273 ± 266 3359 ± 104 196 ± 5 120 ± 14 177 ± 5 12 ± 0.7 8 ± 0.3 9±1
Table 2. Benefits derived from the forest corridor linking the Rajaji and Corbett Tiger Reserves, Uttarakhand,
India. (* values in parentheses indicate percentage of total households sampled)
Benefits of living around the corridor. Of the households surveyed, 84% supplemented their livelihood
from forest resources viz., fuelwood (70.4%), fodder (27.5%) and green/dry grass (19.7%). Comparatively, a higher
proportion of households in the hills (96%) were dependent on forest resources than the plains (80%). Extrac-
tion of forest products, specifically fuelwood (1678.7 ± 131 kg hh−1 year−1), fodder (4772 ± 186 kg hh−1 year−1)
and green/dry grass (3359 ± 104 kg hh−1 year−1), contributed 3 ± 1%, 6 ± 0.5% and 9 ± 1%, respectively, to the
average annual household income (Table 2). The contribution of forest products to the household income ranged
from 6 ± 0.7% (fuelwood) to 12 ± 0.7% (grass) in the hills, and 3 ± 0.7 % (fuelwood) to 8 ± 0.3% (grass) in the
plains (Table 2).
Conflict and cost of living around the corridor. Around 69% of the households practicing agriculture
(n = 534) reported crop damage by wildlife (Table 3). Incidents of crop raiding were higher in the hills (94.7%)
than in the plains (Table 3). A total of 15 species of wildlife, comprising of eight herbivores, two primates, three
birds, one lagomorph and one rodent, were reportedly involved in crop damage. More than half of the respond-
ents reported that wild pig (31.2%) and Asian elephant (30.1%) were the most problematic species in the region
(Fig. 1). Rice fields were raided the most (0.44 ± 0.02 ha hh−1), along with wheat (0.09 ± 0.02 ha hh−1) and sugar-
cane (0.004 ± 0.00 ha hh−1; Table S4).
Scientific Reports | (2021) 11:5235 | https://doi.org/10.1038/s41598-021-84119-7 3
Vol.:(0123456789)www.nature.com/scientificreports/
Costs incurred Hills Plains Overall
Households practicing agriculture 152 382 534
Households owning livestock 157 490 647
Households that reported crop raiding 144 (94.74%) 224 (58.64%) 368 (68.91%)
Households that reported livestock depredation 29 (18.47%) 94 (19.18%) 123 (19.01%)
Losses from crop raiding (US $ hh−1 year−1) 69 ± 9.7 325.91 ± 29.5 159.83 ± 1.0
Losses from livestock depredation (US $ hh−1 year−1) 112.89 ± 21.9 174.31 ± 44.3 229.32 ± 34.0
Total losses due to crops raiding and livestock depredation (US $ hh−1 year−1) 77.11 ± 9.4 352.78 ± 27.5 257.62 ± 18.9
Total losses (% of total income) 3.61 11.61 9.07
Table 3. Cost incurred due to wildlife around the forest corridor linking the Rajaji and Corbett Tiger
Reserves, Uttarakhand, India. (* values in parentheses indicate percentage of total households sampled)
Figure 1. Percentage of respondent reported wild animals involved in crop raiding around the forest corridor
linking the Rajaji and Corbett Tiger Reserves, Uttarakhand, India.
Figure 2. Percentage of respondent reported depredation of different livestock types, including dogs, around
the forest corridor linking the Rajaji and Corbett Tiger Reserves, Uttarakhand, India.
Around 19% of the households that owned livestock (n = 647) reported livestock depredation, of which 81.4%
attributed the incidents to leopards and 17.1% to tigers. Calves (42.1%) and adult cows (34%) were the victims of
these large carnivores most frequently (Fig. 2). Livestock depredation mostly occurred inside the forest (75%),
while about 25% occurred in residential areas. The incidents of livestock depredation was almost equal in the
hills and the plains (Table 3). Cases of human injury/attacks (1.58% of hh) were also reported.
The respondents incurred average costs of US $ 159.83 ± 1.0 hh−1 year−1 and US $ 229.32 ± 34 hh−1 year−1 due
to crop raiding and livestock depredation, respectively (Table 3). The costs incurred due to crop raiding and
livestock depredation were greater in the plains (Table 3). The overall cost of wildlife conflict in the hills (US $
77.11 ± 9.4 hh−1 year−1) and plains (US $ 352.78 ± 27.5 hh−1 year−1) reduced the income of the respondents by 3.6%
and 11.6%, respectively (Table 3). All hotspots of conflict were located in the western and central-southern part
of the corridor, with villages Judu and Aeta in the hills and villages Daalipur and Laldhang in the plains identified
Scientific Reports | (2021) 11:5235 | https://doi.org/10.1038/s41598-021-84119-7 4
Vol:.(1234567890)www.nature.com/scientificreports/
Figure 3. Villages identified as conflict hotspots based on average cost incurred (US $ h
h−1 year−1) due to
livestock depredation and crop raiding around the forest corridor linking the Rajaji and Corbett Tiger Reserves,
Uttarakhand, India. Land cover used was downloaded from Diva-Gis (http://www.diva-gis.org/gdata). The map
was created using ArcGIS v.10.3.1 software developed by ESRI (https://www.esri.com).
as hotspots for livestock depredation, and villages Rasoolpur, Meethiberi, Katiawar, Bhuvdevpur, Jaydevpur,
Daalipur and Motadhak in the plains identified as hotspots for crop raiding (Figs. 3, S2, S3).
Factors governing human–wildlife conflict. The receiver operating characteristic (ROC) curves for
crop raiding and livestock depredation were 0.82 ± 0.01 (95%) and 0.73 ± 0.02 (95%), respectively, indicating
good fits of regression. Crop loss was positively associated with number of crops grown per season and cultiva-
tion of sugarcane, wheat and pulses, while the association was negative with distance from the forest and cultiva-
tion of fodder and finger millet (Table 4). The likelihood that livestock depredation will occur increased with
increasing number of indigenous buffaloes and calves (Table 4).
People’s attitude towards wildlife conservation. In spite of HWC, 68.8% of respondents showed a
positive attitude towards wildlife conservation, while 15.7% had a negative attitude, and the rest (15.5%) were
indifferent. Higher percentage of male respondents (77.3%), people living farther (> 2 km) from the periphery
of the forest corridor (76%), people living in the plains (61.9%), old people (59.1%), people not involved in agri-
culture (59.6%), people without livestock (57.5%) and people not extracting resources from the forest (67.7%)
exhibited a positive attitude towards wildlife conservation (Fig. 4). The likelihood that a person will show a
positive attitude towards wildlife conservation decreased if he or she resided in the hills and if there was more
wildlife (Table 4).
Payments to encourage coexistence (PEC). The annual accounting profit from cultivating a hectare of
land, in the absence of crop depredation by wild animals, was estimated at US $ 3571.84 ha−1 for the plains and
US $ 361.44 ha−1 for the hills. The net present value (NPV) of the benefits to the local communities from partici-
pating in the PEC programme for 5 years, discounted at 12%, is US $ 12,875.7 ha−1 and US $ 1302.9 ha−1, for the
plains and the hills, respectively, which is the profit from not cultivating a hectare of land (Table 5). The account-
ing profit and NPV is calculated on a per-hectare basis; therefore, the amount payable will be proportionate to
Scientific Reports | (2021) 11:5235 | https://doi.org/10.1038/s41598-021-84119-7 5
Vol.:(0123456789)www.nature.com/scientificreports/
Crop loss Livestock loss Attitude
Predictor B (S.E.) Wald B (S.E.) Wald B (S.E.) Wald
Constant − 0.128*** (0.091) 1.963 − 1.734*** (0.105) 271.06 0.218 (0.236) 0.855
Distance from forest − 0.411*** (0.097) 17.96
Wheat 0.457*** (0.114) 16.13
Finger millet (ragi) − 0.393** (0.137) 8.21
Fodder − 0.341** (0.099) 11.91
Sugarcane 0.244** (0.105) 5.41
Pulses 0.364** (0.100) 13.31
Number of crops cultivated 0.785*** (0.139) 32.09
Indigenous Buffalo 0.0.335*** (0.079) 17.71
Calf 0.417*** (0.097) 18.45
Increase in wildlife population − 0.479*** (0.153) 9.80
Location (plains) 0.866*** (0.182) 22.76
Chi square 6.33** 16.27 9.87
Log likelihood 772.612 616.57 997.84
Nagelkerke’s R2 0.406 0.089 0.054
Hosmer and Lemeshow test 0.44 0.00 0.243
ROC 0.826 ± 0.01 0.73 ± 0.02 0.62 ± 0.02
Table 4. Coefficients (β) for predicting crop damage, livestock depredation and positive attitude of local
communities towards wildlife around the forest corridor linking the Rajaji and Corbett Tiger Reserves,
Uttarakhand, India. *, ** and *** indicate significance at levels of 0.5, 0.01 and 0.001, respectively.
Figure 4. Attitude of people involved in different occupations around the forest corridor linking the Rajaji and
Corbett Tiger Reserves, Uttarakhand, India.
Discount rate (%) Plains (US $ h
a−1) Hills (US $ h
a−1)
0 17,859.25 1807.25
5 15,464.2 1564.9
10 13,540.15 1370.2
12 12,875.7 1302.9
15 11,973.4 1211.6
Table 5. Net present value of the benefits to the local communities from participating in the payments to
encourage coexistence programme for 5 years. @ 2014 prices.
the land cultivated by a particular household. The incentives are proposed to be paid to the farmers for the land
on which they abstain from all forms of agricultural practices for a duration of 5 years.
The profit from not cultivating the land and participating in the programme will be greater than the profit
from cultivating, since the payment made to the farmers will cover the costs incurred due to crop damage as the
estimated NPV is the profit earned without crop depredation by wild animals. Furthermore, there are hidden
Scientific Reports | (2021) 11:5235 | https://doi.org/10.1038/s41598-021-84119-7 6
Vol:.(1234567890)www.nature.com/scientificreports/
costs of HWC, such as increased food insecurity, risk of injury and death from guarding, psychological and social
costs20,29,30, which can be avoided under the proposed programme.
Discussion
The Terai-Arc Landscape (TAL) in the foothills of the Himalaya, is among the 200 globally important eco-regions
in the w orld31. It’s a transboundary landscape encompassing an area of 49,500 km2 between River Yamuna in
the west and River Bhagmati in the east, in India and Nepal, respectively. Around 15 PAs exist in the landscape
including five TRs viz., Rajaji, Corbett, Pilibhit, Dudhwa and Valmiki (west to east), in the Indian part of the
landscape. This landscape provides shelter to several species of conservation concern viz., tiger (Panthera tigris),
leopard (Panthera leo), sloth bear (Melursus ursinus), Himalayan black bear (Ursus thibetanus), Asian elephant
(Elaphus maximus), greater one-horned rhinoceros (Rhinoceros unicornis), Himalayan serow (Capricornis suma-
traensis) and hog deer (Axis porcinus). The Rajaji and Corbett TRs in the western Himalayan foothills support
a tiger population that is genetically distinct from the tigers in Valmiki TR, located in the eastern region of the
landscape32. Apart from tiger, this region supports a population of ~ 2040 elephants distributed in six isolated
populations12,33. The Rajaji–Corbett forest corridor is vital for the free movement and exchange of genetic mate-
rial between the western and eastern part of the foothills in India and Nepal. Additionally, this forest corridor
provides an array of ecosystem services integral to the wellbeing of local communities7. Thus, intactness of the
corridor is crucial for maintaining the gene pool and for the wellbeing of the local communities residing in this
landscape.
For the rural communities residing in and around this corridor, the forest has remained a major source of
fuelwood, fodder and food, for both sustenance and income g eneration6. The overall extraction of forest resources
has increased in comparison with the findings of an earlier study around the corridor6. This could be attributed
to the increase in human population in the area, since the consumption of forest biomass per household has
reduced due to the availability of alternative energy sources, namely LPG and kerosene. A large proportion of
households (70%) in the hills is still dependent on the forest for fuelwood, perhaps due to habitual or traditional
dependence on the forest for b iomass6 combined with lack of alternatives or difficulty in accessing modern and
efficient resources. The contribution of forest resources to the household income was greater in the hills than
in the plains.
Our study showed that HWC is a serious issue around this forest corridor. Among the crop raiders, Asian
elephants and wild pigs were reported as the main problematic species in the area affecting the household income
considerably. In almost all the elephant-range countries where elephants survive in fragmented and disturbed
habitats, crop raiding has been r eported34–37. Crop raiding by animals may be due to a higher sugar content,
and lower fibre and secondary defensive chemicals content in crops compared to their wild c ounterparts38.
Elephants have a natural preference for derivatives of plants from the family Gramineae, including wheat and
rice39. Moreover, wild pigs can dig burrows and screen themselves from guards in crops such as sugarcane and
maize, which grow to heights of more than 2 m40.
Most of the respondents reported that the cases of livestock depredation occurred in the forest while grazing.
The attacks on livestock may also be due to the high density of livestock around the forest corridor. Sangay and
Vernes41 also identified leopard as the major predator of livestock in human-dominated landscapes. Leopards
preyed more on calves, cows and goats compared to other livestock. Patterson et al.42 speculated that body size
and availability of prey species govern the selection of prey species. Leopards, weighing 30–40 kg, take prey in
the weight range of 25–50 kg43; leopards in India take prey generally weighing less than 50 kg44. Our results
match the trends of these studies, which were conducted in the wild. Calves, being small and weighing less than
25 kg, may be easy prey for leopards in the forest. Human injuries or deaths mostly occurred as a result of chance
encounters with elephants or leopards.
Our results mirror findings of other s tudies45–47 where likelihood of crop damage was negatively associated
with the distance from the forest, and positively associated with cultivation of wheat, sugarcane and pulses, and
number of crops cultivated. Likelihood of livestock loss was positively associated with the presence of calves and
indigenous buffaloes. We found that crop loss and livestock loss are functions of multiple f actors45–47.
People residing in plains supported wildlife conservation, similar to the findings of B adola7, which may be
credited to the high literacy rate and availability of alternative livelihoods. However, the people in the hills were
not very positive towards wildlife conservation, which may be due to their higher dependence on agriculture
and some recent and frequent incidents of crop damage and livestock attacks. Our results revealed that support
for wildlife conservation by the people decreased with increase in wildlife population.
The positive attitude of the people towards wildlife conservation might alter in the future when the continuous
and increased losses to their crops and livestock become excessive, which may be calamitous to the conservation
of the corridor. Physical barriers like electric fencing and brick or stone walls have proven to be ineffective in the
study area, since the electric fence and stone or brick walls were broken by elephants, and the local communities
were unable to maintain it as it was physically, socially and economically taxing. Additionally, guarding crops
against elephants has a high risk of human injury or casualty. Compensations offered for damage incurred are
insufficient and subject to processing delays and corruption18. Furthermore, the people suffering losses due
to HWC refrain from filing the claim due to the high transaction cost (physical, economic and social) that is
incurred in the form of documentation, multiple visits to government offices, procedural delays etc.48. Insurance
schemes are subject to issues of moral hazard, adverse selection and fraudulent claims due to difficulties associ-
ated with verification of damage and investment in damage avoidance49. Given the socioeconomic profile of the
local communities, there is a high risk of running out of pooled funds in case of multiple claims, making micro
insurance schemes unviable. An effective and sustainable HWC mitigation strategy must address issues of both
biodiversity conservation and poverty alleviation.
Scientific Reports | (2021) 11:5235 | https://doi.org/10.1038/s41598-021-84119-7 7
Vol.:(0123456789)www.nature.com/scientificreports/
The proposed incentive-based mitigation strategy viz., payments to encourage coexistence (PEC), is based
on the principles of PES wherein the custodians of an ecosystem are paid by the beneficiaries of the ecosystem
services, and the payment is conditional on the supply of the ecosystem services or the adoption of certain man-
agement practices that are subject to monitoring under the terms of the contract. PES has been implemented
across the globe to incentivize landowners to encourage land management practices that promote environment
conservation and enhance the flow of select ecosystem services, with varying degrees of success. Grima et al.50
analysed the performance of 40 PES programmes associated with provision of water in Latin America, and clas-
sified 23 cases as successful and 12 as partially successful. The Produtor de Água and Conservador das Água
watershed PES programmes, implemented in the Brazilian Atlantic forest to improve water quality and quantity
in the Cantareira water supply system through soil and water conservation activities, has resulted in an addi-
tional 2.8–5.6% of farm area coverage under Atlantic forest over a 5-year period through forest regeneration51.
The ‘Grain for Green’ programme has led to the establishment of 29.1 × 10⁶ ha of forest in 25 provinces in China
through conservation of natural forest, afforestation of farmland and degraded land, and establishment of fruit
tree plantations52. Tuanmu et al.53 examined the impact of the Natural Forest Conservation Program in China on
giant panda habitat in Wolong Nature Reserve and noted that areas monitored by local residents showed greater
improvement in habitat compared to areas monitored by the local government, provided they are adequately paid.
Under the proposed PEC programme, financial assistance will be given to local communities to encourage
coexistence with wildlife by mitigating HWC through behaviour change and opportunities to explore alternate
livelihoods, in order to ensure the functionality of the forest corridor. The intended beneficiaries are the farmers
who will be paid for not cultivating on their land for a trial period of 5 years; thus, tackling crop depredation by
wild animals. The farmers will be encouraged to enter into contract with the herders, under which their live-
stock can graze on the now uncultivated land for a mutually agreed upon amount. This will mitigate livestock
depredation by reducing the entry of cattle into forests, where majority of the incidents of livestock depredation
were reported. The PEC programme not only addresses the visible costs of HWC but also the invisible costs, and
avoids the distress associated with relocation.
The proposed incentive mechanism has elements of both compensation schemes and alternate livelihood
strategy for HWC mitigation. Since the farmers in the region are mainly marginal farmers practicing subsistence
agriculture, coupled with the fact that income from off-farm sources was considerably higher than from crop
cultivation, the proposed PEC programme will increase the income of participating households not only through
direct monetary transfer, but also through promotion of off-farm labour participation by relaxing liquidity
constraints. An increase in off-farm labour participation was noted in China as a result of the ‘Grain for Green’
programme, especially among the poor, young and more educated sections of the participating households54.
Wildlife-based tourism is a possible off-farm source of livelihood that can be explored by the local communi-
ties residing in the vicinity of the forest corridor; since, the region has immense potential for wildlife-based
tourism given its close proximity to two PAs viz., Rajaji and Corbett TRs. With the development of appropriate
tourism infrastructure in the region, backed by the Government of Uttarakhand’s tourism policy initiatives,
wildlife-based tourism can be a lucrative business and add to the capital stock of the participating households.
The wildlife tourism-based PES programme implemented in the Olare Orok Conservancy in Maasai Mara,
Kenya, wherein pastoral landowners were voluntarily relocated and asked to stop livestock grazing inside the
conservancy (reserved for wildlife tourism) in exchange for direct monetary payments by private tourism opera-
tors, resulted in an increase in the physical, human and social capital of participating households, through cash
income diversification, creation of employment opportunities in the conservancy, and prevention of poverty by
serving as a buffer during climate shocks55.
Barriers to the adoption of such programmes include a lack of awareness among the farmers, mistrust of the
forest department and lack of f unding56. Custodians may also not appreciate the importance of the programme’s
conditionality, which in the present case is the need to refrain from agriculture to continue receiving the pay-
ments. Such obstacles, however, are common to all incentive-based s chemes57. The PEC programme must be
supported with a targeted public outreach campaign, establishment of linkages with the concerned Government
departments and agencies, and capacity building of the intended beneficiaries to enable them to access the ben-
efits of the programme. In order to ensure compliance, the study area must be monitored by the Uttarakhand
Forest Department, under whom the management of the forest falls, including an annual evaluation of the
programme. In order to improve the efficacy of the PEC programme, monitoring duties should also be assigned
to locals, from both participating and non-participating households, because an incentive-based strategy that
complements not only a command-and-control strategy, but also community- and norm-based strategies has
the potential to achieve a higher degree of conservation effectiveness and HWC m itigation53. In the Periyar TR,
India, an all-women forest patrolling team, known as the “Vasantha Sena”, voluntarily patrol the forest in groups
of six to eight during the day, from 11 a.m. to 5 p.m., with their presence serving as a deterrent to illegal entry
and biomass e xtraction58. The centrally sponsored ‘Integrated Development of Wildlife Habitats’ scheme that
provides assistance to State/Union Territories for the conservation of wildlife and its habitats, inside and outside
protected areas, can be a source of funding for the proposed programme59. Sustainable, timely and continuous
economic benefits accruing to the community will change their attitude and increase the tolerance exhibited
towards wildlife60,61. Furthermore, these measures should be combined with additional interventions in the form
of policy actions in other sectors that are aimed at reversing the current dynamics of crop intensification and
urban encroachment; since, agriculture in the region has become more commercial, and agricultural land has
been converted into commercial or residential a reas33.
The proposed incentive-based mitigation strategy is a pragmatic and practical means to engage local com-
munities in wildlife conservation, which is a major challenge in heavily populated developing countries like
India62. Due to the replicability and scalability of the model, the proposed PEC programme can be implemented
in the fringes of PAs and wildlife corridors, in order to create a larger model of community engagement for
Scientific Reports | (2021) 11:5235 | https://doi.org/10.1038/s41598-021-84119-7 8
Vol:.(1234567890)www.nature.com/scientificreports/
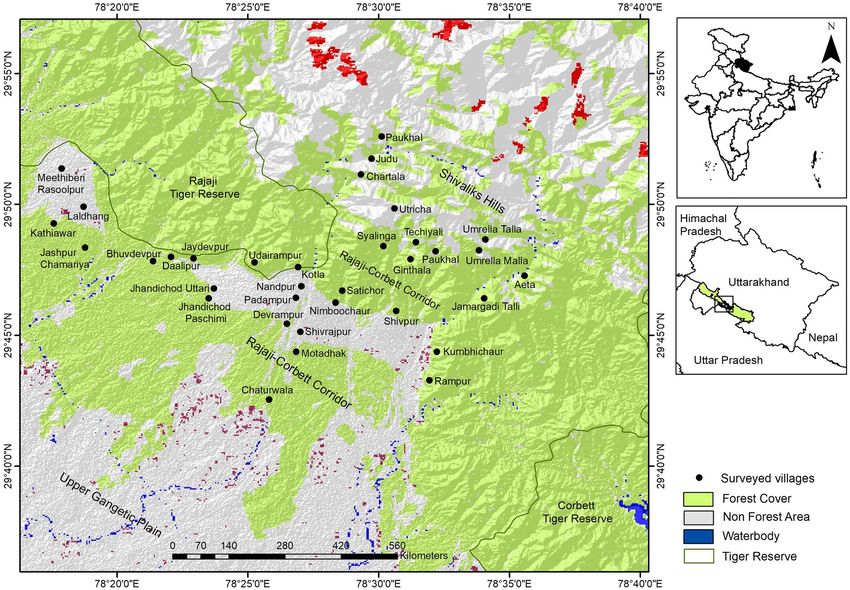
Figure 5. Map highlighting the forest corridor linking the Rajaji and Corbett Tiger Reserves, and the locations
of the sampled villages in Uttarakhand, India. Land cover used was downloaded from Diva-Gis (http://www.
diva-gis.org/gdata). The map was created using ArcGIS v.10.3.1 software developed by ESRI (https://www.esri.
com).
biodiversity conservation that views preservation and protection of crucial wildlife habitat at the landscape
level, rather than in pockets.
Materials and methods
Study area. The forest corridor linking the Rajaji and Corbett TRs (29° 37′ to 29° 53′ N and 78° 19′ to 78°
41′ E), located in the Indian state of Uttarakhand (Fig. 5), comprises of two smaller corridors—one through the
Shivalik Hills (Lansdowne Forest Division) and other through the forests of the Shivalik foothills (Haridwar
and Bijnore Forest Divisions). Due to its location along the foothills of the Himalayas, the topography is hilly,
with innumerable spurs and high ridges in the north. The southern portion of the corridor is characterized by
the Bhabar tract, which gradually merges with the Gangetic plains. The area has a sub-tropical climate, with
temperatures ranging between 7 and 42 °C and annual rainfall ranging between 1253 and 2053 mm, with the
maximum rainfall received between March and June. The tract is drained by numerous rivers and streams run-
ning from north to south, most of which are dry in late winter and summer.
The vegetation consists of northern tropical moist and dry deciduous forests with species such as Shorea
robusta, Mallotus philippensis, Kydia calycina, Dalbergia sissoo, Acacia catechu, Ougeinia oojeinensis and Ter-
minalia spp. The Rajaji–Corbett forest corridor maintains the genetic diversity of large mammals such as tiger
(Panthera tigris), leopard (Panthera pardus), Asian elephant (Elephas maximus), sloth bear (Melursus ursinus),
Himalayan black bear (Ursus thibetanus), sambar (Rusa unicolor) and o thers11. An increase in the number of
human settlements, coupled with agricultural expansion and commercial resource extraction from the corridor,
ildlife11,63. Geographically, the villages in the area can be divided
have reduced the area that was once available to w
into two groups viz., the northern hill villages and the southern plains villages. Terrace farming is prevalent in
the northern hilly region, where mostly women are the heads of households because the male members migrate
to the plains in search of employment. The southern villages are economically better off due to their nearness
to the urban centre of Kotdwar, productive agricultural land and more employment opportunities in industries
along the fringes of the t own6. The major communities inhabiting this area include (1) Garhwalis, hill residents
employed in both marginal agriculture and private jobs, (2) Boksas, a forest-dependent tribe who work as daily
labourers in nearby towns, (3) Gujjars, the transhumance pastoralists living inside the forest and engaged in
Scientific Reports | (2021) 11:5235 | https://doi.org/10.1038/s41598-021-84119-7 9
Vol.:(0123456789)www.nature.com/scientificreports/
cattle rearing, and (4) Bhotias, migratory grazers of Indo-Tibetan origin who visit the area in winter with herds
of goats and sheep.
Methodology. Villages within 5 km from the forest corridor were identified using a digitized map of the
study area. A total of 205 villages were identified, and data on the location and distribution of the villages (dis-
tance from the forest corridor), demographic profile, accessibility by motorable roads from urban areas, live-
stock owned, dependence on forest resources (timber, non-timber forest products like fuelwood, fodder etc.)
and accessibility to basic facilities such as primary health centres, schools, transportation and alternative fuel
resources like LPG was collected in the rapid rural appraisal format6,28. Village level data was also collected from
various government and non-government organizations. This village level information was subjected to princi-
pal component analysis as in Lee et al.64 and Badola et al.28, and results were used to perform hierarchical cluster
analysis, which divided the villages into three clusters. Representative villages from each cluster were selected.
A total of 757 households from 36 villages were surveyed and personal interviews with house representatives
were conducted using a semi-structured questionnaire with both open- and close-ended questions, between May
2013 and December 2014. Each interview lasted for about 45 minutes to 1 hour. Information about crop raiding,
livestock depredation (2012–2014) and human injuries/deaths caused by wildlife, as well as dependence on the
forest, occupational structure, agricultural holdings and livestock owned was gathered. Conflict locations in case
of livestock depredation and crop raiding were visited to validate the data pertaining to damage.
Ethics statement. The questionnaires and social surveys conducted in this study were duly approved by the
institutional review board (Training Research and Advisory Committee) of the Wildlife Institute of India (WII),
Dehradun, India, and were conducted in accordance with the guidelines and regulations of WII. Informed con-
sent was obtained from the heads of the community and the respondents who participated in this survey. Prior
to interviews, respondents were informed about the objectives of the survey and nature of questions. Respond-
ents were asked if the information provided by them can be used for any report or article in any form. Informed
consent of the respondents was also obtained to publish the obtained information/image(s) in an online open
access publication. The study did not involve experiments using any live or dead animal or human subjects and
therefore, did not require the approval of the animal ethics committee.
Data analysis. The data pertaining to socio-economic profile, conflict and attitude of local community was
summarised in the form of frequencies, proportions and measures of central tendency. The monetary benefit
and loss per household was calculated by multiplying with the market price of various forest resources extracted,
and livestock and crops lost. The economic loss resulting from deaths/injuries caused by wildlife was calculated
by aggregating the money spent on treatment and income lost due to injuries.
Factors governing human–wildlife conflict. Self-reported incidents of crop damage (n = 368) were
modelled as a function of environmental factors (distance from the forest), agricultural factors (number of crop
types grown in a year, crop types cultivated, size of the landholding reported), demographic characteristics
(family size, gender of the respondent, occupation) and use of mitigation measures. Logistic regression with
the forward conditional method was used in the modelling. Similarly, livestock depredation (2012–2014) was
modelled as a function of the distance from the forest and the number and type of livestock owned (Table S3).
The variables were tested for multi-collinearity before the logistic regression was run. All the analyses were con-
ducted using SPSS 16.0.
Payments to encourage coexistence. The incentive mechanism designed here is based on the concept
of PES, which is the best-suited approach for getting the support of local communities for c onservation24. Con-
servation payments involving HWC have been termed as “payments to encourage coexistence” (PEC) as such
payments do not always follow the strict criteria of PES although the overall concept complies with any PES
programme24.
Profit, defined in economic theory as the difference between the revenue earned and the cost incurred in the
production, is a function of the quantity produced, the price of the commodity produced and the cost of the
inputs65. Since the area is close to the forest, the fields are often raided by wild animals. This affects the quantity
produced and thus affects the profits. Hence, the profit earned from cultivating a particular piece of land can
be defined as:
= {YA [QA (I, CD), PA ], CI }
c
where, c is the profit earned from cultivating the land, YA is the income generated from cultivating the land,
QA is the quantity of agricultural produce, I is the inputs used, CD is the crop damage due to wildlife, PA is the
price of agricultural produce and C I is the cost of inputs used.
To accept a payment mechanism to abstain from cultivating a particular plot of land, the profit generated
from not cultivating must be greater than or at least equal to the profit generated from cultivating that plot of
land. The financial incentive should be designed such that
≥
NC C
where, is the profit from not cultivating the land.
NC
Scientific Reports | (2021) 11:5235 | https://doi.org/10.1038/s41598-021-84119-7 10
Vol:.(1234567890)www.nature.com/scientificreports/
In the current study, we estimated the annual payment to be paid to the local communities for not cultivating
in the conflict prone areas by calculating the accounting profit from cultivating a hectare of land in the absence
of crop depredation by wild animals, for the year in which the study was undertaken. Since, we are interested in
a programme that will show a positive outcome over a long period i.e., reduced HWC, the programme must be
implemented for at least 5 years21.
In order to estimate the benefits to the local communities from participating in the programme, the NPV of
the annual payment over 5 years was estimated, assuming no decline in the purchasing power of the Indian rupee
over the 5-year period and keeping the cash flow constant at the estimated accounting profit. NPV is considered
ideal for determining the benefits accrued to the local communities as it accounts for the time preference of
the communities, represented by the discount r ate66. A social discount rate of 12% has been set for projects and
public investments in I ndia67. Due to a lack of consensus and the policy implications of using such fixed discount
rates, we discounted the NPV using different discount rates to reflect the different time preferences of the people.
Higher the discount rate, higher is the presumed time preference for immediate costs and benefits, and lower is
the value placed on future benefits and costs.
The NPV is the present value of the expected net benefit over time. The NPV was estimated using the fol-
lowing equation:
5
YA − CI
NPV = ,
(1 + i)n
n=1
where, Y A is the income generated from cultivating the land, C I is the cost of inputs used, i is the discount rate,
n is the number of years (the duration of the trial period i.e., 5 years).
Under the proposed incentive mechanism, profit from not cultivating the concerned piece of land is defined
as:
= NPV.
NC
Received: 2 September 2020; Accepted: 4 February 2021
References
1. Avtar, R., Tripathi, S., Aggarwal, A. K. & Kumar, P. Population–Urbanization–Energy nexus: A review. Resources 8(3), 136 (2019).
2. Fahrig, L. Effects of habitat fragmentation on biodiversity. Annu. Rev. Ecol. Evol. S. 34, 487–515 (2003).
3. Macarthur, R. H. & Wilson, E. O. The theory of island biogeography (Princeton Univ Press, Princeton, 1967).
4. Levins, R. Some demographic and genetic consequences of environmental heterogeneity for biological control. Ann. Entomol. Soc.
Am. 15, 237–240 (1969).
5. Hobbs, R. J. The role of corridor in the conservation, solution or bandwagon?. Tree 7(11), 389–392 (1992).
6. Badola, R. Economic assessment of human–forest interrelationship in the forest corridor connecting the Rajaji and Corbett national
parks. Ph.D. Thesis, Jiwaji Univ, Gwalior (1997).
7. Badola, R. Attitudes of local people towards conservation and alternatives to forest resources: A case study from the lower Hima-
layas. Biodivers. Conserv. 7, 1245–1259 (1998).
8. MacDonald, M. A. The role of corridors in biodiversity conservation in production forest landscapes: A literature review. Tasforest
14, 41–52 (2003).
9. Ament, R., Callahan, R., McClure, M., Reuling, M. & Tabor, G. Wildlife Connectivity: Fundamentals for Conservation Action (Centre
for large landscape conservation, Bozeman, 2014).
10. Thompson, I., Mackey, B., McNulty, S. & Mosseler, A. Forest resilience, biodiversity, and climate change. A synthesis of the biodiver-
sity/resilience/stability relationship in forest ecosystems. Technical Series No. 43, Secretariat of the Convention on Biological Diversity,
Montreal. https://www.cbd.int/doc/publications/cbd-ts-43-en.pdf (2009).
11. Qureshi, Q., Saini, S., Basu, P., Gopal, R., Raza, R. & Jhala, Y. Connecting tiger populations for long-term conservation. National Tiger
Conservation Authority & Wildlife Institute of India, Dehradun. https://wii.gov.in/images/images/documents/connecting_tiger.pdf
(2014).
12. Menon, V. et al. Right of Passage: Elephant Corridors of India (Wildlife Trust of India, New Delhi, 2017).
13. Kumar, A., Bargali, H. S., David, A. & Edgaonkar, A. Pattern of crop raiding by wild ungulates and elephants in Ramnagar Forest
Division, Uttarakhand. Hum.-Wildl. Interact. 11(1), 41–49 (2017).
14. Bargali, H. S. & Ahmed, T. Pattern of livestock depredation by tiger (Panthera tigris) and leopard (Panthera pardus) in and around
Corbett Tiger Reserve, Uttarakhand, India. PLoS ONE 13(5), e0195612 (2018).
15. Nyhus, P. J. Human–wildlife conflict and coexistence. Annu. Rev. Environ. Resour. 41, 143–171 (2016).
16. Webber, A. D., Hill, C. M. & Reynolds, V. Assessing the failure of a community-based human–wildlife conflict mitigation project
in Budongo Forest Reserve, Uganda. Oryx 41(2), 177–184 (2007).
17. Athreya, V., Odden, M., Linnell, J. D. C. & Karanth, K. U. Translocation as a tool for mitigating conflict with leopards in human-
dominated landscapes of India. Conserv. Biol. 25(1), 133–141 (2010).
18. Ogra, M. & Badola, R. Compensating human–wildlife conflict in protected area communities: Ground-level perspectives from
Uttarakhand, India. Hum. Ecol. 36(5), 717–729 (2008).
19. Madhusudan, M. D. Living amidst large wildlife: Livestock and crop depredation by large mammals in the interior villages of
Bhadra Tiger Reserve, South India. Environ. Manage. 31(4), 466–475 (2003).
20. Barua, M., Bhagwat, S. A. & Jadhav, S. The hidden dimensions of human–wildlife conflict: Health impacts, opportunity and
transaction costs. Biol. Conserv. 157, 309–316 (2013).
21. Mishra, C. et al. The role of incentive programs in conserving the snow leopard. Conserv. Biol. 17(6), 1512–1520 (2003).
22. Pagiola, S. Payments for environmental services in Costa Rica. Ecol. Econ. 65(4), 712–724 (2008).
23. Naeem, B. S. et al. Get the science right when paying for nature’s services. Science 347(6227), 1206–1207 (2015).
24. Dickman, A. J., Macdonald, E. & Macdonald, D. W. A review of financial instruments to pay for predator conservation and encour-
age human–carnivore coexistence. Proc. Natl. Acad. Sci. USA 108(34), 13937–13944 (2011).
Scientific Reports | (2021) 11:5235 | https://doi.org/10.1038/s41598-021-84119-7 11
Vol.:(0123456789)www.nature.com/scientificreports/
25. Greiber, T. Payments for ecosystem services: Legal and institutional frameworks. IUCN Environmental Policy and Law Paper No. 78,
Gland, Switzerland. https://www.iucn.org/content/payments-ecosystem-services-legal-and-institutional-frameworks-2 (2009).
26. Wunder, S. Are direct payments for environmental services spelling doom for sustainable forest management in the tropics?. Ecol.
Soc. 11(2), 23 (2006).
27. Bishop, J. & Huberman, D. Ecosystems, economics and payment for ecosystem services in Global Biodiversity Finance: The case
for international payments for ecosystem services (eds. Bishop, J. & Hill, C.) 13-33. (Edward Elgar Publishing 2014).
28. Badola, R., Barthwal, S. & Hussain, S. A. Attitudes of local communities towards conservation of mangrove forests, a case study
from the east coast of India. Estuar. Coast. Shelf. S. 96, 188–196 (2012).
29. Ogra, M. V. Human–wildlife conflict and gender in protected area borderlands: A case study of costs, perceptions, and vulner-
abilities from Uttarakhand (Uttaranchal), India. Geoforum 39(3), 1408–1422 (2008).
30. Mackenzie, C. A. & Ahabyona, P. Elephants in the garden: Financial and social costs of crop raiding. Ecol. Econom. 75, 72–82
(2012).
31. Semwal, R. L. The Terai Arc Landscape in India: Securing protected areas in the face of Global Change. Forest and biodiversity conser-
vation programme, World Wide Fund for Nature- India, New Delhi. https://www.iucn.org/content/terai-arc-landscape-india-secur
ing-protected-areas-face-global-change (2005).
32. Kolipakam, V., Singh, S., Pant, B., Qureshi, Q. & Jhala, Y. V. Genetic structure of tigers (Panthera tigris tigris) in India and its
implications for conservation. Glob. Ecol. Conserv. 20, e00710 (2019).
33. Johnsingh, A. J. T. et al. Conservation Status of Tiger and Associated Species in the Terai Arc Landscape, India (Wildlife Institute of
India, Dehradun, 2004).
34. Santiapillai, C. & Widodo, S. R. Why do elephants raid crops in Sumatra. Gajah 11, 55–58 (1993).
35. Barnes, R. F. W. The conflict between humans and elephants in central African forests. Mamm. Rev. 26, 67–80 (1996).
36. Chaudhry, S., Veeraswami, G. G., Mazumdar, K. & Samal, P. K. Conflict identification and prioritization in proposed Tsangyang
Gyatso Biosphere Reserve, eastern Himalaya, India. J. Bombay Nat. Hist. Soc. 107(3), 189–197 (2010).
37. Sitati, N. W., Walpole, M. J. & Leader-Williams, N. Factors affecting susceptibility of farms to crop raiding by African elephants,
using a predictive model to mitigate conflict. J. Appl. Ecol. 42(6), 1175–1182 (2005).
38. Joel, M., Edward, A., Doreen, R. & Biryahwaho, B. Management of conservation based conflicts in South western Uganda. Draft
report prepared by Koalition on behalf of Eastern and Central Africa Programme for Agricultural Policy Analysis, Association for
Strengthening Agricultural Research in Eastern and Central Africa. https: //idl-bnc-idrc.dspace direc t.org/handle /10625/ 42466 (2005).
39. Roy, P. B. & Sah, R. Economic loss analysis of crop yield due to elephant raiding, a case study of Buxa Tiger Reserve (West), West
Bengal. J. Econ. Sustain. Dev. 3(10), 83–88 (2012).
40. Lahm, S. A nationwide survey of crop raiding by elephants and other species in Gabon. Pachyderm 21, 69–77 (1996).
41. Sangay, T. & Vernes, K. Human–wildlife conflict in Kingdom of Bhutan: Pattern of livestock predation by large mammalian car-
nivores. Biol. Conserv. 141, 1272–1282 (2008).
42. Patterson, B. D., Kasiki, S. M., Selempo, E. & Kays, R. W. Livestock predation by Lion (Panthera leo) and other carnivores on
ranches neighbouring Tsavo National Park, Kenya. Biol. Conserv. 119, 297–310 (2004).
43. Seidensticker, J. On the ecological separation between tiger and leopard. Biotropica 8, 225–234 (1976).
44. Johnsingh, A. J. T. Prey selection in three large sympatric carnivores in Bandipur. Mammalia 56, 517–526 (1992).
45. Karanth, K. K., Gopalaswamy, A. M., DeFries, R. & Ballal, N. Assessing patterns of human–wildlife conflicts and compensation
around a central Indian protected area. PLoS ONE 7(12), e50433 (2012).
46. Karanth, K. K., Naughton-Treves, L., DeFries, R. & Gopalaswamy, A. M. Living with wildlife and mitigating conflicts around three
Indian protected areas. Environ. Manage. 52(6), 1320–1332 (2013).
47. Gore, M. L., Knuth, B. A., Scherer, C. W. & Curtis, P. D. Evaluating a conservation investment designed to reduce human–wildlife
conflict. Conserv. Lett. 1, 136–145 (2008).
48. Karanth, K. K., Gupta, S. & Vanamamalai, A. Compensation payments, procedures and policies towards human-wildlife conflict
management: Insights from India. Biol. Conserv. 227, 383–389 (2018).
49. Nyhus, P. J., Osofsky, S. A., Ferraro, P., Madden, F., & Fischer, H. Bearing the costs of human-wildlife conflict: The challenges of
compensation schemes in People and Wildlife, Conflict or Co-existence? (eds. Woofroffe, R., Thirgood, S. & Rabinowitz, A.) 107–121
(Cambridge University Press, 2005).
50. Grima, N., Singh, S. J., Smetschka, B. & Ringhofer, L. Payment for Ecosystem Services (PES) in Latin America: Analysing the
performance of 40 case studies. Ecosyst. Serv. 17, 24–32 (2016).
51. Ruggiero, P. G., Metzger, J. P., Tambosi, L. R. & Nichols, E. Payment for ecosystem services programs in the Brazilian Atlantic
Forest: Effective but not enough. Land Use Policy 82, 283–291 (2019).
52. Xian, J., Xia, C. & Cao, S. Cost–benefit analysis for China’s Grain for Green Program. Ecol. Eng. 151, 105850 (2020).
53. Tuanmu, M. N. et al. Effects of payments for ecosystem services on wildlife habitat recovery. Conserv. Biol. 30(4), 827–835 (2016).
54. Uchida, E., Rozelle, S. & Xu, J. Conservation payments, liquidity constraints, and off-farm labor: Impact of the Grain-for-Green
Program on rural households in China. Am. J. Agric. 91(1), 70–86 (2009).
55. Osano, P. M. et al. Why keep lions instead of livestock? Assessing wildlife tourism-based payment for ecosystem services involving
herders in the Maasai Mara, Kenya. Nat. Resour. Forum 37(4), 242–256 (2013).
56. Ogra, M. Attitudes toward resolution of human–wildlife conflict among forest-dependent agriculturalists near Rajaji National
Park, India. Hum. Ecol. 37(2), 161–177 (2009).
57. Ghazoul, J., Butler, R. A., Mateo-Vega, J. & Koh, L. P. REDD: A reckoning of environment and development implications. Trends
Ecol. Evol. 25(7), 396–402 (2010).
58. Rajasekharan Pillai, K. & Suchintha, B. Women empowerment for biodiversity conservation through self help groups: A case from
Periyar Tiger Reserve, Kerala, India. Int. J. Agric. Resour. Gov. Ecol. 5(4), 338–355 (2006).
59. Planning Commission. Eleventh Five Year Plan 2007-12. Agriculture, Rural Development, Industry, Services and Physical Infrastruc-
ture. Volume-III. Planning Commission, Government of India (Oxford University Press, 2008).
60. Bulte, E. H., van Kooten, G. C., & Swanson, T. Economic incentives and wildlife conservation. 1-3 December. CITES, Geneva, Swit-
zerland. https://cites.org/sites/default/files/eng/prog/economics/CITES-draft6-final.pdf (2008).
61. Poudel, J., Munn, I. A. & Henderson, J. E. Economic contributions of wildlife watching recreation expenditures (2006 & 2011)
across the US south: An input–output analysis. J. Outdoor Recreat. Tour. 17, 93–99 (2017).
62. Andrade, G. S. M. & Rhodes, J. R. Protected areas and local communities: An inevitable partnership toward successful conserva-
tion strategies?. Ecol. Soc. 17, 14 (2012).
63. Babu, S., Singh, S., Goyal, S. P. & Shruti, M. Dynamics of Asian elephant habitat in Shivalik landscape and environs of Kalesar–
Rajaji–Corbett protected area network. Int. J. Ecol. Environ. Sci. 45(2), 191–203 (2019).
64. Lee, W. S., Jin, W. H. & Chung, H. A study of categorization and development strategy formulation for rural village districts in the
greenbelt released area. Int. J. Urban Sci. 15(2), 93–106 (2011).
65. Varian, H. R. Intermediate Microeconomics, A Modern Approach 8th edn. (W.W. Norton & Company Inc., New York, 2010).
66. Chen, Z. M. et al. Net ecosystem services value of wetland, environmental economic account. Commun. Nonlinear Sci. 14(6),
2837–2843 (2009).
67. Asian Development Bank. Cost-Benefit Analysis for Development: A Practical Guide. (Asian Development Bank, 2013). https://
www.adb.org/documents/cost-benefi t-analysis-development-practical-guide.
Scientific Reports | (2021) 11:5235 | https://doi.org/10.1038/s41598-021-84119-7 12
Vol:.(1234567890)You can also read