Analysis and Evaluation of Non-Pharmaceutical Interventions on Prevention and Control of COVID-19: A Case Study of Wuhan City - MDPI

Page created by Cody Carpenter
 
CONTINUE READING
Analysis and Evaluation of Non-Pharmaceutical Interventions on Prevention and Control of COVID-19: A Case Study of Wuhan City - MDPI
International Journal of
              Geo-Information

Article
Analysis and Evaluation of Non-Pharmaceutical Interventions
on Prevention and Control of COVID-19: A Case Study of
Wuhan City
Wen Cao * , Haoran Dai, Jingwen Zhu, Yuzhen Tian and Feilin Peng

                                          School of Geoscience and Technology, Zhengzhou University, Zhengzhou 450001, China;
                                          zzu_giserran@gs.zzu.edu.cn (H.D.); 202012562017401@gs.zzu.edu.cn (J.Z.); 202012562017395@gs.zzu.edu.cn (Y.T.);
                                          zzdx_gispeng@gs.zzu.edu.cn (F.P.)
                                          * Correspondence: zzdx_edifier@zzu.edu.cn

                                          Abstract: As the threat of COVID-19 increases, many countries have carried out various non-
                                          pharmaceutical interventions. Although many studies have evaluated the impact of these interven-
                                          tions, there is a lack of mapping between model parameters and actual geographic areas. In this
                                          study, a non-pharmaceutical intervention model of COVID-19 based on a discrete grid is proposed
                                          from the perspective of geography. This model can provide more direct and effective information
                                          for the formulation of prevention and control policies. First, a multi-level grid was introduced to
                                          divide the geographical space, and the properties of the grid boundary were used to describe the
                                quarantine status and intensity in these different spaces; this was also combined with the model of
         
                                          hospital isolation and self-protection. Then, a process for the spatiotemporal evolution of the early
Citation: Cao, W.; Dai, H.; Zhu, J.;
                                          COVID-19 spread is proposed that integrated the characteristics of residents’ daily activities. Finally,
Tian, Y.; Peng, F. Analysis and
                                          the effect of the interventions was quantitatively analyzed by the dynamic transmission model of
Evaluation of Non-Pharmaceutical
                                          COVID-19. The results showed that quarantining is the most effective intervention, especially for
Interventions on Prevention and
Control of COVID-19: A Case Study
                                          infectious diseases with a high infectivity. The introduction of a quarantine could effectively reduce
of Wuhan City. ISPRS Int. J. Geo-Inf.     the number of infected humans, advance the peak of the maximum infected number of people, and
2021, 10, 480. https://doi.org/           shorten the duration of the pandemic. However, quarantines only function properly when employed
10.3390/ijgi10070480                      at sufficient intensity; hospital isolation and self-protection measures can effectively slow the spread
                                          of COVID-19, thus providing more time for the relevant departments to prepare, but an outbreak
Academic Editors: Maria                   will occur again when the hospital reaches full capacity. Moreover, medical resources should be
Antonia Brovelli, Songnian Li,            concentrated in places where there is the most urgent need under a strict quarantine measure.
Timur Obukhov and Wolfgang Kainz

                                          Keywords: COVID-19; epidemiological model; non-pharmaceutical interventions; spatiotemporal
Received: 20 May 2021
                                          spread model of COVID-19
Accepted: 9 July 2021
Published: 12 July 2021

Publisher’s Note: MDPI stays neutral
                                          1. Introduction
with regard to jurisdictional claims in
published maps and institutional affil-        In December 2019, the coronavirus disease 2019 (COVID-19) spread across the world.
iations.                                  Due to its characteristics of a high infection rate, incubation period, and asymptomatic
                                          infection, the virus quickly spread among the population, coming as an unprecedented
                                          blow to human life, economic development, and social stability [1–4]. In the absence of an
                                          effective vaccine, countries had to implement effective interventions as soon as possible to
                                          alleviate the spread of COVID-19, such as strict quarantine measures, wearing facemasks,
Copyright: © 2021 by the authors.
Licensee MDPI, Basel, Switzerland.
                                          school closures, and large-scale testing [5]. However, the unknown and sudden nature of
This article is an open access article
                                          the virus made it difficult for countries to implement scientific and reasonable emergency
distributed under the terms and           policies as early as possible. Meanwhile, the large-scale personnel deployment and resource
conditions of the Creative Commons        distribution, as well as the implementation of the policy plan, also require a long period
Attribution (CC BY) license (https://     of preparation. Therefore, the implementation scope, implementation scale, intervention
creativecommons.org/licenses/by/          time, and potential effect of prevention and control measures are key factors that need to
4.0/).                                    be decided upon urgently for all countries suffering from different degrees of the spread

ISPRS Int. J. Geo-Inf. 2021, 10, 480. https://doi.org/10.3390/ijgi10070480                                        https://www.mdpi.com/journal/ijgi
Analysis and Evaluation of Non-Pharmaceutical Interventions on Prevention and Control of COVID-19: A Case Study of Wuhan City - MDPI
ISPRS Int. J. Geo-Inf. 2021, 10, 480                                                                                             2 of 27

                                       of COVID-19. Making these decisions quickly will provide important support for the
                                       implementation of scientific and effective prevention and control measures.
                                             Early studies carried out on COVID-19 mainly focused on epidemiology, which can
                                       be roughly divided into three aspects: the estimation of the epidemiology parameters, the
                                       forecasting of the epidemic situation, and the analysis of the effectiveness of intervention
                                       measures. In the early stages of the outbreak of COVID-19, the basic reproduction number,
                                       incubation period, and other epidemic parameters were estimated using the early reported
                                       case data and overseas export data, which was helpful for understanding the dynamic
                                       transmission mechanism of COVID-19 while preliminarily assessing the epidemic risk
                                       level [6–10]. Subsequently, the future epidemic situation was predicted by fitting the re-
                                       ported case data based on improved compartmental models. For example, the susceptible,
                                       exposed, infected, quarantined, recovered (SEIQR); the susceptible, infected, removed-X
                                       (SIR-X); and the susceptible, infectious, quarantined, recovered (SIQR) models were pro-
                                       posed [11–13]; a zonal susceptible, exposed, infected, recovered, deceased (SEIRD) model
                                       combining the spatial diffusion and heterogeneity of infectious diseases was proposed [14];
                                       and the susceptible, exposed, infectious, recovered, susceptible (SEIRS) model with an
                                       exponential structure was proposed [15]. Similarly, new dynamic transmission models of
                                       infectious disease were developed by adding asymptomatic infectors and environmental
                                       infection to the susceptible, exposed, infectious, recovered (SEIR) model [16–20]. Some
                                       stochastic-based regression models were used to forecast the phenomena in as many as ten
                                       of the most affected states of Brazil [21]. A hybrid ARIMA-WBF model was considered
                                       for forecasting different COVID-19-infected countries worldwide [22] and a three-stage
                                       exposed, infected, susceptible, hospital, recovered (e-ISHR) model introducing the time
                                       delay mechanism was established [23]. A discrete multi-stage dynamics system with time
                                       delay based on the development process of China’s epidemic was established [24], while
                                       the evolution of the epidemic spread was simulated by introducing the statistical character-
                                       istics of complex network distribution into an epidemiological model [25,26]. However,
                                       most of these models focus on the time series analysis of the spread of COVID-19. Such
                                       model parameters have a clear epidemiological significance but lack a spatiotemporal de-
                                       scription of practical significance. With the positive effects gained by epidemic prevention
                                       and control in some countries, the effect of implementing different epidemic prevention
                                       and control measures on the alleviation of the epidemic situation has been evaluated, such
                                       as quarantines [6,13,18,27–29], wearing face masks [16,30], social distancing [16,18,30,31],
                                       travel restrictions [32,33], the tracking and isolation of cases [16,34], school closures [18],
                                       the protection of the elderly over 70 years old [18], hospital isolation [23,35] and external
                                       factors (ventilation and hand washing) [36–39]. The effect of these interventions has been
                                       evaluated by performing statistical analyses of the trend of the epidemic data of some
                                       countries that implemented different interventions [40–42]. However, the main aim is to es-
                                       timate the effectiveness of intervention measures by adjusting the mathematical parameters
                                       of the model to simulate the trend of the epidemic when different intervention measures
                                       are used based on the prediction model. However, there is no reasonable explanation for
                                       the mapping between the model parameter values and the practical significance of the
                                       application of special interventions—for example, what scale of the isolation measures is
                                       needed that would be equivalent to a 30% reduction in contact rate? At the same time,
                                       these studies seldom consider that the spatiotemporal evolution of COVID-19 may have
                                       different impacts on epidemic interventions. Moreover, most of these models are mainly
                                       based on the compartmental model and take the epidemic area as a whole; thus, they lack
                                       detailed spatial information. Therefore, it is difficult to obtain information about the spatial
                                       spread of COVID-19. Therefore, the question of how to use the quantitative method to
                                       integrate spatial information and the impact of interventions into the traditional classical
                                       compartmental model based on a time series process is the focus of our scientific research.
                                             Geography is a subject that researches the spatial distribution rule, spatiotemporal
                                       evolution process, and regional features of the geographical elements and has been widely
                                       applied in various fields. The process of the spread and infection of COVID-19 is influ-
Analysis and Evaluation of Non-Pharmaceutical Interventions on Prevention and Control of COVID-19: A Case Study of Wuhan City - MDPI
ISPRS Int. J. Geo-Inf. 2021, 10, 480                                                                                             3 of 27

                                       enced by a series of complex natural and social factors. Its mode of transmission must
                                       usually be through close contact. Therefore, its most important feature is the process of
                                       spatiotemporal spread—that is, its transmission is regular in terms of time series and
                                       geospatial elements, which leads to understanding a phenomenon as geographical and
                                       potentially mappable [43,44]. Recently, there are many studies conducted in this field. For
                                       example, the mobile phone location data were used to forecast the epidemic situation in
                                       Wuhan from the perspective of spatial interaction [45]. The association between American
                                       nursing home-level metrics and place-based variables with COVID-19 confirmed that cases
                                       in nursing homes across the United States were established using spatial modeling technol-
                                       ogy [46]. The ecological niche model (ENM) was utilized to assemble the epidemic data
                                       and nine socioeconomic variables to identify the potential risk zones in Beijing, Shenzhen,
                                       and Guangdong [47]. However, the detailed observation data of crowds, such as the spatial
                                       interaction data of crowds and resident activity data, are difficult to obtain in a public
                                       health and safety emergency, usually resulting in the problem of missing or incomplete
                                       coverage. Although these studies have used multi-source data to analyze the epidemic
                                       situation, they still belonged to the categories of observation and reasoning with a small
                                       amount of sample data because of the precision and resolution of the data. Moreover, most
                                       of the current epidemic-related data only include the location where patients first showed
                                       symptoms, leaving the location where the patients were infected unknown. This indicates
                                       that current epidemic-related data also have a backtracking problem. Thus, the question of
                                       how to build observation strategies and scientific methods that are in line with reality is
                                       the key problem in the current public health and safety emergency [48].
                                            In this paper, we propose a COVID-19 prevention and control model based on a
                                       discrete grid. The goals of this study are two-fold: first, to evaluate and quantify the impacts
                                       of interventions by integrating a time series dynamic model of COVID-19 and spatial
                                       information; second, to establish a connection between the model parameters and the
                                       practical application significance, and not simply adjusting the mathematical parameters of
                                       the model to illustrate the effectiveness of the interventions. Our model parameters were
                                       the scope of the actual area and the intensity of the measures, which can provide better and
                                       more direct information for public health and safety emergencies policy [49]. Therefore, a
                                       multi-level grid was used to divide the geographical space of the epidemic area, and the
                                       status and intensity of the quarantine of the sub-region were described by dotted and solid
                                       lines of the boundary and the size of the grid, respectively. Then, a hospital isolation model
                                       was constructed by allocating medical capacity to the affected sub-region according to the
                                       correlation between the spatial distribution of hospitals and the sub-region. In addition,
                                       the parameters of means for human self-protection human (including wearing a face mask,
                                       washing hands frequently, and ventilation) were introduced into the dynamics model of
                                       COVID-19 to achieve the modeling of self-protection measures. In the absence of detailed
                                       behavior tracking data, we assumed that the means of transmission of COVID-19 mainly
                                       started from the space adjacent to the infected path and then gradually spread to the
                                       surrounding region (without any interventions) [50]. The spatiotemporal spread evolution
                                       of COVID-19 was simulated through the behavior features of residents’ daily activities
                                       based on the spatial correlation between sub-regions. Then, the COVID-19 dynamics
                                       model with asymptomatic infection was introduced for analyzing and quantifying the
                                       infectious situation of COVID-19 under the effects of different interventions. Since the
                                       absence of early epidemic data for Wuhan was caused by early interventions and the
                                       unknown nature of the virus, while the epidemic prevention and control measures abroad
                                       were applied relatively late and were lax [19], the early reported case data of the U.K., the
                                       U.S., Spain, and Germany were used to discuss the status of the spread of COVID-19. The
                                       parameters of a dynamic model of COVID-19 free spread were brought to Wuhan to obtain
                                       the infected curve of Wuhan without any interventions. Then, the potential of quarantine
                                       measures, hospital isolation measures, and self-protection measures to alleviate the spread
                                       of the epidemic at different scales and with different intervention times were discussed.
                                       Finally, the rationality and correctness of the model were evaluated with the actual data of
Analysis and Evaluation of Non-Pharmaceutical Interventions on Prevention and Control of COVID-19: A Case Study of Wuhan City - MDPI
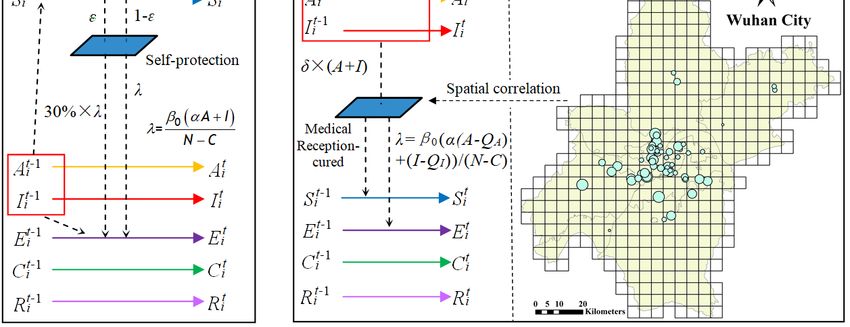
ISPRS Int. J. Geo-Inf. 2021, 10, 480                                                                                           4 of 27

                                       Wuhan, including epidemic data, hospital distribution data, and medical attribute data.
                                       The novelties of this study are highlighted as follows:
                                            (I). The association between the model parameters and the geographical space is
                                       established from the perspective of geography. This provides the model parameters
                                       practical instructive significance for special interventions rather than them only being used
                                       to describe the effect of the prevention and control measures, which can provide more
                                       direct and effective information for the formulation of prevention and control policies;
                                            (II). The effect of hospital isolation measures is evaluated by calculating the number
                                       of patients admitted to hospitals in the each infected region from the perspective of the
                                       hospital spatiotemporal distribution.

                                       2. Materials and Methods
                                       2.1. Data
                                             Wuhan reported a “viral pneumonia of unknown origin” on 31 December 2019, then
                                       issued a “city-wide closure”. The government successively issued a series of measures, such
                                       as restricting transportation, closing school, closing entertainment places, and prohibiting
                                       public gatherings. At the same time, many designated hospitals such as “huoshenshan”
                                       and “leishenshan”, as well as “fangcang” shelter hospitals, began to be put into use.
                                       Medical staff and medical resources from all over the country were involved in the fight
                                       against COVID-19. In order to discuss the effect of different interventions to alleviate the
                                       spread of COVID-19, this study collected global epidemic data, including the number of
                                       confirmed cases per day and the cumulative number of cured people and deaths from
                                       dingxiangyuan (https://ncov.dxy.cn/ncovh5/view/pneumonia; 1 June 2020) and the
                                       COVID-19 Data Repository by the Center for Systems Science and Engineering (CSSE)
                                       at Johns Hopkins University [51]; the data of designated hospitals in Wuhan, including
                                       the spatial distribution of hospitals, the intervention time, the number of open beds and
                                       the cumulative number of patients from Wuhan Municipal Health Commission (http:
                                       //zwfw.hubei.gov.cn/webview/yqzq/index.html; 20 June 2020); and the data of the
                                       medical resources gathered in Wuhan, including the number of local registered medical
                                       staff, the number of supporting medical staff in different regions, and the number of face
                                       masks (including N95 masks and medical–surgical masks) from the websites of the Hubei
                                       Provincial Bureau of Statistics, Hubei Provincial People’s Government (http://tjj.hubei.gov.
                                       cn/ztzl/jjdyqqfkjjz/zxtb/; 20 June 2020), and People’s Daily (http://www.people.com.cn/;
                                       20 June 2020). The authors organized and stored the data in the zenodo public database;
                                       the corresponding data links are listed at the end of this article.
                                             From the daily number of reported new cases in Wuhan, it can be seen that a sudden
                                       surge occurred on 12 February 2020 (Table 1). The reason for this is that the Novel Coron-
                                       avirus (2019-nCoV) Nucleic Acid Detection Kit (PCR fluorescence probing) was changed
                                       to clinical diagnosis (including the computed tomography (CT) method). Although, it
                                       was unjustified for later verification. This problem was analyzed through Richards non-
                                       linear curve model [52], and, according to the incubation period of COVID-19 lasting for
                                       7~14 days, the calibrated daily number of new confirmed cases from 30 January 2020, to
                                       12 February 2020, is shown in Table 1.

                                       2.2. Medel of Quarantine Measures Based on a Discrete Grid
                                            Quarantine measures usually take the “province–city–district–street–community–
                                       village–home” as the basic unit to limit the scope of people’s activity, which greatly reduces
                                       the contact between infected people and susceptible individuals. However, the uncertainty
                                       of the size and irregular shape of this traditional unit of prevention and control can cause
                                       great difficulties in the modeling. Moreover, more precise administrative division data
                                       are usually not easy for other authors to obtain. As shown in Figure 1, the prevention
                                       and control units of “city–district–street–community–home” can use different levels of
                                       the grid to make up for the difficulty of data acquisition and the irregular shape, and the
                                       effective grid regions were limited within the effective areas within the administrative
Analysis and Evaluation of Non-Pharmaceutical Interventions on Prevention and Control of COVID-19: A Case Study of Wuhan City - MDPI
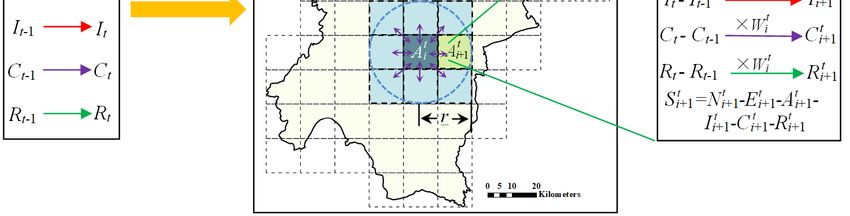
ISPRS Int. J. Geo-Inf. 2021, 10, 480                                                                                                                5 of 27

                                       division. According to the spatial features of physical quarantine, the discretization of the
                                       geospatial area was realized by a multi-level discrete grid with different sizes and series of
                                       grid units. An adaptive statistical unit can be formed by a hierarchical geographic grid to
                                       fill the traditional prevention and control unit. At the same time, the dotted and solid lines
                                       of the boundary and size of the grid can be used to describe the status and intensity of the
                                       quarantine in different regions, respectively, and the distribution of the grid can map the
                                       practical scope of the implementation of quarantine measures.

                                       Table 1. Calibration data of the cases reported per day in Wuhan.

                                                     Date                                   Actual Value                         Calibration Data
                                                30 January 2020                                      378                               759
                                                31 January 2020                                      576                              1101
                                                1 February 2020                                      894                              1182
                                                2 February 2020                                     1033                              1574
                                                3 February 2020                                     1242                              1683
                                                4 February 2020                                     1967                              2082
                                                5 February 2020                                     1766                              2195
                                                6 February 2020                                     1501                              2542
                                                7 February 2020                                     1985                              2618
                                                8 February 2020                                     1378                              2856
                                                9 February 2020                                     1921                              2857
                                               10 February 2020                                     1552                              2949
                                               11 February 2020                                     1104                              2852
                                               12 February 2020                                    13436                              3212

                                             The specific design was as follows: The research areas were divided into different
                                       sub-regions using a discrete grid, in which the total number of sub-regions was denoted by
                                       n. Referring to the model of COVID-19 spread dynamics proposed by Okuonghae et al. [16],
                                       the total number of humans in the epidemic area, denoted by N, was split into susceptible
                                       humans S(t), exposed humans E(t), asymptomatic infectious humans A(t), symptomatic
                                       infectious humans I(t), infected humans detected via testing C(t), and recovered humans
                                       R(t). The boundary of the grid was represented with a dotted line before the implementation
                                       of quarantine (Figure 2). At this time, there were few restrictions on the contact between
                                       people, and the spread of COVID-19 occurred freely. The numerical changes of each human
                                       could be quantified by the epidemic dynamic model of the whole region, as shown in the
                                       following Equations (1)–(6). The related variable parameters of the model are described
                                       in Table 2.                                                       !
                                                                                  t−1 β αA + I
                                                                                          0    j      j
                                                                     S t = S1 − ∑                        Sj ,                   (1)
                                                                                  j =1
                                                                                            N − Cj
                                                                                                              !
                                                                             t−1 β αA + I
                                                                                                   
                                                                                       0    j    j
                                                                 Et = E1 + ∑                         S j − σEj ,                (2)
                                                                             j =1
                                                                                         N − Cj

                                                                                            t −1
                                                                                            ∑
                                                                                                                       
                                                                      A t = A1 +                   υσEj − (θ + γa ) A j ,                              (3)
                                                                                            j =1

                                                                              t −1
                                                                              ∑
                                                                                                                    
                                                                  It = I1 +          (1 − ν)σEj − ( ϕ + γo + do ) Ij , ,                               (4)
                                                                              j =1

                                                                                     t −1
                                                                                     ∑
                                                                                                                       
                                                                    Ct = C1 +                θ A j + ϕIj − (γc + dc )Cj ,                              (5)
                                                                                     j =1

                                                                                        t −1
                                                                                         ∑
                                                                                                                            
                                                                      R t = R1 +                   γc C j + γ a A j + γo I j .                         (6)
                                                                                        j =1
Analysis and Evaluation of Non-Pharmaceutical Interventions on Prevention and Control of COVID-19: A Case Study of Wuhan City - MDPI
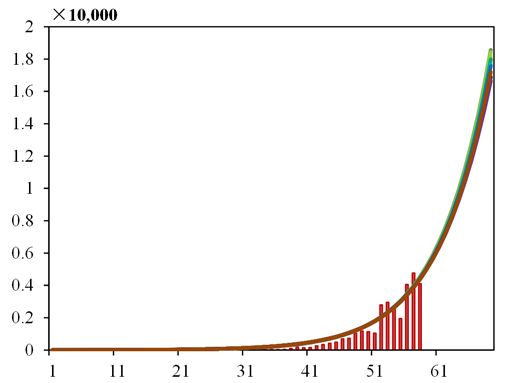
ISPRS Int. J. Geo-Inf. 2021, 10, 480                                                                                         6 of 27
ISPRS Int. J. Geo-Inf. 2021, 10, x FOR PEER REVIEW                                                                           6 of 28

ISPRS Int. J. Geo-Inf. 2021, 10, x FOR PEER REVIEW                                                                           8 of 28
                           Figure 1. A diagram of the grid filling of traditional prevention and control units.
                           Figure 1. A diagram of the grid filling of traditional prevention and control units.

                                         The specific design was as follows: The research areas were divided into different
                                   sub-regions using a discrete grid, in which the total number of sub-regions was denoted
                                   by n. Referring to the model of COVID-19 spread dynamics proposed by Okuonghae
                                   et al. [16], the total number of humans in the epidemic area, denoted by N, was split into
                                   susceptible humans S(t), exposed humans E(t), asymptomatic infectious humans A(t),
                                   symptomatic infectious humans I(t), infected humans detected via testing C(t), and recov-
                                   ered humans R(t). The boundary of the grid was represented with a dotted line before the
                                   implementation of quarantine (Figure 2). At this time, there were few restrictions on the
                                   contact between people, and the spread of COVID-19 occurred freely. The numerical
                                   changes of each human could be quantified by the epidemic dynamic model of the whole
                                   region, as shown in the following Equations (1)–(6). The related variable parameters of
                                   the model are described in Table 2.

                                                                      St = S1 −  
                                                                                        
                                                                                    t −1  β 0   (α Aj + I j ) S  ,
                                                                                j =1            N − Cj         j              (1)
                                                                                                                    
                                                                                                                   

                                                                             t −1
                                                                                      0  j (
                                                                                     β αA +I
                                                                                              j           )
                                                                                                    E j  grid.
                                                                                                                        
                      Figure 2. Schematic
                      Figure 2. Schematic diagram
                                          diagram of
                                                  of the model of
                                                     the model    t = E1 +  measures
                                                               ofEquarantine
                                                                  quarantine measures
                                                                             
                                                                                      based on
                                                                                      based on aa σ
                                                                                            Sj −  discrete
                                                                                                  discrete grid.                (2)
                                                                             j =1          N − Cj                      
                                                                                                                       ,
                                   Table 2. Description of the parameters of the COVID-19 spread dynamics model.

                                   Parameter                                            Interpretation
                                         Sit    Number of susceptible humans per day in grid cell i.

                                           t    Number of exposed humans per day in grid cell i (infected but not infectious).
Analysis and Evaluation of Non-Pharmaceutical Interventions on Prevention and Control of COVID-19: A Case Study of Wuhan City - MDPI
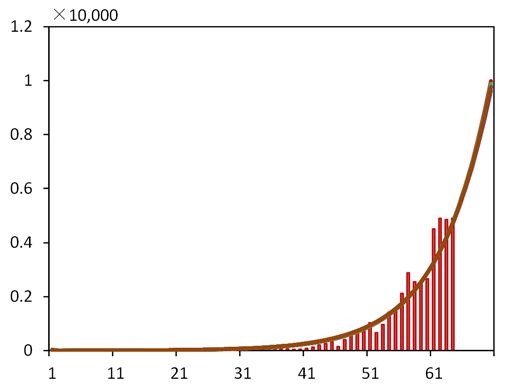
ISPRS Int. J. Geo-Inf. 2021, 10, 480                                                                                                                                    7 of 27

                                       Table 2. Description of the parameters of the COVID-19 spread dynamics model.

                                         Parameter        Interpretation
                                              Sit         Number of susceptible humans per day in grid cell i.
                                              Eit         Number of exposed humans per day in grid cell i (infected but not infectious).
                                              Ait         Number of asymptomatically infectious humans per day in grid cell i (undetected).
                                              Iit         Number of symptomatically infectious humans per day in grid cell i (undetected).
                                              Cit         Number of infectious humans detected per day in grid cell i (including
                                                          asymptomatic and symptomatic, tested but not completely admitted to hospital).
                                              Rit         Number of recovered humans per day in grid cell i.
                                              β0          Effective spread rate.
                                              σ           Progression rate from exposed state to the infectious state.
                                              υ           Fraction of new infectious humans that are asymptomatic.
                                              α           Modification parameter that accounts for the reduced infectiousness of humans in
                                                          the A class when compared to humans in the I class.
                                          γ a , γo , γc   Recovery rate for individuals in the A, I, and C classes, respectively.
                                                ϕ         Detection rate (via contact tracing and testing) for the I class.
                                                θ         Detection rate (via contact tracing and testing) for the A class.
                                             do , dc      Disease-induced death rates for individuals in the I and C classes, respectively.

                                            When quarantine measures were implemented, all of the grid boundaries changed
                                       from dotted to solid lines, and the current time was denoted t0 . The activities of people
                                       were limited to within the sub-regions, meaning that COVID-19 could only diffuse in the
                                       infected grid regions and could not affect the other grid regions (Figure 2). The number
                                       of different humans in the sub-grid was denoted by Sit , Eit , Ait , Iit , Cit and Rit at time t,
                                       respectively. The numerical changes of each human were the sum of all sub-regions, as
                                       shown in the following Equations (7)–(12), where Ni refers to the number of people in
                                       each grid cell, and its specific value was obtained from the statistical yearbook data using
                                       Kriging interpolation [50]:
                                                                                                      
                                                                                                j   j
                                                                              
                                                                           n        t−1 β 0 αA + I
                                                                                                i   i
                                                                   S t = ∑  Si 0 − ∑
                                                                                t                       j
                                                                                                  j
                                                                                                       Si  ,                       (7)
                                                                         i =1       j =1    Ni − Ci
                                                                                                                             
                                                                                                                       j    j
                                                                                                                                                  
                                                                            n                         t −1       β 0 αAi + Ii
                                                                          ∑ Ei 0 + ∑ 
                                                                                           t                                           j        j
                                                                Et =                                                            j
                                                                                                                                     Si − σEi ,                          (8)
                                                                          i =1                        j =1             N − Ci
                                                                                                                                                    !
                                                                                  n                          t −1                              
                                                                                 ∑                           ∑
                                                                                                t                        j                  j
                                                                     At =                      Ai 0   +               υσEi   − (θ   + γa ) Ai           ,                  (9)
                                                                                 i =1                        j =1
                                                                                                                                                                !
                                                                      n                        t −1                                                        
                                                                     ∑                         ∑
                                                                                 t                               j                              j
                                                              It =              Ii 0   +                (1 − ν)σEi           − ( ϕ + γo + do ) Ii                   ,    (10)
                                                                     i =1                      j =1
                                                                                                                                                            !
                                                                            n                         t −1                                         
                                                                          ∑                           ∑
                                                                                        t                         j         j                j
                                                                Ct =                   Ci 0    +               θ Ai   +   ϕIi   − (γc + dc )Ci                  ,        (11)
                                                                          i =1                        j =1
                                                                                                                                                !
                                                                                       n                      t −1
                                                                                  ∑                           ∑ γc C j + γ a A j + γo I j
                                                                                                 t
                                                                      Rt =                      Ri 0    +                                           .                    (12)
                                                                                  i =1                        j =1

                                       2.3. Spatiotemporal Spread Model of COVID-19 Based on a Discrete Grid
                                            The most important feature of infectious diseases is that, in order for them to spread,
                                       they need a special path of spread, such as air spread, droplet spread, close contact,
                                       and blood spread. Government departments usually take interventions to cut off the
                                       transmission path between infected and susceptible humans, such as implementing strict
                                       quarantine measures, testing, tracking cases, wearing face masks, and actively keeping a
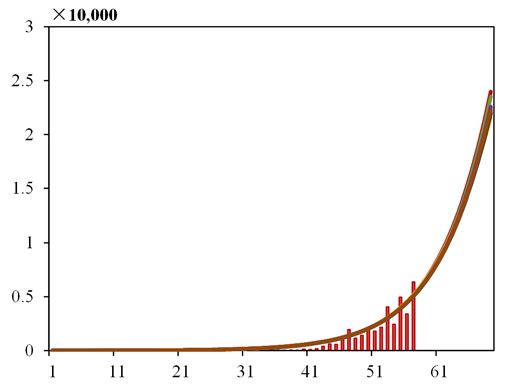
Analysis and Evaluation of Non-Pharmaceutical Interventions on Prevention and Control of COVID-19: A Case Study of Wuhan City - MDPI
ISPRSInt.
ISPRS  Int.J.J.Geo-Inf.
                Geo-Inf.2021,
                         2021,10,
                               10,480
                                   x FOR PEER REVIEW                                                                                                      89ofof27
                                                                                                                                                                 28

                                     from patients
                                    distance             with a fever.
                                                from patients       with aTherefore,        it is necessary
                                                                              fever. Therefore,                  to determine
                                                                                                      it is necessary              the distribution
                                                                                                                          to determine                     of the
                                                                                                                                             the distribution
                                     number      of  infected     humans       in each    grid    region    before    a  quarantine
                                    of the number of infected humans in each grid region before a quarantine is implemented              is  implemented         in
                                     order   to  evaluate     the  effect   of  different    interventions.
                                    in order to evaluate the effect of different interventions.
                                            The differences
                                           The    differences in   in regions
                                                                        regions and and virus
                                                                                          virus types
                                                                                                    typesmeanmeanthat thatthethespatiotemporal
                                                                                                                                  spatiotemporal spread   spread
                                     mode, spread
                                    mode,     spread path,path, and
                                                                  and spread
                                                                         spread capacity
                                                                                    capacity of  of infectious
                                                                                                     infectious diseases
                                                                                                                    diseases have
                                                                                                                                have certain
                                                                                                                                        certain differences.
                                                                                                                                                    differences.
                                     However,because
                                    However,       becauseof    ofthe
                                                                    thespatial
                                                                          spatialcorrelation
                                                                                    correlationof    ofpeople’s
                                                                                                         people’sliving,
                                                                                                                      living,work,
                                                                                                                               work,rangerangeof   ofactivities,
                                                                                                                                                       activities,
                                     and   surrounding        environment,        the  transmission        of  infectious
                                    and surrounding environment, the transmission of infectious diseases restricted by       diseases    restricted     bythose
                                                                                                                                                            those
                                     spatial  factors     also  has  spatial     correlations.     When      the  flow   of  people
                                    spatial factors also has spatial correlations. When the flow of people in an epidemic area        in   an   epidemic     area
                                                                                                                                                                is
                                     is not
                                    not      completely
                                         completely          limited,
                                                          limited,    thethe   number
                                                                            number      ofof  newly
                                                                                           newly        infectedpeople
                                                                                                      infected      peopleinina asub-region
                                                                                                                                    sub-regionatataacertain
                                                                                                                                                          certain
                                     timeisisnot
                                    time       notonly
                                                    onlyaffected
                                                            affectedbybythe  the   number
                                                                                number      of of  infected
                                                                                                infected        people
                                                                                                            people        at the
                                                                                                                      at the      previous
                                                                                                                              previous     time, time,
                                                                                                                                                    but but
                                                                                                                                                         alsoalso
                                                                                                                                                               by
                                     by number
                                    the  the number        of infected
                                                     of infected     peoplepeople
                                                                                in theinsurrounding
                                                                                         the surrounding          regions.
                                                                                                            regions.          The transmission
                                                                                                                        The transmission                of infec-
                                                                                                                                                  of infectious
                                     tious diseases
                                    diseases   similarsimilar       to COVID-19
                                                           to COVID-19        usuallyusually
                                                                                         starts fromstartsthefrom
                                                                                                               spacetheadjacent
                                                                                                                          space adjacent        to the infected
                                                                                                                                   to the infected       path of
                                     path
                                    the     of the
                                         virus  andvirus
                                                       then and     then gradually
                                                             gradually      spreads to spreads         to the surrounding
                                                                                           the surrounding         regions [50].regions
                                                                                                                                    As shown   [50].inAs  shown
                                                                                                                                                       Figure   3,
                                    the  patients
                                     in Figure    3, in
                                                      thethe  infected
                                                           patients    in area    Ait are most
                                                                           the infected              Ait are
                                                                                             area likely    to most
                                                                                                                infectlikely
                                                                                                                        the people     in the
                                                                                                                               to infect    the eight
                                                                                                                                                  people nearby
                                                                                                                                                           in the
                                    areas
                                     eight (light
                                             nearby blue
                                                       areasarea)   next.
                                                               (light  blue Therefore,
                                                                               area) next. the   epidemicthe
                                                                                              Therefore,       area  was intersected
                                                                                                                   epidemic    area waswith          a bufferwith
                                                                                                                                              intersected      of
                                    infected    grid   cells   constructed       by  the  behavior       features    of  people’s
                                     a buffer of infected grid cells constructed by the behavior features of people’s average activ- average       activities  to
                                    obtain
                                     ities tothe  number
                                              obtain            of newly
                                                        the number        of infected    grid regions
                                                                             newly infected                  each day,
                                                                                                    grid regions     eachwhere     the radius
                                                                                                                            day, where              is denoted
                                                                                                                                             the radius     is de-
                                    by  r.  An  incompletely        infected     grid   cell  was    regarded     as  infected
                                     noted by r. An incompletely infected grid cell was regarded as infected for the convenience  for the    convenience       of
                                    calculation.    In  order    to ensure     the  consistency      of the   diffusion    scale,
                                     of calculation. In order to ensure the consistency of the diffusion scale, we used the maxi- we  used      the  maximum
                                    grid
                                     mum   scale
                                             gridofscale
                                                      the experiment
                                                           of the experiment(1000 m)     as m)
                                                                                     (1000   theas basis
                                                                                                      the for
                                                                                                           basisdiffusion.
                                                                                                                  for diffusion.

                                     Figure 3. Spatiotemporal spread model for infectious diseases based on a discrete grid.
                                    Figure 3. Spatiotemporal spread model for infectious diseases based on a discrete grid.

                                           Inthe
                                          In  theprocess
                                                   processofof thethe   transmission
                                                                     transmission         of COVID-19,
                                                                                      of COVID-19,          the number
                                                                                                       the number            of cases
                                                                                                                      of cases           of newly
                                                                                                                                  of newly    infectedin-
                                     fected  people   per  day  always     has   a time  series change    process   that  first
                                    people per day always has a time series change process that first increases and then de-     increases   and   then
                                     decreases.
                                    creases.       Meanwhile,
                                              Meanwhile,            infected
                                                             infected     peoplepeople    are abstracted
                                                                                   are abstracted    as many  asdiscrete
                                                                                                                 many discrete
                                                                                                                          points inpoints       in geo-
                                                                                                                                       geographical
                                     graphical
                                    space.       space. According
                                             According     to Tobler’s   to first
                                                                             Tobler’s
                                                                                  law first  law of geography,
                                                                                        of geography,               the process
                                                                                                          the process                of the transmis-
                                                                                                                          of the transmission        of
                                     sion of COVID-19,
                                    COVID-19,               as restricted
                                                  as restricted                by geographical
                                                                   by geographical                 spatialhas
                                                                                         spatial factors,    factors,
                                                                                                                stronghas   strong
                                                                                                                         spatial      spatial correla-
                                                                                                                                   correlation    char-
                                     tion characteristics
                                    acteristics             [44]. Theisdistance
                                                 [44]. The distance          used toisdescribe
                                                                                         used tothe
                                                                                                  describe
                                                                                                      spatialthe  spatial
                                                                                                                weight      weightofconcept
                                                                                                                         concept                  of the
                                                                                                                                         the infected
                                     infected
                                    grid  cells,grid cells,
                                                 which      which
                                                          could    helpcould   help tothe
                                                                          to obtain     obtain  the number
                                                                                            number     of newly of newly
                                                                                                                   infected infected
                                                                                                                               peoplepeople
                                                                                                                                          at the at  the
                                                                                                                                                  next
                                     next  moment     in the  corresponding        infected   grid  cell, as  shown   in  Figure
                                    moment in the corresponding infected grid cell, as shown in Figure 3 and Equations (13)         3 and   Equations
                                     (13)(14).
                                    and   and (14).  In addition,
                                                In addition,           the number
                                                               the number              of people
                                                                                of people         should
                                                                                             should          be rounded
                                                                                                      be rounded     in theindistribution:
                                                                                                                                the distribution:

                                                                                   Wit   = hij    ( )
                                                                                            -p nt nt  -p
                                                                                                                  ( )
                                                                                         Wit =t h−ijt p /  thijt − p ,
                                                                                                       / ∑i =1hij    ,                                       (13)
                                                                                                                                                            (13)
                                                                                                          i =1

                                                                                             (           ) (                )
                                                                                                           2                2
                                                                                   hij= t xit -tx−tj1−1 2 +yitt -ytj −1t−1 , 2                           (14)
                                                                                  rt
                                                                         hijt   =      xi − x j             + yi − y j             ,                        (14)
Analysis and Evaluation of Non-Pharmaceutical Interventions on Prevention and Control of COVID-19: A Case Study of Wuhan City - MDPI
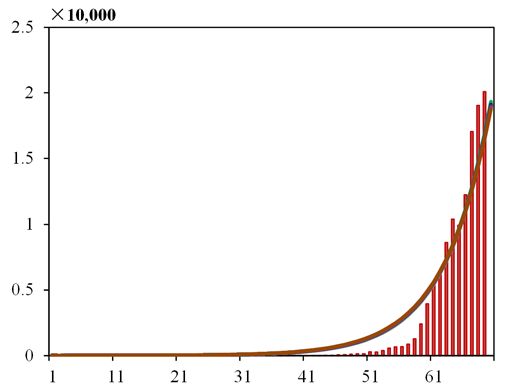
ISPRS Int. J. Geo-Inf. 2021, 10, x FOR PEER REVIEW                                                                                          10 of 28

ISPRS Int. J. Geo-Inf. 2021, 10, 480                                                                                                          9 of 27

                                        where Wit is the weight of the number of newly infected crowds assigned by the infected
                                                    t       t weight of the number of newly infected crowds assigned by the infected
                                         grid W
                                       where        i is h
                                                cell,      the
                                                            ij is the distance from the infectious grid cell to the affected grid cell,
                                       gridt −cell,  h is the distance from the infectious grid cell to the affected grid cell, ( xitt−−11, yitt−−11)
                                                      t
                                         ( xi 1 ,yit −ij1 ) is the coordinates of the center point of the infectious          grid cell, ( x j ,y j )
                                       is the coordinates of the center point of the infectious grid cell, ( x tj −1 , ytj −1 ) is the coordinates
                                                                                               t is the number          t
                                       ofisthe
                                            thecenter
                                                 coordinates       of the affected
                                                            point of      center point
                                                                                   gridof  thenaffected
                                                                                         cell,           grid cell,of naffected
                                                                                                                          is the grid
                                                                                                                                 number   ofand
                                                                                                                                      cells,  affected
                                                                                                                                                  p is
                                         grid
                                       any     cells, and
                                             positive              is any (usually
                                                           real pnumber    positive 2).
                                                                                    real number (usually 2).

                                       2.4.
                                         2.4.Model
                                              ModelofofSelf-Protection
                                                         Self-ProtectionMeasures
                                                                           Measures
                                             During
                                               During the outbreak ofCOVID-19,
                                                       the  outbreak    of  COVID-19,people
                                                                                          peopletook
                                                                                                  tookmany
                                                                                                        manyself-protection
                                                                                                                self-protectionmeasures,
                                                                                                                                 measures,such
                                                                                                                                             such
                                       asaswearing
                                             wearing face masks effectively, washing their hands frequently, keepingtheir
                                                     face   masks    effectively, washing    their  hands   frequently,   keeping   theirhouses
                                                                                                                                           houses
                                       ventilated,
                                         ventilated,andandmaintaining
                                                             maintainingdistance
                                                                             distancefrom
                                                                                       frompatients
                                                                                              patientswith
                                                                                                        withaafever.
                                                                                                                 fever.Clinical
                                                                                                                         Clinicaland
                                                                                                                                  andinfectious
                                                                                                                                       infectious
                                       disease   studies  have   shown    that the implementation     of proper   self-protection
                                         disease studies have shown that the implementation of proper self-protection             measures    can
                                                                                                                                       measures
                                       effectively  reduce    the  risk of infection and   the external   spread   of the virus by
                                         can effectively reduce the risk of infection and the external spread of the virus by 70–80%70–80%   [53].
                                       In[53].
                                           thisIn
                                                study,  the parameter
                                                  this study,              ε was introduced
                                                                the parameter                   to represent
                                                                                  ε was introduced             the proportion
                                                                                                        to represent             of people
                                                                                                                       the proportion       who
                                                                                                                                        of people
                                       undertake    effective
                                         who undertake          self-protection
                                                             effective           measures.
                                                                        self-protection       The probability
                                                                                          measures.              of the infection
                                                                                                      The probability             of susceptible
                                                                                                                         of the infection  of sus-
                                       humans     undertaking     effective  self-protection   measures    was  reduced
                                         ceptible humans undertaking effective self-protection measures was reduced       to 30%  of the
                                                                                                                                       tonormal
                                                                                                                                           30% of
                                       value.   In contrast,
                                         the normal     value. the   rate of infection
                                                                In contrast,             and
                                                                               the rate of    externaland
                                                                                            infection    spread   to other
                                                                                                             external  spreadhumans   remained
                                                                                                                               to other  humans
                                       unchanged     (Figure    4A).
                                         remained unchanged (Figure 4A).

                                        Figure4.4.Schematic
                                       Figure      Schematicdiagram
                                                             diagramofofhospital
                                                                         hospitalisolation
                                                                                   isolationmeasures
                                                                                             measures(A)
                                                                                                      (A)and
                                                                                                          andself-protection
                                                                                                              self-protectionmeasures
                                                                                                                             measures(B).
                                                                                                                                      (B).

                                       2.5.
                                        2.5.Model
                                             ModelofofHospital
                                                       HospitalIsolation
                                                                IsolationMeasures
                                                                         Measures
                                             During
                                               Duringthethespread
                                                             spreadofofCOVID-19,
                                                                          COVID-19,the   thegovernment
                                                                                              governmentdesignated
                                                                                                            designatedcertain
                                                                                                                          certainhospitals
                                                                                                                                    hospitalsand
                                                                                                                                               and
                                       outpatient
                                         outpatient clinics to detect and receive suspected COVID-19 patients. People typically to
                                                    clinics to detect  and  receive   suspected    COVID-19   patients.  People   typically  go  go
                                       a to
                                         nearby   hospital
                                            a nearby         for diagnosis
                                                       hospital              when
                                                                 for diagnosis       theythey
                                                                                  when      findfind
                                                                                                 themselves   unhealthy,
                                                                                                      themselves           due due
                                                                                                                  unhealthy,    to thetoinfluence
                                                                                                                                         the influ-
                                       ofence
                                          people’s   living,living,
                                               of people’s    work,work,
                                                                      activity range,range,
                                                                            activity    and theandsurrounding    environment.
                                                                                                    the surrounding   environment.Therefore,   the
                                                                                                                                        Therefore,
                                       spatial  distribution
                                         the spatial           of hospitals
                                                      distribution            and the
                                                                     of hospitals   andnumber      of beds
                                                                                          the number        available
                                                                                                        of beds        havehave
                                                                                                                 available   a great   impact
                                                                                                                                   a great      on
                                                                                                                                           impact
                                       the
                                         onspread   of COVID-19.
                                             the spread   of COVID-19.ThereThere
                                                                             is a strong   spatialspatial
                                                                                    is a strong    correlation  between
                                                                                                          correlation     a geographical
                                                                                                                       between              space
                                                                                                                                  a geographical
                                       and  a hospital.
                                         space           If a patient
                                                and a hospital.        is admitted
                                                                  If a patient        to the hospital,
                                                                                is admitted             they will
                                                                                               to the hospital,   nowill
                                                                                                                they  longer  participate
                                                                                                                           no longer        in the
                                                                                                                                       participate
                                       chain of transmission of infectious diseases. Considering the open time lag of medical beds
                                       and that government investment in medical beds is usually based on the number of people
ISPRS Int. J. Geo-Inf. 2021, 10, 480                                                                                                    10 of 27

                                       who are currently infected, the percentage parameter δ for the number of infected people
                                       was introduced to simulate the number of beds used in the hospital every day. Then, the
                                       number of cases admitted to the hospital every day was allocated to the corresponding
                                       infected grid cell based on the spatial distance weight (Figure 4B), where Q A and Q I refer
                                       to the number of asymptomatic and symptomatic infected people admitted to the hospital
                                       every day, respectively, and the specific values were mathematical products of ∑in=1 Qit and
                                       the corresponding detection ratio (θ and ϕ). The number of daily patients put into hospital
                                       isolation in each grid cell is shown in the following Equations (15)–(17):
                                                                                      q              2             2
                                                                            hij =         xi − x j        + yi − y j ,                     (15)

                                                                                                          ni
                                                                                   Wij = hij − p / ∑ hij − p ,                             (16)
                                                                                                      j =1
                                                                           
                                                                           
                                                                                           0, t ≤ t0j ∪ t ≥ t1j
                                                                 Qit   =       H
                                                                                                       0         1       ,                 (17)
                                                                            ∑ wij × δ × ( At + It ), t j ≤ t ≤ t j
                                                                           
                                                                               j =1

                                       where Qit is the number of patients admitted to the hospital in the grid cell (including
                                       asymptomatic and symptomatic), hij is the distance between the grid cell and the hospital,
                                       wij is the assigned weight of the number of hospital patients in the corresponding grid
                                       cell, ( xi , yi ) is the coordinates of the central point of the infected grid cell, ( x j , y j ) is the
                                       coordinates of the hospital, ni is the number of grid cells affected by the hospital, and t0j
                                       and t1j are the intervention time and closing time of the hospital, respectively.

                                       3. Results
                                       3.1. Numerical Simulation and Analysis of the Number of Infected Humans without
                                       Any Interventions
                                             In order to compare the differences in the number of infected humans before and
                                       after the interventions, the curve of people infected without any intervention needed to
                                       be estimated. The first thing that needs to be made clear is that no country will allow
                                       infectious diseases to spread freely, which means that the freely infected curve representing
                                       the number of infected humans for any infectious diseases is usually not available. Recently,
                                       many studies have used the early epidemic data of the study area or random sampling
                                       of the basic reproduction number R0 to solve this problem [16,18]. Unfortunately, Wuhan
                                       was the first city that faced the COVID-19 epidemic. Due to the unknown characteristics
                                       of the virus and the rapid and intensive interventions carried out, the estimated number
                                       of infected humans detected at this early stage is very unreliable. Therefore, it cannot
                                       truly describe the early trend of the number of infected humans. However, as foreign
                                       epidemics occurred after the outbreak in Wuhan, the level of medical detection was high
                                       and interventions carried out in foreign regions were relatively late and lax [19]; it is more
                                       likely that these early epidemic data are consistent with the free spreading situation of
                                       COVID-19. However, the differences between different countries in terms of the patterns of
                                       movement of crowds and levels of economic development make it difficult to objectively
                                       clarify which country’s data are the most appropriate for simulating the free infected trend
                                       of COVID-19. Therefore, for this study, we selected early epidemic data from the U.K., the
                                       U.S., Spain, and Germany to create a curve showing the number of infected humans under
                                       conditions in which no interventions were carried out.
                                             The genetic algorithm was used to estimate the parameters by regarding the number
                                       of new cases reported per day as the adaptive index. The other parameter values for the
                                       dynamic model of the spread of COVID-19 are shown in Table 3. To ensure that there were
                                       a sufficient number of sample data, the data for the period of time of 14 days after strict
                                       measures were implemented, there were still sample data referenced to incubation period
                                       of 7–14 days. It is worth noting that our estimation started from the announcement of
ISPRS Int. J. Geo-Inf. 2021, 10, 480                                                                                           11 of 27

                                       the first confirmed case in each country, but that at this time there were already unknown
                                       numbers of infected and exposed humans among the population. Therefore, the estimation
                                       parameters included the estimation of the first day of exposed cases E1 , asymptomatic cases
                                       A1 , and symptomatic cases I1 . Considering that Wuhan implemented a very large-scale
                                       detection program, undertook strict exclusion and investigation procedures, and reported
                                       fewer asymptomatic patients, the initial constraint is that there were fewer asymptomatic
                                       cases than symptomatic cases in the genetic algorithm. We repeated the genetic algorithm
                                       100 times to ensure the reliability of the results. The results are shown in Figure 5, and the
                                       corresponding estimated parameter values are shown in Table 4. Here, data for the early
                                       period of the epidemic in the U.K., the U.S., Spain, and Germany were from 31 January 2020
                                       to 3 April 2020, 20 January 2020 to 28 March 2020, 1 February 2020 to 28 March 2020, and
                                       27 January 2020 to 24 March 2020, respectively.

                                       Table 3. Values of the parameters in the COVID-19 spread dynamics model.

                                                     Parameter                      Baseline Value 1              Range 1
                                                          β0                               Fitted                Estimated
                                                          α                              0.5/day                 [0.1]/day
                                                          υ                              0.5/day                 [0.1]/day
                                                          σ                             1/5.2/day             [1/14,1/3]/day
                                                          ϕ                             Fitted/day               Estimated
                                                          θ                             Fitted/day               Estimated
                                                          γc                            1/15/day              [1/30,1/3]/day
                                                      γ a = γo                         0.13978/day            [1/30,1/3]/day
                                                      do = dc                           0.015/day                [0.001,0.1]
                                       1   Reference from Chen [1] Okuonghae [16], and Cauchemez [54].

                                             Figure 5 shows that the results of the model to fit the early data of different countries
                                       were better (small chart section in Figure 5). After using the fitted parameters for Wuhan,
                                       the free spread state of COVID-19 compared to the real curve in Wuhan was mainly
                                       reflected in the improvement of the peak value, the extension of the peak arrival time,
                                       and the duration of the epidemic situation. However, although the early data was fitted
                                       well (the small part in Figure 4), the future trends of different curves were quite different,
                                       mainly in terms of the number of peaks. This difference was because the spread of the
                                       early epidemic was easily affected by the population distribution, population flow, and
                                       the efficiency of medical resource detection in different regions. Alberti et al. also pointed
                                       out that there is great uncertainty in using early small sample data to predict the epidemic
                                       situation [55].
                                             Table 4 shows that the number of asymptomatic infections was less than that of
                                       symptomatic infections in the early stage, which is consistent with the actual situation
                                       reported in Wuhan. The detection rate of symptomatic patients was also significantly
                                       higher than that of asymptomatic infections. The infection rate β 0 , asymptomatic detection
                                       rate θ, symptomatic detection rate ϕ, and basic reproduction number R0 in the estimated
                                       parameters were roughly the same (the same countries), and the estimation of R0 was
                                       similar to that of Wu [6], Zhou [7], and Wang [9]. However, the estimated values of E1 , A1 ,
                                       and I1 were quite different, mainly because it was difficult to confirm the actual number of
                                       infected people who had already exited but had not been tested or had no symptoms when
                                       the first case was found.
                                             In summary, we selected 10 curves with the highest goodness of fit R2 estimated from
                                       the early data of the U.K., the U.S., Spain, and Germany rather than a selected single curve,
                                       which eliminated the difference for the potential assessment of prevention and control
                                       measures under different levels of spread of COVID-19 without any interventions.
ISPRS Int. J. Geo-Inf. 2021, 10, 480                                                                                            12 of 27

                      Table 4. Parameters of the curve for people infected with COVID-19 without any interventions.

 Source of Data     Estimated Curve       E1            A1             I1        β0             θ             ϕ        R2       R0
                           1            994.9963   4.9352 ×  10−5    0.0002    0.6820     8.0800 ×  10−5   0.011569   0.9683   3.2689
                           2            880.6889       1.3909       101.8516   0.6776     3.2035 × 10⁻⁵    0.010808   0.9680   3.2576
                           3            522.1685       1.0038       188.0705   0.67034    4.3437 × 10⁻⁶    0.014855   0.9668   3.1747
                           4            782.8959      10.9702       142.8662    0.6676    9.0100 × 10⁻⁷    0.01243    0.9667   3.1905
       UK                  5             492.838      17.7107        68.8706    0.6740    5.3988 × 10⁻⁶     0.0231    0.9661   3.0998
                           6            428.4349      74.3875        77.7457    0.6727    3.0811 × 10⁻⁶     0.0223    0.9661   3.1026
                           7            369.0471      18.1297       199.3840    0.6679    1.9437 × 10⁻⁶     0.0184    0.9660   3.1230
                           8            438.4535      20.6176       156.1451    0.6680    4.5815 × 10⁻⁵     0.0190    0.9660   3.1159
                           9            745.7698      97.9919       137.6607    0.6600    1.5772 × 10⁻⁶     0.0130    0.9657   3.1474
                           10           279.9186      42.9728       161.9717    0.6712    2.5609 × 10⁻⁶     0.0233    0.9657   3.5839
                           1            556.3781      47.2879       222.3518   0.7393     1.4375 × 10⁻⁵     0.0086    0.9528   3.5425
                           2            516.6224       3.8532       140.3937   0.7405     9.4490 × 10⁻⁶     0.0121    0.9526   3.5190
                           3            635.1028      43.2186        44.0625   0.7394     5.8214 × 10⁻⁶     0.0135    0.9520   3.4706
                           4            385.8888      66.1527        75.3132   0.7405     4.2351 × 10⁻⁶     0.0177    0.9511   3.5168
       US                  5            532.3682      24.9516       152.9867   0.7350     2.9878 × 10⁻⁶     0.0121    0.9510   3.5569
                           6            534.7422       2.6723       352.6032   0.7313     2.5243 × 10⁻⁵     0.0078    0.9507   3.5575
                           7            680.0307     103.1939       375.1976   0.7276     1.6587 × 10⁻⁶     0.0064    0.9495   3.4564
                           8            765.0599       0.1725         0.2499   0.7324     5.0923 × 10⁻⁶     0.0158    0.9494   3.4904
                           9            553.8119      31.8721       246.6154   0.7246     6.0201 × 10⁻⁶     0.0103    0.9486   3.4200
                           10           982.4765      25.9922        70.1316   0.7140     3.5647 × 10⁻⁵     0.0117    0.9452   3.5839
                           1            545.0229      15.8802        80.0674   0.7335     6.4220 × 10⁻⁶     0.0288    0.9110   3.3093
                           2            583.2245      12.2590        78.7125   0.7293     8.9861 × 10⁻⁷     0.0283    0.9104   3.2957
                           3            845.3579     139.8717       310.5179   0.7159     3.4132 × 10⁻⁵     0.0115    0.9102   3.4336
                           4            828.2234      36.0338       148.3467   0.7096     1.7847 × 10⁻⁶     0.0192    0.9082   3.3084
      Spain                5            999.8722       0.0271         9.5564   0.7119     4.2396 × 10⁻⁵     0.0235    0.9077   3.2692
                           6            917.1408       0.0022         0.0673   0.7140     8.2659 × 10⁻⁵     0.0270    0.9073   3.2400
                           7            999.9903      27.4579        63.5574   0.7063     1.2845 × 10⁻⁶     0.0207    0.9071   3.2763
                           8            997.6565       0.0477        51.1226   0.7052     9.1473 × 10⁻⁵     0.0227    0.9063   3.2467
                           9            506.7653      61.5072       135.7323   0.7123     4.7674 × 10⁻⁵     0.0304    0.9058   3.1964
                           10           944.9594       0.0097         0.0464   0.7088     4.7779 × 10⁻⁵     0.0281    0.9058   3.2053
                           1            508.3597     111.0021       250.1656   0.7009     3.8996 × 10⁻⁸     0.0147    0.9305   3.3217
                           2            973.7915       0.0002        0.0066    0.7066     7.1014 × 10⁻⁵     0.0185    0.9302   3.3017
                           3            376.8398       4.9588       204.2724   0.7066     2.6810 × 10⁻⁵     0.0226    0.9298   3.2550
                           4            229.4928      28.6409       164.7135   0.7167     7.1487 × 10⁻⁶     0.0320    0.9293   3.2004
    Germany                5            545.7995      21.5850       138.4819   0.7019     3.5717 × 10⁻⁶     0.0227    0.9289   3.2329
                           6            407.2556       1.7347       225.0588   0.6978     2.3474 × 10⁻⁵     0.0228    0.9281   3.2129
                           7            718.9136     109.1937       159.6677   0.6905     2.5158 × 10⁻⁵     0.0169    0.9280   3.2464
                           8            963.8368       0.0508       399.6251   0.6823     3.5494 × 10⁻⁵     0.0107    0.9277   3.2809
                           9            990.6250       0.0013       493.6234   0.6797     2.3706 × 10⁻⁵     0.0096    0.9273   3.2826
                           10           999.6469      19.6512        58.0628   0.6863     7.0825 × 10⁻⁵     0.0188    0.9268   3.2038

                                       3.2. Experimental Analysis of the Influence of Different Quarantine Measures to Mitigate the
                                       Spread of COVID-19
                                            This section mainly discusses the influence of implementing a quarantine with differ-
                                       ent intensities and different intervention times to mitigate the spread of COVID-19. The
                                       grid size represents the strength of the quarantine—that is, the corresponding quarantine
                                       measures became more stringent as the grid size became finer. We took the intervention
                                       time when Wuhan city issued a “city-wide closure” as the baseline (23 January 2020, 47th
                                       day), and set the grid size to 1000, 500, 250, 100, and 10 m, respectively (Figure 6A). Then,
                                       we fixed the grid size to 10 m and adjusted the intervention time to the 41st, 44th, 47th,
                                       50th, and 53rd days, respectively (Figure 6B). The average daily life radius of people was
                                       2000 m, which was based on the travel characteristics of Wuhan residents [56].
3           376.8398        4.9588        204.2724      0.7066   2.6810 × 10⁻⁵    0.0226         0.9298       3.2550
                                4           229.4928        28.6409       164.7135      0.7167   7.1487 × 10⁻⁶    0.0320         0.9293       3.2004
                                5           545.7995        21.5850       138.4819      0.7019   3.5717 × 10⁻⁶    0.0227         0.9289       3.2329
    Germany
                                6           407.2556        1.7347        225.0588      0.6978   2.3474 × 10⁻⁵    0.0228         0.9281       3.2129
                                7           718.9136       109.1937       159.6677      0.6905   2.5158 × 10⁻⁵    0.0169         0.9280       3.2464
ISPRS Int. J. Geo-Inf. 2021, 10, 480                                                                                                          13 of 27
                                8           963.8368        0.0508        399.6251      0.6823   3.5494 × 10⁻⁵    0.0107         0.9277       3.2809
                                9           990.6250        0.0013        493.6234      0.6797   2.3706 × 10⁻⁵    0.0096         0.9273       3.2826
                               10           999.6469        19.6512        58.0628      0.6863   7.0825 × 10⁻⁵    0.0188         0.9268       3.2038

                                                               (a)                                                   (b)

                                                               (c)                                                   (d)

                                       Figure 5.
                                       Figure   5. The number
                                                        number ofof newly
                                                                    newly reported
                                                                            reported cases
                                                                                      cases per
                                                                                            per day
                                                                                                 day without
                                                                                                      without any
                                                                                                               any interventions.
                                                                                                                    interventions. These
                                                                                                                                     These should
                                                                                                                                            should bebe
                                       listed as:
                                       listed as: (a) early U.K. data to simulate the free
                                                                                        free spread
                                                                                             spread ofof COVID-19;
                                                                                                         COVID-19; (b)
                                                                                                                     (b) early
                                                                                                                         early U.S.
                                                                                                                                U.S. data
                                                                                                                                     data to
                                                                                                                                           to simulate
                                                                                                                                              simulate
                                       the free
                                       the  freespread
                                                  spreadofofCOVID-19;
                                                             COVID-19; (c)(c) early
                                                                           early     Spanish
                                                                                 Spanish  datadata  to simulate
                                                                                                to simulate      the spread
                                                                                                            the free free spread   of COVID-19;
                                                                                                                             of COVID-19;           (d)
                                                                                                                                              (d) early
                                       early German
                                       German           data
                                                  data to    to simulate
                                                           simulate       the free
                                                                     the free       spread
                                                                               spread      of COVID-19.
                                                                                       of COVID-19.        Small
                                                                                                         Small    chart
                                                                                                                chart    section:The
                                                                                                                       section:   Thered
                                                                                                                                       redhistogram
                                                                                                                                            histogram
                                       represents the number of new early cases daily in each country, and the curve is the number of daily
                                       represents the number of new early cases daily in each country, and the curve is the number of
                                       daily new cases without any interventions. Big graph section: The different colored solid-line curve
                                       represents the number of daily new cases in Wuhan without any interventions under the different
                                       parameters. The red dotted-line curve shows the actual number of newly reported cases in Wuhan
                                       after calibration, and the purple dotted-line curve represents the actual number of newly reported
                                       cases in Wuhan. Here, the starting time of the X coordinate in Wuhan is 28 December 2019 [9].
ISPRS
                                                                                                                                                                                                                                                                                                                                                                                                                                                                                            ISPRS Int.

                                                                     B
                                                                                                                                                                                                                                                                                                                                                       A
                  Intervention time: day 41                                         Grid size: 10 m                                    Grid size: 100 m                                  Grid size: 250 m                                   Grid size: 500 m                              Free infected curve(1000 m)
                                                                                                                                                                                                                                                                                                                                                                                                                                                                                                  Int. J.

                                                                               Number of new reported cases per day                                                                                                                    Number of new reported cases per day                Number of new reported cases per day
                  Number of new reported cases per day                                                                           Number of new reported cases per day               Number of new reported cases per day

                                                                                                                                                                                                                                       0
                                                                                                                                                                                                                                           0.5
                                                                                                                                                                                                                                                 1
                                                                                                                                                                                                                                                     1.5
                                                                                                                                                                                                                                                           2
                                                                                                                                                                                                                                                               2.5
                                                                                                                                                                                                                                                                     3
                                                                                                                                                                                                                                                                         3.5
                                                                                                                                                                                                                                                                                          0
                                                                                                                                                                                                                                                                                              0.5
                                                                                                                                                                                                                                                                                                    1
                                                                                                                                                                                                                                                                                                        1.5
                                                                                                                                                                                                                                                                                                              2
                                                                                                                                                                                                                                                                                                                  2.5
                                                                                                                                                                                                                                                                                                                        3
                                                                                                                                                                                                                                                                                                                            3.5

                                                                               0
                                                                                         1
                                                                                                   2
                                                                                                             3

                                                                                   0.5
                                                                                             1.5
                                                                                                       2.5
                                                                                                                 3.5

                  0
                      0.2
                            0.4
                                  0.6
                                        0.8
                                              1
                                                  1.2
                                                         1.4
                                                                                                                                 0
                                                                                                                                     0.5
                                                                                                                                           1
                                                                                                                                               1.5
                                                                                                                                                     2
                                                                                                                                                         2.5
                                                                                                                                                               3
                                                                                                                                                                   3.5
                                                                                                                                                                                    0
                                                                                                                                                                                              1
                                                                                                                                                                                                        2
                                                                                                                                                                                                                  3

                                                                                                                                                                                        0.5
                                                                                                                                                                                                  1.5
                                                                                                                                                                                                            2.5
                                                                                                                                                                                                                      3.5
                                                                          1
                                                                                                                                                                                                                                                                                                                                                                                                                                                                                                       J. Geo-Inf.

                                                                         11

                                                                                                                                                                                                                                                                               × 10,000
                                                                                                                                                                                                                                                                                                                                  × 10,000

                                                                                                                      × 10,000

                                                          × 10,000
                                                                                                                                                                         × 10,000
                                                                                                                                                                                                                            × 10,000
                                                                         21
                                                                         31
                                                                                                                                                                                                                                                                                                                                                                                                                                                                                                          Geo-Inf. 2021,

                                                                         41
                                                                         51
                                                                                                                                                                                                                                                                                                                                                                                                                                                                                                                   2021, 10,

                                                                         61
                                                                                                                                                                                                                                                                                                                                             U.K.

                                                                         71
                                                                         81
                                                                                                                                                                                                                                                                                                                                                                                                                                                                                                                         10, 480

                                                                         91
                                                                         101
                                                                         111
                                                                         121
                                                                         131
                                                                         141

                                                                           1
                                                                          11
                                                                                                                                                                                                                                                                                                                                                                                                                                                                                                                             x FOR PEER REVIEW

                                                                          21
                                                                          31
                                                                          41
                                                                          51
                                                                          61
                                                                          71
                                                                          81
                                                                                                                                                                                                                                                                                                                                             U.S.

                                                                          91
                                                                         101
                                                                         111
                                                                         121
                                                                         131
                                                                         141

                                                                           1

Figure 6. Cont.
                                                                          11
                                                                          21
                                                                          31
                                                                          41
                                                                          51
                                                                          61
                                                                          71
                                                                          81
                                                                                                                                                                                                                                                                                                                                             Spain

                                                                          91
                                                                         101
                                                                         111
                                                                         121
                                                                         131
                                                                         141

                                                                           1
                                                                          11
                                                                          21
                                                                          31
                                                                          41
                                                                          51
                                                                          61
                                                                          71
                                                                          81
                                                                          91
                                                                                                                                                                                                                                                                                                                                             Germany

                                                                         101
                                                                         111
                                                                         121
                                                                         131
                                                                         141
                                                                                                                                                                                                                                                                                                                                                       The free spread curve of the number of people infected by COVID-19 in Wuhan estimated by the early data of the different countries
                                                                                                                                                                                                                                                                                                                                                                                                                                                                                            14
                                                                                                                                                                                                                                                                                                                                                                                                                                                                                            15 of
                                                                                                                                                                                                                                                                                                                                                                                                                                                                                               of 27
                                                                                                                                                                                                                                                                                                                                                                                                                                                                                                  28
ISPRS Int.
ISPRS Int. J.J. Geo-Inf.
                Geo-Inf. 2021   10, x480
                         2021,, 10,   FOR PEER REVIEW                                                                                                                                                                                                                                                                                                                                                            15 of
                                                                                                                                                                                                                                                                                                                                                                                                                 16 of 28
                                                                                                                                                                                                                                                                                                                                                                                                                       27

                                                                                     ×10,000
                                                                               1.4
                                        Number of new reported cases per day
        Intervention time: day 44

                                                                               1.2

                                                                                 1

                                                                               0.8

                                                                               0.6

                                                                               0.4

                                                                               0.2

                                                                                 0

                                                                                     ×10,000
                                                                               1.4
                                        Number of new reported cases per day
        Intervention time: day 47

                                                                               1.2

                                                                                 1

                                                                               0.8

                                                                               0.6

                                                                               0.4

                                                                               0.2

                                                                                 0

                                                                                     ×10,000
                                                                               1.4
                                        Number of new reported cases per day
        Intervention time: day 50

                                                                               1.2

                                                                                 1

                                                                               0.8

                                                                               0.6

                                                                               0.4

                                                                               0.2

                                                                                 0

                                                                                     ×10,000
                                                                               1.4
                                    Number of new reported cases per day
        Intervention time: day 53

                                                                               1.2

                                                                                1

                                                                               0.8

                                                                               0.6

                                                                               0.4

                                                                               0.2

                                                                                0
                                                                                                                                                                    1
                                                                                                                                                                        11
                                                                                                                                                                             21
                                                                                                                                                                                  31
                                                                                                                                                                                       41
                                                                                                                                                                                            51
                                                                                                                                                                                                 61
                                                                                                                                                                                                      71
                                                                                                                                                                                                           81
                                                                                                                                                                                                                91

                                                                                                                                                                                                                                                   1
                                                                                                                                                                                                                                                       11
                                                                                                                                                                                                                                                            21
                                                                                                                                                                                                                                                                 31
                                                                                                                                                                                                                                                                      41
                                                                                                                                                                                                                                                                           51
                                                                                                                                                                                                                                                                                61
                                                                                                                                                                                                                                                                                     71
                                                                                                                                                                                                                                                                                          81
                                                                                                                                                                                                                                                                                               91
                                                                                                                                                                                                                                                                                                    101
                                                                                                                                                                                                                                                                                                          111
                                                                                                                                                                                                                                                                                                                121
                                                                                                                                                                                                                                                                                                                      131
                                                                                                                                                                                                                                                                                                                            141

                                                                                                                                                                                                                                                                                                                                  1
                                                                                                                                                                                                                                                                                                                                      11
                                                                                                                                                                                                                                                                                                                                           21
                                                                                                                                                                                                                                                                                                                                                31
                                                                                                                                                                                                                                                                                                                                                     41
                                                                                                                                                                                                                                                                                                                                                          51
                                                                                                                                                                                                                                                                                                                                                               61
                                                                                                                                                                                                                                                                                                                                                                    71
                                                                                                                                                                                                                                                                                                                                                                         81
                                                                                                                                                                                                                                                                                                                                                                              91
                                                                                                                                                                                                                                                                                                                                                                                   101
                                                                                                                                                                                                                                                                                                                                                                                         111
                                                                                                                                                                                                                                                                                                                                                                                               121
                                                                                                                                                                                                                                                                                                                                                                                                     131
                                                                                                                                                                                                                                                                                                                                                                                                           141
                                                                                                                                                                                                                     101
                                                                                                                                                                                                                           111
                                                                                                                                                                                                                                 121
                                                                                                                                                                                                                                       131
                                                                                                                                                                                                                                             141
                                                                                         11
                                                                                              21
                                                                                                   31
                                                                                                        41
                                                                                                             51
                                                                                                                  61
                                                                                                                       71
                                                                                                                            81
                                                                                                                                 91
                                                                                     1

                                                                                                                                      101
                                                                                                                                            111
                                                                                                                                                  121
                                                                                                                                                        131
                                                                                                                                                              141

                                                                                                                                                                                                                                       Time/days

      Figure
      Figure 6.
              6. The
                  Thechange
                      changecurve
                              curveofofnewly
                                        newlyreported cases
                                               reported     perper
                                                        cases   dayday
                                                                    in Wuhan under
                                                                       in Wuhan    different
                                                                                under        quarantine
                                                                                       different        measures.
                                                                                                 quarantine       (Group
                                                                                                            measures.    (A)
                                                                                                                      (Group
      showed the change of infected curve under different grid sizes; Group (B) was the change of infected curve under differ-
      (A) showed the change of infected curve under different grid sizes; Group (B) was the change of infected curve under
      ent intervention times)
      different intervention times).

                                                                                                                                                  Figure
                                                                                                                                                  Figure 6A 6A shows
                                                                                                                                                                shows that that whatever
                                                                                                                                                                                 whatever the    the scale
                                                                                                                                                                                                      scale of of the
                                                                                                                                                                                                                  the free
                                                                                                                                                                                                                       free infection
                                                                                                                                                                                                                              infection curve
                                                                                                                                                                                                                                           curve of     COVID-19, it
                                                                                                                                                                                                                                                    of COVID-19,       it
                                                                                                                                            would    be  close   to  the   actual    epidemic      curve     of  Wuhan      with
                                                                                                                                            would be close to the actual epidemic curve of Wuhan with a decrease of grid size. The a  decrease     of grid    size. The
                                                                                                                                            changing
                                                                                                                                            changing trend
                                                                                                                                                         trend was
                                                                                                                                                                 was mainly
                                                                                                                                                                         mainly reflected
                                                                                                                                                                                   reflected in  in the
                                                                                                                                                                                                    the reduction
                                                                                                                                                                                                         reduction in   in the
                                                                                                                                                                                                                            the peak
                                                                                                                                                                                                                                 peak value,
                                                                                                                                                                                                                                        value, thethe shortening
                                                                                                                                                                                                                                                        shortening of of
                                                                                                                                            the
                                                                                                                                            the peak arrival time, and the epidemic duration. No matter what kind of free
                                                                                                                                                 peak   arrival    time,   and   the    epidemic      duration.      No    matter   what    kind     of        infected
                                                                                                                                                                                                                                                         free infected
                                                                                                                                            state
                                                                                                                                            state was
                                                                                                                                                    was used,
                                                                                                                                                         used, thethe curves
                                                                                                                                                                        curves barely
                                                                                                                                                                                 barely changed
                                                                                                                                                                                            changed in   in the    500-m grid.
                                                                                                                                                                                                              the 500-m      grid. This
                                                                                                                                                                                                                                    This is   mainly because
                                                                                                                                                                                                                                           is mainly      because thethe
                                                                                                                                            spread
                                                                                                                                            spread of COVID-19 was easily affected by the flow of the population and the population
                                                                                                                                                     of COVID-19         was   easily    affected    by  the   flow   of  the  population      and   the   population
                                                                                                                                            distribution,
                                                                                                                                            distribution, and and using
                                                                                                                                                                     using aa 500-m
                                                                                                                                                                                500-m grid grid did
                                                                                                                                                                                                  did little
                                                                                                                                                                                                       little toto limit
                                                                                                                                                                                                                   limit the
                                                                                                                                                                                                                           the contact
                                                                                                                                                                                                                                contact of     crowds. Therefore,
                                                                                                                                                                                                                                           of crowds.       Therefore,
                                                                                                                                            quarantine
                                                                                                                                            quarantine measures
                                                                                                                                                            measures must must reach
                                                                                                                                                                                  reach aa sufficient
                                                                                                                                                                                              sufficient intensity
                                                                                                                                                                                                            intensity to to be
                                                                                                                                                                                                                             be effective,
                                                                                                                                                                                                                                effective, especially
                                                                                                                                                                                                                                              especially the the home
                                                                                                                                                                                                                                                                   home
                                                                                                                                            quarantine
                                                                                                                                            quarantine state
                                                                                                                                                           state (10-m
                                                                                                                                                                   (10-m grid).
                                                                                                                                                                            grid).
                                                                                                                                                  From
                                                                                                                                                  From the theperspective
                                                                                                                                                                perspectiveofofthe     thelevel  of severity
                                                                                                                                                                                             level   of severity of different
                                                                                                                                                                                                                     of differentfree free
                                                                                                                                                                                                                                       infected    curves,
                                                                                                                                                                                                                                             infected         the peak
                                                                                                                                                                                                                                                           curves,   the
                                                                                                                                            value   of infected     humans,      the   time    of  peak    arrival,   and    the
                                                                                                                                            peak value of infected humans, the time of peak arrival, and the duration of COVID-   duration     of  COVID-19        were
                                                                                                                                            greatly
                                                                                                                                            19 werereduced
                                                                                                                                                       greatly for     the curve
                                                                                                                                                                   reduced           under
                                                                                                                                                                               for the         an effective
                                                                                                                                                                                           curve    under anquarantine.          This impliesThis
                                                                                                                                                                                                                   effective quarantine.           that implies
                                                                                                                                                                                                                                                          quarantines
                                                                                                                                                                                                                                                                    that
                                                                                                                                            are  a very effective
                                                                                                                                            quarantines               epidemic
                                                                                                                                                             are a very     effectiveprevention
                                                                                                                                                                                         epidemicand         control measure,
                                                                                                                                                                                                       prevention       and control  especially
                                                                                                                                                                                                                                         measure,   forespecially
                                                                                                                                                                                                                                                         viruses withfor
                                                                                                                                            high
                                                                                                                                            virusesinfectivity,
                                                                                                                                                      with high   such    as SARS-CoV-2.
                                                                                                                                                                     infectivity,                 This is mainlyThis
                                                                                                                                                                                      such as SARS-CoV-2.              because     the effect
                                                                                                                                                                                                                             is mainly           of a the
                                                                                                                                                                                                                                           because      quarantine
                                                                                                                                                                                                                                                             effect ofisa
                                                                                                                                            to maximizeisthe
                                                                                                                                            quarantine             protectionthe
                                                                                                                                                              to maximize         of protection
                                                                                                                                                                                      uninfectedof    humans
                                                                                                                                                                                                        uninfected by limiting
                                                                                                                                                                                                                         humansthe   by activities
                                                                                                                                                                                                                                         limiting the of the   popula-
                                                                                                                                                                                                                                                           activities of
                                                                                                                                            tion. However, although
                                                                                                                                            the population.       However,    thealthough
                                                                                                                                                                                    curve with  theacurve
                                                                                                                                                                                                      relatively
                                                                                                                                                                                                               withsmall     number
                                                                                                                                                                                                                     a relatively       of infected
                                                                                                                                                                                                                                      small   number     humans     also
                                                                                                                                                                                                                                                            of infected
                                                                                                                                            decreased
                                                                                                                                            humans also   with  the increase
                                                                                                                                                              decreased       with in the
                                                                                                                                                                                       gridincrease
                                                                                                                                                                                              size, thein scale
                                                                                                                                                                                                             gridofsize,
                                                                                                                                                                                                                     reduction     wasof
                                                                                                                                                                                                                           the scale      much     smaller.
                                                                                                                                                                                                                                            reduction       wasIt seems
                                                                                                                                                                                                                                                                  much
                                                                                                                                            smaller. It seems
                                                                                                                                            unnecessary      to useunnecessary
                                                                                                                                                                      this when the     toepidemic
                                                                                                                                                                                            use this when
                                                                                                                                                                                                        situationthe is
                                                                                                                                                                                                                      epidemic
                                                                                                                                                                                                                         relatively situation    is relatively
                                                                                                                                                                                                                                       mild, because               mild,
                                                                                                                                                                                                                                                           strict quar-
                                                                                                                                            becauserequire
                                                                                                                                            antines    strict quarantines
                                                                                                                                                                the investment  require      the investmentfinancial,
                                                                                                                                                                                        of unimaginable            of unimaginable
                                                                                                                                                                                                                               material financial,
                                                                                                                                                                                                                                           and human     material   and
                                                                                                                                                                                                                                                            resources;
                                                                                                                                            human
                                                                                                                                            this has resources;      this has been
                                                                                                                                                      been demonstrated                  demonstrated
                                                                                                                                                                                   in South     Korea andinJapan  South[5].Korea and Japan [5].
ISPRS Int. J. Geo-Inf. 2021, 10, x FOR PEER REVIEW                                                                                                                                                             17 of 28

ISPRS Int. J. Geo-Inf. 2021, 10, 480                                                                                                                                                                            16 of 27
                                                                                                             Figure 6B shows that the epidemic curve deviated from the actual curve of Wuhan
                                                                                                      with a delay in the intervention time. The changing trend is mainly reflected in the in-
                                                                                                      crease in peak value, the extension of the peak arrival time, and the epidemic duration.
                                                                                                      Compared
                                                                                                             Figureto6Bthe   actual
                                                                                                                         shows   thatepidemic
                                                                                                                                       the epidemiccurve   in Wuhan,
                                                                                                                                                        curve   deviatedthe fromnumber     of new
                                                                                                                                                                                   the actual  curveconfirmed
                                                                                                                                                                                                      of Wuhancaseswith
                                                                                                      per   day  more   than  doubled     by  postponing      for just  one    week
                                                                                                       a delay in the intervention time. The changing trend is mainly reflected in theto isolate. This  also  empha-
                                                                                                                                                                                                          increase    in
                                                                                                      sizes   that quarantine
                                                                                                      peak value,    the extensionmeasures     needarrival
                                                                                                                                      of the peak      to be time,
                                                                                                                                                               implemented        in a timely
                                                                                                                                                                     and the epidemic            manner
                                                                                                                                                                                            duration.      to achieve
                                                                                                                                                                                                        Compared      to
                                                                                                      satisfactory   results. curve in Wuhan, the number of new confirmed cases per day more than
                                                                                                       the actual epidemic
                                                                                                       doubled by postponing for just one week to isolate. This also emphasizes that quarantine
                                                                                                      3.3.  Experiment
                                                                                                       measures    needAnalysis     of the Influence
                                                                                                                          to be implemented        in aoftimely
                                                                                                                                                           Different Self-Protection
                                                                                                                                                                  manner     to achieveMeasures     to Mitigate
                                                                                                                                                                                           satisfactory  results.the
                                                                                                      Spread of COVID-19
                                                                                                       3.3. Experiment
                                                                                                             This sectionAnalysis
                                                                                                                            mainlyofdiscusses
                                                                                                                                        the Influence   of DifferentofSelf-Protection
                                                                                                                                                   the influence       self-protection   Measures
                                                                                                                                                                                            measuresto Mitigate   the
                                                                                                                                                                                                       under differ-
                                                                                                      Spread of COVID-19
                                                                                                      ent proportions of the effective self-protection of people and quarantines of different in-
                                                                                                             Thistosection
                                                                                                      tensities             mainly
                                                                                                                     mitigate        discusses
                                                                                                                                the spread     of the influenceWe
                                                                                                                                                   COVID-19.       of self-protection     measurestime
                                                                                                                                                                       used the intervention          underof different
                                                                                                                                                                                                               when a
                                                                                                      group of pneumonia cases with an unknown etiology were first published byintensities
                                                                                                      proportions     of the effective   self-protection    of  people   and   quarantines    of different   Wuhan’s
                                                                                                       to mitigateHealth
                                                                                                      Municipal      the spread    of COVID-19.
                                                                                                                             Commission                We used(11
                                                                                                                                              as the baseline      theJanuary
                                                                                                                                                                        intervention      timeday)
                                                                                                                                                                                  2020, 35th    of when    a group
                                                                                                                                                                                                     and set  the pro-of
                                                                                                      pneumonia       cases  with   an  unknown      etiology    were   first  published    by  Wuhan’s
                                                                                                      portion of people using self-protection measures as 0.1, 0.2, 0.3, and 0.4 of the total number       Municipal
                                                                                                       Health Commission as the baseline (11 January 2020, 35th day) and set the proportion of
                                                                                                      of  humans (Figure 7A). Then, we adjusted the proportion of the population using self-
                                                                                                      people using self-protection measures as 0.1, 0.2, 0.3, and 0.4 of the total number of humans
                                                                                                      protection measures ( ε ) to 0.1, 0.2, 0.3, and 0.4 under grid sizes of 500, 250, 100, and 10 m,
                                                                                                      (Figure 7A). Then, we adjusted the proportion of the population using self-protection
                                                                                                      respectively (Figure 7B).
                                                                                                       measures (ε) to 0.1, 0.2, 0.3, and 0.4 under grid sizes of 500, 250, 100, and 10 m, respectively
                                                                                                             Figure 7A shows that the free infected curve of COVID-19 gradually moved further
                                                                                                      (Figure 7B).
                                                                                                      away from the actual infected curve of Wuhan as the proportion of people taking self-
                                                                                                             Figure 7A shows that the free infected curve of COVID-19 gradually moved further away
                                                                                                      protection measures increased. The changing trend is mainly reflected in the delay time
                                                                                                       from the actual infected curve of Wuhan as the proportion of people taking self-protection
                                                                                                      of a peak. However, the effect on reducing the peak value was mild. If we want to achieve
                                                                                                       measures increased. The changing trend is mainly reflected in the delay time of a peak. However,
                                                                                                      an ideal result, the amount of needed self-protection resources is unimaginable. At the
                                                                                                       the effect on reducing the peak value was mild. If we want to achieve an ideal result, the amount
                                                                                                      same time, self-protection measures do not fundamentally cut off the path of spread of
                                                                                                       of needed self-protection resources is unimaginable. At the same time, self-protection measures
                                                                                                      the virus, but only reduces the probability of infection. Therefore, we suggest that the role
                                                                                                       do not fundamentally cut off the path of spread of the virus, but only reduces the probability
                                                                                                      of
                                                                                                       of taking  self-protection
                                                                                                          infection. Therefore, wemeasure        is mainly
                                                                                                                                       suggest that    the roletoof
                                                                                                                                                                  delay
                                                                                                                                                                    taking theself-protection
                                                                                                                                                                                arrival of an measure
                                                                                                                                                                                                epidemicis peak
                                                                                                                                                                                                            mainly andto
                                                                                                      to  strive for more   time   for  the government       to  prepare.
                                                                                                       delay the arrival of an epidemic peak and to strive for more time for the government to prepare.

            A The free spread curve of the number of people infected by COVID-19 in Wuhan estimated by the early data of the different countries.
                                                                                               U.K.                          U.S.                          Spain                         Germany

                                                                                     ×10,000
                                                                               3.5
                                        Number of new reported cases per day
                  Free infected curve

                                                                                3

                                                                               2.5

                                                                                2

                                                                               1.5

                                                                                1

                                                                               0.5

                                                                                0

                                                                                     ×10,000
             Proportion of self-protection

                                                                               3.5
              Number of new reported cases per day

                                                                                3
                               d 01

                                                                               2.5

                                                                                2

                                                                               1.5

                                                                                1

                                                                               0.5

                                                                                0

                                                                                                                                    Figure 7. Cont.
You can also read