Analysis of productivity in the Health Care Centers of the Community of Madrid (Spain) 2015-2017 - UPO
←
→
Page content transcription
If your browser does not render page correctly, please read the page content below
REVISTA DE MÉTODOS CUANTITATIVOS PARA LA
 ECONOMÍA Y LA EMPRESA (31). Páginas 384-396.
 Junio de 2021. ISSN: 1886-516X. D.L: SE-2927-06.
 www.upo.es/revistas/index.php/RevMetCuant/article/view/4271

 Analysis of productivity in the Health Care
 Centers of the Community of Madrid (Spain)
 2015-2017

 De Jorge-Moreno, Justo
 Dpto. Economía y Dirección de Empresas. Universidad de Alcalá (Madrid)
 Correo electrónico: justo.dejorge@uah.es

 González Santos, Arancha
 Dpto. Economía y Dirección de Empresas. Universidad de Alcalá (Madrid)
 Correo electrónico: arancha.gonzalez@uah.es

 Vegas Melero, José Jesús
 Dpto. Economía y Dirección de Empresas. Universidad de Alcalá (Madrid)
 Correo electrónico: jose.vegas@uah.es

 Cepeda Olmedo, Martín
 Dpto. Economía y Dirección de Empresas. Universidad de Alcalá (Madrid)
 Correo electrónico: martin.cepeda@uah.es

 ABSTRACT
The main objective of this work has focused on extending the existing literature
on the analysis of total factor productivity of the Health Care Centers (HCC) of
the Community of Madrid (Spain) in the period 2015-2017, with two important
contributions; the application and comparison of the Malmquist indices with two
robust methodologies such as the Hicks-Moorsteen and Färe Primont indices
which, except for error, have not been previously used in this sector and the
regional scope, which has been scarcely analyzed. The main results reveal
decreases in HC productivity due to the three proposed methodologies. These
decreases range between 4.90% and 0.25% for the Färe-Primont and Hicks-
Moorsteen indices respectively between 2015/17 in average terms. Convergence
analyses confirm that this takes place in the case of the Malmquist and Hicks-
Moorsteen proposals.

Keywords: productivity, Hicks-Moorsteen Index, Färe-Primont Index, Health Centers.
JEL classification: H51; L23; C61.
MSC2010: 90B30; 90B50.

 Artículo recibido el 26 de julio de 2019 y aceptado el 28 de enero de 2020.

 384
Análisis de la productividad en los Centros
 Sanitarios de la Comunidad de Madrid (España)
 2015-2017

 RESUMEN

El objetivo principal de este trabajo se ha enfocado en extender la literatura
existente sobre el análisis de la productividad total de los factores, de los
Centros Sanitarios de la Comunidad de Madrid en el periodo 2015-2017,
con dos importantes contribuciones, la aplicación y comparación de los
índices de Malmquist con dos metodologías robustas, los índices de Hicks-
Moorsteen y Färe Primont que salvo error no han sido previamente
utilizadas en este sector y el ámbito regional, que ha sido escasamente
analizado. Los principales resultados revelan disminuciones de la
productividad de los CS por las tres metodologías propuestas. Estas
disminuciones oscilan entre 4.90% y 0.25% para los índices de Färe-
Primont y de Hicks-Moorsteen respectivamente entre 2015/17 en términos
medios. Los análisis de convergencia confirman que esta tiene lugar en el
caso de las propuestas de Malmquist y Hicks-Moorsteen.

Palabras clave: productividad, índice de Hicks-Moorsteen, índice de Färe-
Primont, centros de salud.
Clasificación JEL: H51; L23; C61.
MSC2010: 90B30; 90B50.

 385
1. Introduction.

Spain's healthcare system ranks third in the world, between 200 countries behind Hong Kong and
Singapore in terms of efficiency (Vieira, 2018). To hold this position suggests that the Spanish
Health System (hereinafter SHS), in particular, manages its resources under criteria of
maximizing the quantity and quality of health (Romano & Choi, 2016).

 The competitive situation of the SHS is a challenge, considering the economic crisis and
consequent budget cuts and political decisions on welfare (Mateos & Penedés, 2013). As
mentioned, Segura (2014) the restrictive measures carried out in terms of welfare and health
policies, could have had negative consequences on public health management. In this sense, the
media have reflected the current state of the SHS. For example, Flores (2019) addresses the lack
of investment in technological renewal and innovation and its erosion in the SHS. It is surprising
that, on the one hand, Spain is among the most efficient countries and, at the same time, ranks
18th out of the 35 OECD countries in terms of public health expenditure. In addition, Spain
allocates 6.3% of GDP, far from 7.6%, 9.5% and 9.6% from United Kingdom, France, and
Germany respectively.

 Regarding the Health Care Centers (hereinafter HCC) within SHS, as mentioned García-
Latorre et al. (1996) these resemble multi-product organizations where the objective to be fulfilled
is the maximization of social efficiency, bearing in mind the criterion of "equity". The analysis of
efficiency and productivity in the SHS has received significant attention, as evidenced by the
proliferation of studies in recent years. Authors such as Pelone et al. (2015), Barnum et al. (2016)
or Vafaee et al. (2018), conduct interesting reviews of international literature on the presence of
non-parametric DEA methodologies in the health sector. Likewise, these authors collect the use
of output and input variables, as well as the units of analysis used. In relation to the HCC, they
have been studied at a national level, among others by García-Latorre et al. (1996) in Aragón
(Zaragoza), Puig-Junoy (2000) in Aragón (Zaragoza), Huesca, Navarra and Cataluña, Cordero-
Ferrera et al. (2011) in Extremadura, Cordero-Ferrera et al. (2016) in País Vasco, and Romano
and Choi (2016) in Cataluña (Barcelona).

 In this context, this work focuses its spatial scope on the Community of Madrid, using the
HCCs as analysis, in the period 2015-2017. The main objective is to extend the existing literature
on the analysis of total factor productivity (hereinafter TFP) with two important contributions: 1)
The application and comparison of the Malmquist index (hereinafter MALM), with two robust
methodologies using the TFP index, Hicks-Moorsteen (hereinafter HMTFPC) & Färe Primont
(FPTFPC), which except for errors have not been previously used in this sector; 2) The regional
level, which has been scarcely analyzed. In addition, measures of quality of care are incorporated
into the analysis.

 The work is organized in the following way. In Section 2, the data and methodology are
presented. Section 3 shows the results. The fourth section presents the main conclusions.

2. Data and methodologies.
2.1. Data.
The outputs and inputs have been obtained from the Observatory of the Madrid Health Service
(http://observatorioresultados.sanidadmadrid.org/AtencionPrimariaLista.aspx) and supported by
literature (see Cordero et al., 2016). Specifically, the outputs include overall customer satisfaction,
morbidity, and avoidable hospitalization as a percentage. These two variables have been
calculated as a distribution proportional to each HCC, since the values were assigned to the
hospitals belonging to them. The inputs in physical or economic units are the health personnel
and the overall pharmaceutical expenditure per user. Table 1 shows the descriptive statistics.

 386
Table 1. Descriptive statistics.
 2015-2017
 Variable
 Mean SD
 Customer satisfaction (%) 0.9029 0.0471
 Morbidity (%) 0.7317 0.0004
 Avoidable hospitalization (%) 0.0107 0.0078
 Health personnel (N. of professionals) 32.689 12.279
 Pharmaceutical expenditure per user euros) 11.308 0.6610
 Source: Prepared by the authors based on the Observatory of the Health Service of Madrid.

2.2. Methodologies.
As mention Martinez-Cillero and Thorne (2019), the MALM was initially proposed in the
influential article by Caves, Christensen and Diewert (1982), and several authors have provided
decompositions of TFP based on this index (Färe et al., 1994; Balk, 2001; Lovell, 2003). Although
MALM is widely applied, it faces two important limitations. First, the MALM is not
multiplicatively complete since it cannot be expressed as a relationship between a MALM output
quantity index and a MALM (O'Donnell, 2008). Because of this, O'Donnell (2008) suggests that
it cannot be satisfactorily broken down into significant technical changes, efficiency changes or
scale efficiency change components. Second, the MALM does not satisfy transitivity (O'Donnell,
2011). In this sense, authors such as Russell (2018) mention that when comparing the MALM and
HMTFPC (or FPTFPC) indexes, the former is a measure of technological change (change in the
production frontier) while the latter is a (broader) measure of change in TFP (incorporating the
effects of movement along the frontier as well as change in the same) (Grifell-Tatjé & Lovell,
1995).

 In this paper, in line with O´Donnell (2011) to avoid any restrictive and empirically proven
assumptions about the technology, the MALM, HMTFPC and FPTFPC indexes are estimated
using VRS LPs that allow both technical progress and regression. According to this author, the
mathematical approach of these three indexes is the one included in Table 2, where q, x, t, s are
the quantities of output, input, and time references respectively (for further details see O´Donnell,
2011).

 Table 2. Productivity index for multilateral and multi-temporal comparisons.

 Malmquist Hicks-Moorsteen Färe-Primont
 Output
 aggregator Q(q)= Do (xit, q, t) Q(q)=[Do(xhs, q, s)Do(xit, q, t)]1/2 Q(q)= Do (xo, q, to)
 Function [Eq 1.1] [Eq 1.2] [Eq 1.3]
 Intput
 aggregator X(x) = Di (x, qit, t) X(x)=[DI (x, qhs, s)DI (x, qit, t)]1/2 X(x) = DI (x, qo, to)
 function [Eq 2.1] [Eq 2.2] [Eq 2.3]
Productivity MFPhs, it = MFPhs,it = MFPhs, it =
 Index ( , , ) ( ℎ , , ) ( ℎ , , ) ( , , ) ( , , ) ( ℎ , , )
 �
 ( , ℎ , ) ( , , ) ( ℎ , ℎ , ) ( , ℎ , ) ( , ℎ , ) ( , , )

 ( ℎ , ℎ , ) ( ℎ , , ) 1/2
 �
 ( , ℎ , ) ( , , )
 [Eq 3.1] [Eq 3.2] [Eq 3.3]

 Source: O´Donnell (2011).

 387
2.3. Comparison of productivity distributions and Convergence.
Comparison of productivity index distributions will be performed using the Kolmogorov-Smirnov
test (KS) (and the graphical function of distributions) and kernel density functions. Finally, a
classical convergence regression analysis will be applied, together with a dynamic convergence
analysis by means of stochastic kernels.

 As suggested by Delgado and Fariñas (2002), the application of the KS test allows us to
test the stochastic dominance among the empirical distributions of the HC groups being
compared. F and G denote the cumulative distribution functions associated with the normalized
efficiency corresponding to two groups of HCC to be compared. The stochastic domination of G
over F implies that F(x) ≥ G(x) ∀ x ϵ ℜ with strict inequality for some x. The KS test is appropriate
in this case, as it does not require a specific distribution family. The KS test of stochastic
domination of G over F can be formulated as:

 H0: F(x) - G(x) ≥ 0 ∀ x ϵ ℜ < versus (4)

 H1: F(x) - G(x) < 0 ∀ x ϵ ℜ

 To obtain more complete results, the convergence processes will be analyzed in two
different ways, for HCC. Firstly, the proposal of the classic of β-convergence Barro and Sala-i-
Marti (1992) will be used. This approach is based on analyzing the trend of HCC with relatively
low initial levels of TFP to grow relatively faster than the remaining HCC.

 The regression proposed in equation 5 (HMTFPC, MALM, FPTFPC), allows to determine
the mentioned process, observing the negative sign and the statistical significance of the
parameter β.

 1 HMTFPC +1
 Ln ∑ −1
 =1 � ��
 � = + HMTFPC + (5)
 −1 HMTFPC

 where HMTFPC (or MALM, FPTFPC) & HMTFPC +1 is the productivity index in
2015/16 and 2015/17 respectively. β is the parameter to estimate to measure the convergence
process.

 The classical convergence analysis proposed above is sufficiently informative. However,
some authors such as Quah (1997) mention some drawbacks in using this type of methodology
due to the lack of information about the internal dynamics of the distribution, since it only picks
up some moments of it. In this sense, the use of kernel density functions is usually the most
common, to visualize the external form of the distribution. Since efficiency distributions are not
normal, the application of these functions makes it possible to avoid important features that might
arise. The non-parametric approach, which will be shown below, requires choosing a method to
smooth the data. The chosen method is usually kernel smoothing (Scott, 1992).

 To capture intradistributional changes or movements, transition matrices could be applied.
However, this methodology implies that the results depend on the number and amplitude of the
intervals considered. For this reason, authors such as Quah (1997), Stokey and Lucas (1989),
prefer to analyze the dynamics within the distribution by means of a continuous approximation
based on the use of stochastic kernels, which are nothing more than the equivalent of a transition
matrix with a number of intervals that tends to infinity. It is therefore a graphic way of observing
the changes, which will also be presented in Section 3.

 388
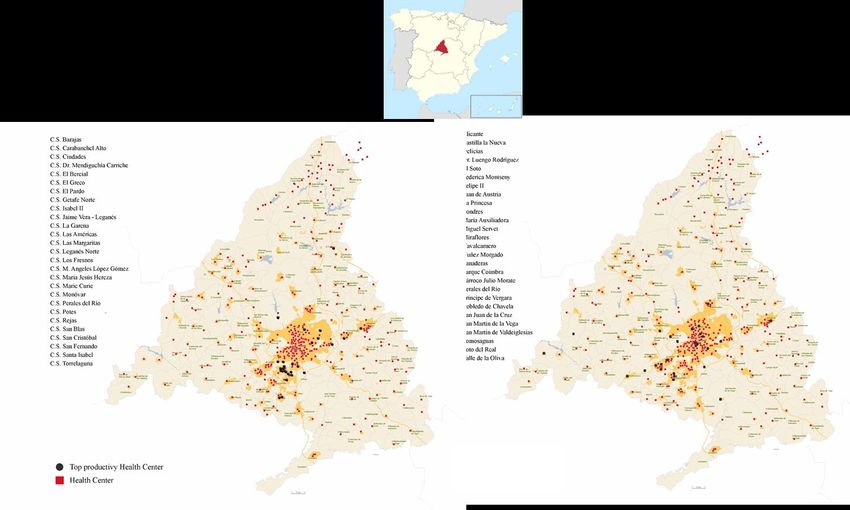
3. Results.

 This section shows the results obtained by applying the three techniques included in the
 methodologies section. Initially, the average and median values of the output and input variations
 are presented, as well as the productivity indexes and their components, as reflected in Table 3.
 Subsequently, comparative analyses of the distributions of the productivity indexes are
 performed. Finally, the convergence analysis is carried out.

 Table 3. Results of the Malmquist, Hicks-Moorsteen & Färe-Primont indexes.

 Malmquist Hicks-Moorsteen Färe-Primon

Component Period Median Mean SD Median Mean SD Median Mean SD
Output change 2015/2016 1.0000 0.9989 0.0068 1.0003 1.0025 0.0143 0.9961 0.9944 0.0077
 2015/2017 1.0000 0.9998 0.0055 1.0005 1.0000 0.0223 0.9961 0.9944 0.0074
Input change 2015/2016 1.0000 1.0000 0.0010 1.0103 1.0102 0.0131 1.0484 1.0430 0.0603
 2015/2017 1.0000 1.0000 0.0004 1.0025 1.0026 0.0118 1.0507 1.0457 0.0610
MALM/HMTFPC/FP 2015/2016 0.9908 0.9918 0.0172 0.9903 0.9924 0.0197 0.9497 0.9534 0.0568
 2015/2017 1.0003 1.0000 0.0226 1.0001 0.9974 0.0252 0.9459 0.9510 0.0573
Techn. change 2015/2016 0.9782 0.9772 0.0099 0.9785 0.9787 0.0113 0.9869 0.9869 0.0000
 2015/2017 1.0064 1.0057 0.0080 1.0075 1.0038 0.0130 0.9902 0.9902 0.0000
Efficiency change 2015/2016 1.0138 1.0149 0.0206 1.0103 1.0140 0.0256 0.9624 0.9661 0.0576
 2015/2017 0.9943 0.9943 0.0239 0.9957 0.9937 0.0279 0.9552 0.9604 0.0579
 Source: Own elaboration.

 Rows 1 and 2 show the output variations, while rows 3 and 4 show the input variations.
 Rows 5 and 6 show the values of the MALM, HMTFPC and FPTFPC index. In general, the values
 of the productivity index show levels lower than 1, for the two subperiods. In the case of MALM
 and HMTFPC there is a timid growth in the case of the median. These results take place, before
 generally positive variations of the inputs (rows 3 and 4) for HMTFPC and FPTFPC and increases
 in the outputs (rows 1 and 2) for HMTFPC and decreases for FPTFPC. Productivity decreases are
 a consequence of both TECHCH and EFFCH, as shown in rows 7 to 10. The FPTFPC
 methodology shows the greatest deterioration in productivity.

 Figure 1 shows the spatial distribution of the ranking of the 25 top HCC (black dots)
 analyzed according to FPTFPC and HMTFPC parts left and right respectively. There are no
 coincidences in the hierarchical order of the productivity levels of the two methodologies. Figure
 2 and Table 3 show the correlation between the MALM and HMTFPC indexes and the difference
 with the FPTFPC index for 2015/2017 (in the case of 2015/16 the patterns are similar).

 389
Figure 1. Spatial distribution of the 25 top HCC according to the HMTFPC and FPTFPC methodology.

 Source: http://centrossanitarios.sanidadmadrid.org/, Wikipedia and own elaboration.

 390
Figure 2. Dispersion diagrams of productivity index.

 hmtfpc_15_17

 fptfpc_15_17

 malm15_17

 Source: Own elaboration.

 Table 3 shows the high and significant correlation between the HMTFPC and MALM indexes
and the no correlation between these and FPTFPC.

 Table 3. Correlations between productivity index.

 hmtfpc_15_17 fptfpc_15_17 malm15_17
 hmtfpc_15_17 0.0673 0.9274
 (262) (262)
 0.2780 0.0000
 fptfpc_15_17 0.0673 0.0356
 (262) (262)
 0.2780 0.5663
 malm15_17 0.9274 0.0356
 (262) (262)
 0.0000 0.5663
 Correlation
 (Sample size)
 PValue
 Source: Own elaboration.

3.1. Comparison of Distributions, Kernel Density Functions and Convergence.

Figure 3 shows the kernel density distributions in the left column and the comparison and dominance
analyses in the right column. The results shown through the kernel distributions indicate that
productivity of HMTFPC and MALM of the subperiod 2015/17 is shifted ahead of the subperiod
2015/16, denoting convergence. In the case of FPTFPC, no changes occur. Likewise, the 2015/17
productivity distribution dominates the 2015/16 productivity distribution in HMTFPC and MALM as
shown in the graphs in the right-hand column of Figure 3. In the case of FPTFPC distributions, there is
no dominance.

 391
Figure 3. Kernel distributions and statistical dominance.

 Kernel density(2015/16-2015/17) Comparison of MALM distributions

 25
 1
 20

 0.8
 15

 0.6

 proportion
 10

 0.4
 5

 malm15_16
 0.2 malm15_17
 0

 .9 .95 1 1.05
 Malmquist Productivity Index
 0
 kdensity malm15_16 kdensity malm15_17
 0.93 0.96 0.99 1.02 1.05 1.08

 Kernel density (2015/16-2015/17) Comparison of HMTFPC distributions
 25

 1
 20

 0.8
 15

 0.6

 proportion
 10

 0.4
 5

 hmtfpc_15_16
 0.2 hmtfpc_15_17
 0

 .9 .95 1 1.05 1.1
 Hicks Moorsteen Productivity Index
 0
 kdensity hmtfpc_15_16 kdensity hmtfpc_15_17 0.9 0.93 0.96 0.99 1.02 1.05 1.08

 Kernel density (2015/16-2015/17) Comparison of FPTFPC distributions
 8

 1

 0.8
 6

 0.6
 proportion
 4

 0.4
 2

 fptfpc_15_16
 0.2 fptfpc_15_17
 0

 .8 .9 1 1.1 1.2
 Färe Primont Productivity Index
 0
 kdensity fptfpc_15_16 kdensity fptfpc_15_17
 0.84 0.94 1.04 1.14 1.24

 Source: Own elaboration.

 Table 4 shows the tests and statistical significance.

 Table 4. Kolmogorov-Smirnov statistical dominance test.

 2015/16 vs 2015/17 KS test Pvalue
 Malmquist 0.2405 0.0000
 Hicks-Moorsteen 0.2328 0.0000
 Färe-Primont 0.0458 0.9340
 Source: Own elaboration

 We begin with β convergence. The idea is to determine if the trend of the HC with lower
productivity levels, grow faster than the others, as already commented. The results of Table 5 show that
coefficients -0.2638 and -0.2611 are significant at 1% for MALM and HMTFPC respectively, indicating
that the least productive HC of each group in the initial subperiod, in general, have obtained productivity
growths than most of the HC in that subperiod.

 392
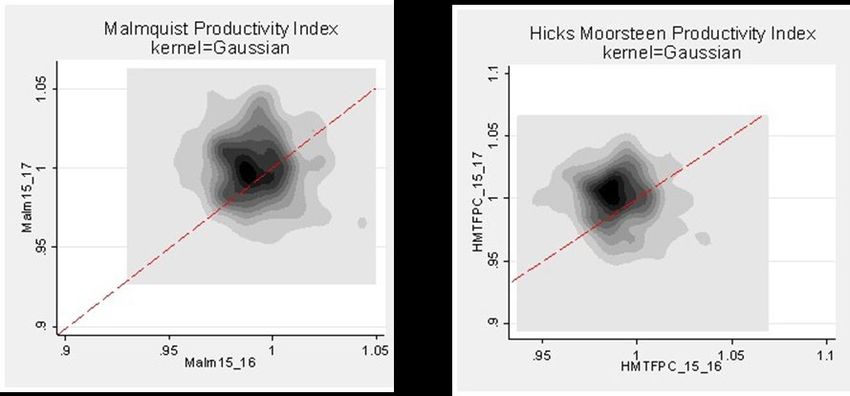
Table 5. Regression analysis of productivity index to the initial 2015/16.

 β-coefficient
 cons bootstrap Std. Err. Adj R2
 LnMALM -0.0022 -0.2638** 0.0372
 (0.0016) (0.0838)
 LnHMTFPC -0.0045 -0.2611** 0.0409
 (0.0017) (0.0791)
 LnFPTFPC -0.0031 0.0988 0.9570
 (0.0009) (0.0130)
 ** significant at the 1% level
 CInf: Conventional inference. Inference based on non-corrected var-cov Matrix
 BInf: Bootstrapping inference. Inference based on varcov, corrected by Bootstrap method (L = 2000)
 Source: Own elaboration.

 Finally, Figure 4 shows the convergence made through stochastic kernels according to the
contour graphics approach. As can be seen, for the MALM and HMTFPC methodologies the probalistic
mass and therefore the intradistributional changes are mostly located above the diagonal, confirming
convergence. Whereas with the FPTFPC methodology, the probalistic mass is placed on the diagonal,
confirmed stagnation.

 Figure 4. Stochastic kernels: contour plot.

 Source: Own elaboration.

 393
4. Conclusions.

A productivity analysis has been carried out from a public database on HC in the Community of Madrid,
the capital of Spain. The main objective of this work has focused on extending the existing literature,
on the analysis of total factor productivity, with two important contributions: 1) The application and
comparison of two robust methodologies, by means of the index, of total factor productivity of Hicks-
Moorsteen & Färe Primont which, except for error, have not been previously used in this sector; 2) The
regional scope, which has been scarcely analyzed.

 The main results reveal decreases in HCC productivity due to the three proposed methodologies.
These decreases range between 4.90% and 0.25% for the Färe-Primont & Hicks-Moorsteen index
respectively between 2015/17 in average terms. Convergence analysis confirm that this takes place in
the case of the Malmquist & Hicks-Moorsteen proposals.

 The health budget in Spain is approximately 43% in three regions, where the Community of
Madrid is located. The health budget of Madrid in terms of public expenditure per inhabitant is among
the three lowest in Spain, in the period of analysis studied. In terms of public policy recommendations
and managerial decisions, it should be mentioned that the consequences of the crisis, in terms of higher
levels of poverty and unemployment, could require greater efforts at health intervention in the search
for higher levels of social efficiency. It seems evident that the maintenance of a world-class position of
excellence in the Spanish healthcare system depends on continuing to improve, optimising resources
but also providing them.

References

Balk, B.M. (2001). Scale Efficiency and Productivity Change. Journal of Productivity Analysis, 15(3),
 159-183.

Barnum, D., Johnson, M., & Gleason, J.M. (2016). Importance of Statistical Evidence in Estimating
 Valid DEA Scores. Journal of Medical System, 40, 47-59.

Barro, R.J., & Sala-i-Martin, X. (1992). Convergence. Journal of Political Economics, 100(2), 223-
 251.

Caves, D. W., Christensen, L. R., & Diewert. W. E. (1982). The Economic Theory of Index Numbers
 and the Measurement of Input, Output, and Productivity. Econometrica, 50 (9), 1393–1414.

Cordero-Ferrera, J.M., Nuño-Solinis, R., Orueta, J.F., Polo, C., Del Rio-Cámara, M., & Alonso-Morán,
 E. (2016). Evaluación de la eficiencia técnica de la atención primaria pública en el País Vasco,
 2010-2013. Gaceta Sanitaria, 30(2), 104-109.

Cordero-Ferrera, J.M., Crespo-Cebada, E., & Murillo-Zamorano, L.R. (2011). Measuring technical
 efficiency in primary health care, The Effect of exogenous variables on results. Journal of
 Medical System, 35, 545-554.

Delgado, M., & Fariñas, J.C. (2002). Firm productivity and export markets, a non-parametric approach.
 Journal of International Economics, 57(2) 397-422.

Färe, R., Grosskopf, S., Norris, M., & Zhang, Z. (1994). Productivity Growth, Technical Progress and
 Efficiency Change in Industrialized Countries. American Economic Review, 84(1), 66–83.

Flores, I. (2019, 24 April). Bajo mínimos. Retrieved from
 https,//elpais.com/elpais/2019/04/23/opinion/1556042649_143602.html

 394
García-Latorre, F., Marcuello, C., Serrano, G.D., & Urbina, O. (1996) Evaluación de la eficiencia en
 centros de atención primaria. Una aplicación del análisis envolvente de datos. Revista Eso Salud
 Publica, 70, 211-220.

Grifell-Tatjé, E., & C.A. Lovell, K. (1995). A note on the Malmquist index. Economics Letters, 47(2)
 169-175.

Lovell, C.K. (2003). The Decomposition of Malmquist Productivity Index. Journal of Productivity
 Analysis, 20(3), 437-458.

Martínez-Cillero, M., & Thorne, F. (2019). Sources of productivity growth using the Färe-Primont
 decomposition. An empirical application to the Irish beef sector. Applied Economics, 51(36),
 3982-3994.

Mateos, A., & Penedés, A. (2013). España, Crisis y recortes. Revista de ciencia política, 33(1), 161-
 183.

O’Donnell, C.J. (2008). An Aggregate Quantity-Price Framework for Measuring and Decomposing
 Productivity and Profitability Change. Working paper series, No. WP07/2008, University of
 Queensland.

O'Donnell, C.J. (2011). Econometric Estimation of Distance Functions and Associated Measures of
 Productivity and Efficiency Change. Centre for Efficiency and Productivity Analysis Working
 Papers WP01/2011. University of Queensland.

Pelone, F., Kringos, D.S., Romaniello, A., Archibugu, M., Salsiri, C., & Ricciardi, W. (2015). Primary
 Care Efficiency Measurement Using Data Envelopment Analysis. A Systematic Review
 Journal of Medical System, 39(1), 156-177.

Puig-Junoy, J. (2000). Eficiencia en la atención primaria de salud, Una revisión crítica de las medidas
 frontera. Revista Española de Salud Pública, 74, 483-495.

Quah, D.T. (1997). Empirics for Growth and Distribution, Stratification, Polarization and Convergence
 Clubs. Journal of Economic Growth, 2, 27-59.

Romano, J., & Choi, Á. (2016). Medida de la eficiencia de la atención primaria en Barcelona
 incorporando indicadores de calidad. Gaceta Sanitaria, 30(5), 359-365.

Russell, R. (2018). Theoretical productivity index. The Oxford handbook of productivity analysis.
 Oxford: Emili Grifell-Tatjé, C. A. Knox Lovell, & Robin C. Sickles. DOI:
 10.1093/oxfordhb/9780190226718.013.4.

Scott, D.W. (1992). Multivariate density estimation; Theory, practice, and visualization. New York:
 Wiley.

Segura, A. (2014). Recortes, austeridad y salud. Gaceta Sanitaria, 28(S1), 7-11.

Stokey, N.L., & Lucas, R.E. (1989). Recursive methods in Economics Dynamics. Massachussets:
 Harvard University Press.

Vafaee, A., Pooya, A., Alizadeh, A., & Emrouznejad, A. (2018). Assessing the Relative Performance
 of Nurses Using Data Envelopment Analysis Matrix (DEAM). Journal of Medial System, 42,
 125-134.

 395
Vieira, M., (2018, 24 September). España tiene el sistema sanitario más eficiente de Europa y el tercero
 del mundo, según el informe Bloomberg, Diario Enfermero. Retrieved from
 http,//diarioenfermero.es/espana-tiene-el-sistema-sanitario-mas-eficiente-de-europa-y-el-
 tercero-del-mundo-segun-el-informe-bloomberg/

 396
You can also read