Analyzing Ecosystem Services in Armenia Using ArcGIS Online: A Case Study of the Geghard Monastery and the Kotayk Province - gis.Point
←
→
Page content transcription
If your browser does not render page correctly, please read the page content below
Full Paper                                                                                              363

Analyzing Ecosystem Services in Armenia Using
ArcGIS Online: A Case Study of the Geghard
Monastery and the Kotayk Province
Matthias Pietsch1, Nicole Uhrig1, Hovik Sayadyan2, Dae Yong Kim1
1Anhalt   University of Applied Sciences, Bernburg/Germany · matthias.pietsch@hs-anhalt.de
2Yerevan   State University, Yerevan/Armenia

Abstract: Implementing explicit spatial assessments of ecosystem services in landscape planning and
decision making can help enhance sustainable development. Using software tools, such as Desktop
GIS, MobilGIS and WebGIS Applications, can support the process. For two research areas in Armenia
well-known methods for the assessment of cultural ecosystem services and the soil erosion prevention
were calculated, and story maps in ArcGIS Online were produced in a landscape architecture studio. In
this paper the implementation, especially of story maps for communication and participation in distance
learning projects, are described.
Keywords: Ecosystem services, assessment, cultural services, soil erosion prevention

1      Introduction
Armenia is situated in the southern part of the Caucasus region where, unfortunately unre-
solved conflicts are still enforcing migration and hindering development in these regions.
The south Caucasus region is one of the world’s most diverse biodiversity hotspots with about
6000 species of high vascular plants, which has plenty of endemic and relict representatives
of flora and fauna. Deforestation, erosion and degradation of soil and biodiversity are some
of the existing environmental problems. On the other hand, the economic structure is chang-
ing and there has been a continuous shift towards organic agriculture, information technolo-
gies, tourism and recreation. The publications of the Millennium Ecosystem Assessment
(MA 2005) and the TEEB (2010) have made it clear that humans depend on nature and eco-
systems, and on the functions and different processes they provide (BASTIAN et al. 2012).
Therefore, the concept of ecosystem services was developed and these services can be de-
fined as “the benefits people obtain from ecosystems” (MA 2005). The concept attempts to
describe and analyse ecosystems and landscapes in order to derive what kind of potential they
have for providing services and to obtain information to help define and evaluate these ser-
vices for human benefit (POTSCHIN & HAINES-YOUNG 2012, BASTIAN et al. 2012, CROSSMAN
et al. 2013).
The services are classified in four categories: in provisioning services (e. g. food and water);
regulating services (e. g. soil erosion prevention); supporting services (e. g. nutrient cycling)
and cultural services (e. g. inspiration). Cultural services are divided in different categories,
for example, aesthetic information, opportunities for recreation and tourism, inspiration for
culture, art and design, spiritual experience and information for cognitive environment
(TEEB 2010). It is expected that the implementation of the ecosystem service approach in
planning and decision-making processes can help develop sustainable development (DE
GROOT et al. 2010, GRÊT-REGAMY et al. 2013). For regulating services such as soil erosion
prevention, well-known methods in landscape planning do exist (BASTIAN & SCHREIBER

Journal of Digital Landscape Architecture, 4-2019, pp. 363-371. © Wichmann Verlag, VDE VERLAG GMBH ·
Berlin · Offenbach. ISBN 978-3-87907-663-5, ISSN 2367-4253, e-ISSN 2511-624X, doi:10.14627/537663039.
This article is an open access article distributed under the terms and conditions of the Creative Commons
Attribution license (http://creativecommons.org/licenses/by-nd/4.0/).
364                                            Journal of Digital Landscape Architecture · 4-2019

1999, GRÜNEWALD & WENDE 2013). However, the incorporation of cultural ecosystem ser-
vices seems to be difficult (CHAN et al. 2012). The assessment of ES for a specific research
area can be done using an evaluation matrix (BURKHARD et al. 2012), which functions by
dividing the research area into different categories (e. g. land use) and evaluating each ES
with values from 0 to 5. The evaluations can be differentiated into existing and potential ES.
Hence in a cooperative project with Anhalt University, Yerevan State University and Green-
lane NGO; students from Anhalt University’s MLA program have been mapping and as-
sessing selected ecosystem services in two study areas in Armenia. In the province of Kotayk
the regulating service “soil erosion prevention” was analysed and described using existing
methods that were adapted to the specific situation in Armenia (BASTIAN et al. 2013, SYRBE
& WALZ 2012). In addition, the existing and potential cultural services for the Geghard Mon-
astery were assessed using a evaluation matrix according to BURKHARD et al. (2012). For the
whole process a combination between ArcGIS Desktop, Collector App and ArcGIS Online
were used for the necessary analysis, the assessment and the communication and for the par-
ticipation process.

2     Studio
2.1   Concept
One-semester studio project during the summer semester of 2018 an intercultural and inter-
disciplinary group of students worked on the topic “Landscape Design for Green-Lane-Ag-
ricultural Center and Eco System Services Assessment, Armenia”. While introducing a vari-
ety of different planning approaches and trying to connect the subject areas of landscape
planning and landscape design; special attention was paid to the synopsis of problems that
arise and the planning of relevant interrelationships among the ecological, economic, socio-
logical, functional and aesthetic aspects of the project. Two teams worked on the ecosystem
services assessment and the landscape design proposals for Greenlane NGO training center
in Armenia. Consequently, they received a short introduction about Armenia, the ecosystem
services approach including training dealing with the necessary technical tools. In particular,
the concept of preparing story maps using ArcGIS Online for communication and participa-
tion processes was taught.

2.2   Framework
During five days of fieldwork in the two study areas, the students applied the tools ArcGIS
Online and the Collector App of ESRI. Back in Germany necessary analysis (2D and 3D)
and evaluation processes were done in ArcGIS. For visualization and documentation of the
results Story Maps in ArcGIS Online were produced and published to facilitate discussion
with the project partners from Armenia (see Fig 1).
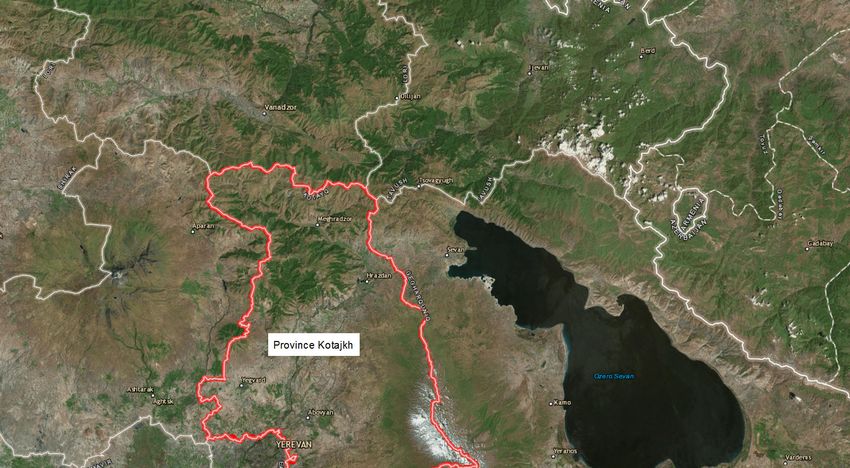
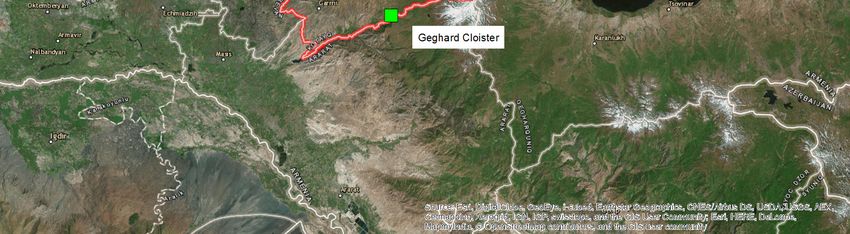
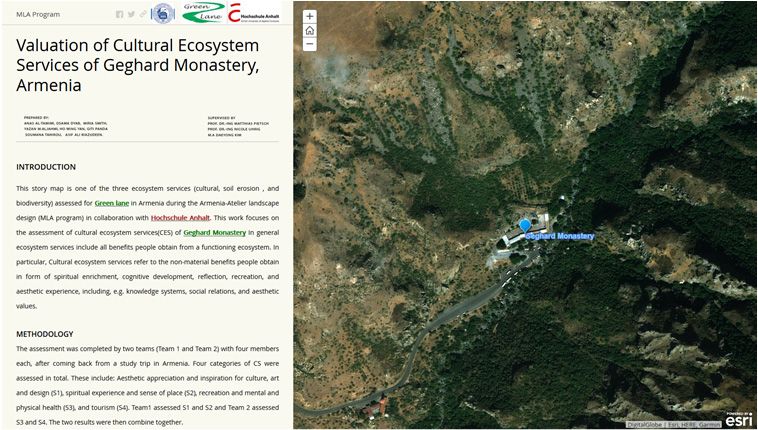
M. Pietsch et al.: Analyzing Ecosystem Services in Armenia Using ArcGIS Online          365

Fig. 1: Workflow

3     Research Areas
As research areas the province Kotayk in the northeast of Yerevan and the Geghard Monas-
tery inside the province were selected (see Fig. 2).

Fig. 2: Research areas

4     Material and Methodology
4.1   Cultural Ecosystem Services
The Geghard Monastery contains a number of churches and tombs that illustrates the Arme-
nian medieval architecture. It has a very high potential for ecotourism. However, protection
from negative impacts and the preservation of the spiritual experience is needed. Therefore,
the assessment of existing and potential cultural ecosystem services was provided for the
Geghard Monastery, which was dependent on an evaluation matrix (BURKHARD et al. 2012).
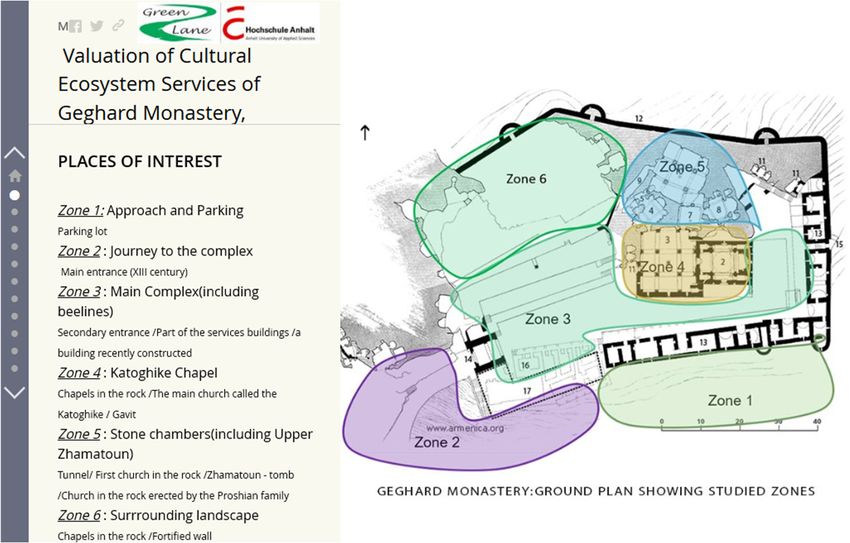
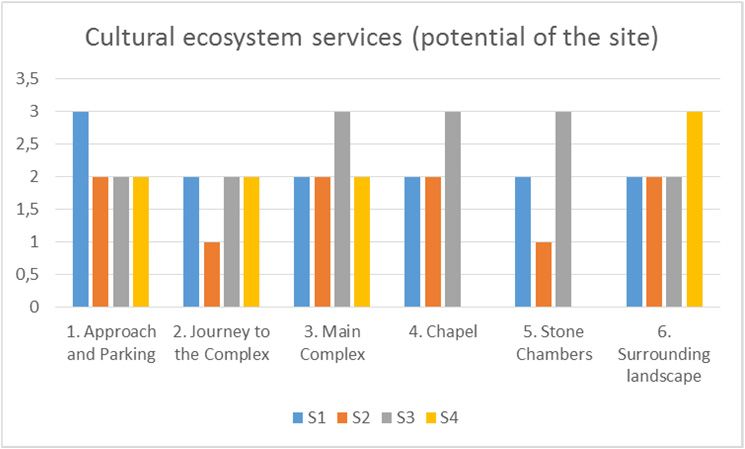
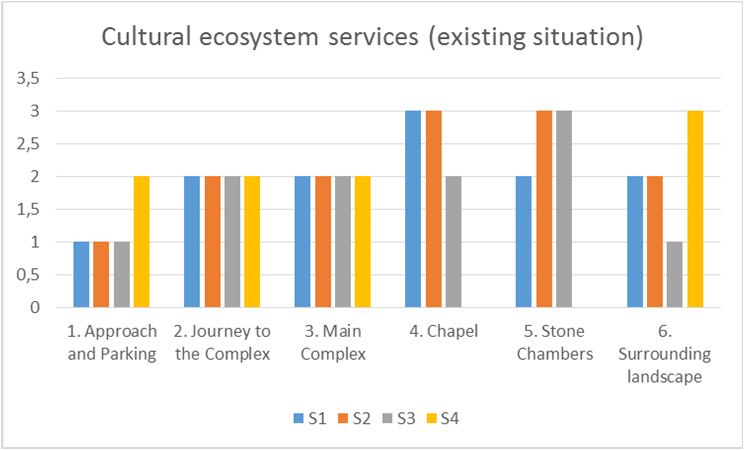
366                                                Journal of Digital Landscape Architecture · 4-2019

Therefore, in the first step the monastery area was divided into six zones according to its
existing functions and facilities (e. g. Zone 1: parking area, Zone 6: surrounding landscape)
(see Fig. 3). Then the existing and potential values of each zone were assessed for the four
cultural ecosystem services: aesthetic appreciation and inspiration for culture, art and design
(S1), spiritual experience and sense of place (S2), recreation and mental and physical health
(S3) and tourism (S4). Each ES was evaluated by 1 to 3 while 1 is the lowest and 3 is the
highest value. Two teams did this work, (Team 1 and Team 2) with four members each.
Team1 assessed S1 and S2 and Team 2 assessed S3 and S4. Every team member did an
assessment individually and the results were then combined by calculating the average (Team
1) or compromising (Team 2) (see Fig. 4). The comparison between existing and potential
values demonstrated the difference between the existing and potential values, which in es-
sence is an indicator for future development.
To support the process, the Collector App and offline maps were provided for the field trip.
The students took geo-referenced pictures and added comments while analyzing the monas-
tery. Afterwards after returning to Germany, all of the information that was collected in the
field was combined in one database using ArcGIS Online. The collected information supports
the process of dividing the research area and developing the evaluation matrix.

Fig. 3: Assessed zones of Geghard Monastery visualized as story map in ArcGIS Online

4.2    Soil Erosion Prevention in the Kotayk Province
The prevention of soil erosion was calculated based on the adapted soil loss equation (ABAG)
that simplifies the Revised Universal Soil Loss Equation (RUSLE) using the formula below:
A=K·S·C·R
A = estimated average soil loss/tons per hectare   C = vegetation cover factor
K = soil erodibility factor                        R = rainfall runoff erosivity factor
S = slope steepness factor
M. Pietsch et al.: Analyzing Ecosystem Services in Armenia Using ArcGIS Online                 367

The soil erodibility factor (K-factor) is a quantitative description of the inherit erodibility of
a particular soil. S measures the effect of slope steepness and is a dimensionless factor. C is
the vegetation cover factor and R represents the average summer rainfall. While the S and C-
factor have the highest impact on soil erosion (PANAGOS et al. 2015), it must be noted that
adapted management prevents negative impacts. Based on this information a monetary eval-
uation of the damage can be done considering the amount of fertilizer that is necessary to
maintain the fertility of the existing soils. The necessary data sets, such as, a digital elevation
model in a resolution of 10m (DTM), soil types, land use and annual rainfall were provided
by the Yerevan State University.

5     Results
5.1   Cultural Ecosystem Services for the Geghard Monastery
The final evaluation of the existing and potential cultural ecosystem services evaluated by
the two teams is represented in Fig. 4. This was done for the above-mentioned six zones and
the four cultural ecosystem services. When comparing the two graphs, detailed information
for upgrading specific ES is visible. Design proposals are possible for future development
and for sustainable tourism.

Fig. 4: Evaluation of existing (left) and potential ecosystem services for zone 1 to 6 of the
        Geghard Monastery (right) (S1: Aesthetic appreciation and inspiration for culture,
        art and design; S2: spiritual experience and sense of place; S3: recreation and mental
        and physical health; S4: tourism)

Fig. 5: Story maps for the assessment of cultural ecosystem services using ArcGIS Online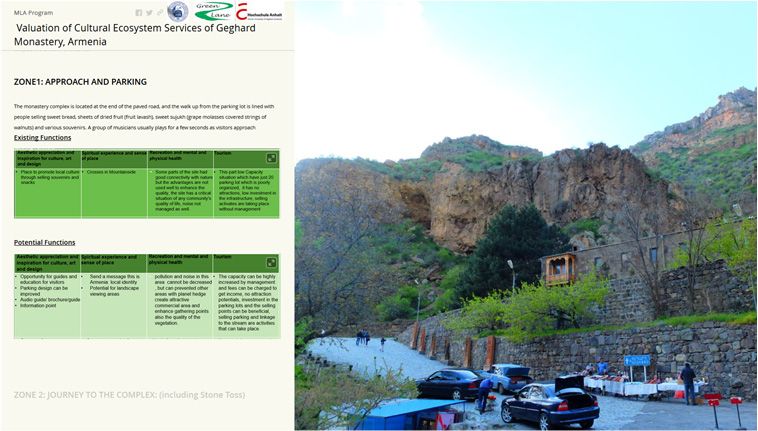
368                                              Journal of Digital Landscape Architecture · 4-2019

As a supporting tool for the whole process and final results; two story maps in ArcGIS Online
were prepared for communication and discussion with the partners in Armenia.

5.2   Soil Erosion Prevention
In order to bring out the invisible benefits of soil erosion prevention, the loss of fertile soil in
tons per ha and year through soil erosion were calculated using the adapted formula described
in chapter 4.2. The monetarization was done based on the costs for fertilizer in tons that is
needed to preserve the soil quality.
Using the input datasets, the sensitivity to preventing soil erosion was analysed and costs
were calculated for each site. The final results were summed up for the province of Kotayk,
indicating that the soil erosion for the whole province is about 220.000 t/a. For the recovery
of soil fertility about 27.500.000.000 Dram (about 48.7 Mio €) are required, since the average
cost is 125.000 Dram (about 220 €) per ton of fertilizer in 2017.

Fig. 6: DTM (left) and sensitivity against soil erosion by water (right) in the province Ko-
        tayk

5.3   ArcGIS Online and Collector App
The Anhalt University of Applied Sciences uses a campus License of ESRI. Therefore,
ArcGIS Online and the Collector App were used for the fieldwork, for the documentation of
results and for the communication/discussion with the partners in Armenia. In future, it could
be a suitable tool for participation. Especially, for the preparation of Offline Maps for the
Collector App, which were based on the implemented free Basemaps in ArcGIS Online were
very helpful. The App allowed us to create geo-referenced pictures including individual com-
ments. The App was very intuitive and easy to learn. Especially the combination of all of the
collected information in one database supported the definition of zones for the assessment of
ecosystem services.
The preparation of the story maps in ArcGIS Online for the two assessed ecosystem services
required that an additional introduction had to be given to the students. The concept differs
from presenting reports or maps as when indicating the typical results of a landscape archi-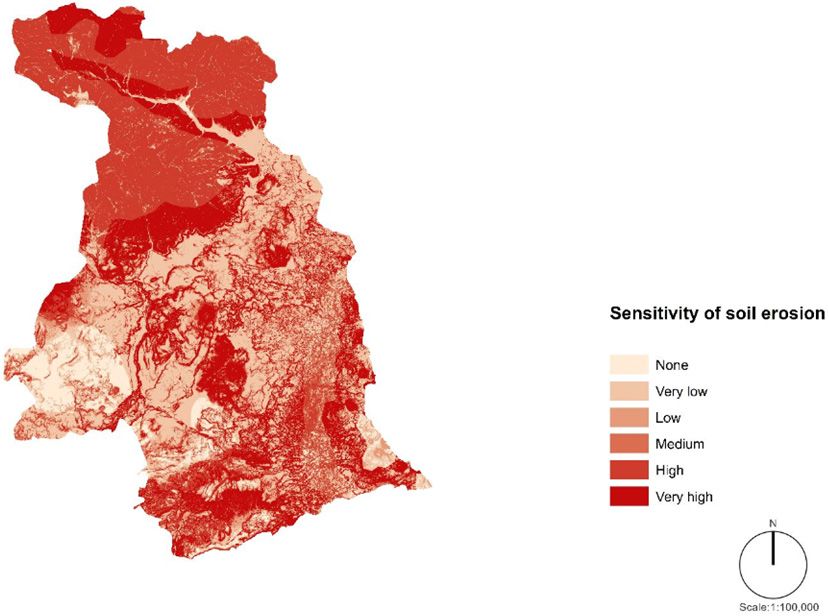
M. Pietsch et al.: Analyzing Ecosystem Services in Armenia Using ArcGIS Online                369

tecture studio. However, on the other hand, the possibility of working interactively and col-
laborating on the story maps gives students the freedom to produce their own results. Uni-
versity staff provided the administration by using different user groups. With this it was pos-
sible to invite users with different user rights during the preparation and discussion processes.
In the studio, staff and lecturers can be invited to discuss the results online with the students.
After finishing this working process, the colleagues in Armenia were invited to discuss the
final results (Fig. 7).
The preparation of the story maps is very intuitive and easy to learn. The possibility to use
predefined templates and to implement Online Maps is very helpful and can simplify the
communication process. Inviting various stakeholders or decision makers during a planning
process, with the help of user groups in the software, provides more flexibility to the respon-
sible project manager.

Fig. 7: Skype conference at Anhalt University with colleagues of Yerevan State University
        and Greenlane NGO

6     Conclusion and Outlook
In the described studio project well-known methods were used to map and assess selected
ecosystem services. The objective was to test several GIS-tools in order to support students
with basic technical knowledge while collecting geodatasets, mapping and evaluating eco-
system services and documenting the results using story maps in ArcGIS Online. In addition,
online discussion and participation with colleagues in Armenia were tested. and one of our
results is that the assessment of ecosystem services can be implemented in a landscape archi-
tecture studio. Analysing cultural ecosystem services works well. The method shown for an-
alysing existing and potential ES can be used for developing sustainable solutions and for
deciding which of the different ES has the highest potential. Although different cultures
worked together in the studio, the results are similar. The method used for soil erosion risk
was adapted to Armenia. The results are only an estimation and still have to be checked by
colleagues at the Yerevan State University. The monetarization was only calculated regard-
ing the necessary costs for fertilizer needed to preserve soil fertility. Any damage caused by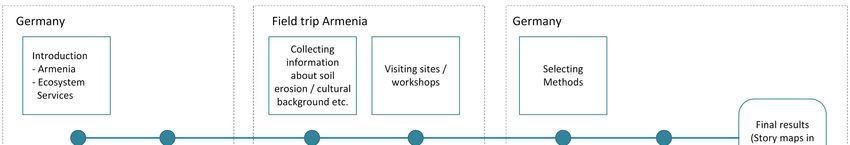
370                                            Journal of Digital Landscape Architecture · 4-2019

damage done to the infrastructure or biotopes were not calculated. This can be done by in-
cluding the concepts of the service providing areas (SPA), service beneficiaries and benefit-
ing areas (SBA) and service connecting areas (SCA) (SYRBE & WALZ 2012) and should be
added in future analysis. Nevertheless, the prepared story maps will help introduce the sever-
ity of the matter for decision makers and politicians in Armenia. The colleagues at the Yere-
van State University will continue to work on the topic.
Using ArcGIS Online with defined templates can be very easily implemented in landscape
planning, management and decision-making. Especially for communication and participa-
tion, it is a helpful tool. Nevertheless, it is necessary to develop a well-prepared concept for
visualization. The combination of using different media (text, pictures, videos, links etc.) and
interactive online maps is very flexible for specific projects and user groups. The admin-
istration is quite easy, and the preparation of story maps is very intuitive. The System can be
used in distance learning environments or for real projects with time differences. Testing
different templates in ArcGIS Online and integrating the whole planning process will be in-
teresting for future projects. The Collector App was especially helpful for fieldwork in study
areas where Internet access is not available since the offline maps support data preparation.
Unfortunately, the resolution is fixed in offline maps, which is something that causes some
disadvantages when zooming in. In conclusion our results should be considered for future
validation of the processes we used. Moreover, future fieldwork as the kind we have done
could more fully explore these pressing environmental issues.

References
BASTIAN, O. & SCHREIBER, K.-F. (1994), Analyse und ökologische Bewertung der Land-
   schaft. Gustav Fischer, Jena/Stuttgart.
BASTIAN, O., HAASE, D. & GRUNEWALD, K. (2012), Ecosystem properties, potentials and
   services – The EPPS conceptual framework and an urban application example. Ecological
   Indicators, 21, 7-16.
BASTIAN, O., SYRBE, R.-U., ROSENBERG, M., RAHE, D. & GRUNEWALD, K. (2013), The five
   pillar EPPS framework for quantifying, mapping and managing ecosystem services. Eco-
   system Services, 15-24.
BURKHARD, B., KROLL, F., NEDKOV, S. & MÜLLER, F. (2012), Mapping supply, demand, and
   budget of ecosystem services. Ecological Indicators, 21, 17-29.
CHAN, K. M., GUERRY, A. D., BALVANERA, P., KLAIN, S., SATTERFIELD, T., BASURTO, X.
   & WOODSIDE, U. (2012), Where are cultural and social in ecosystem services? A frame-
   work for constructive engagement. BioScience, 62 (8), 744-756.
CROSSMAN, N. D., BURKHARD, B., NEDKOV, S., WILLEMEN, L., PETZ, K., PALOMO, I.,
   DRAKOU, E.G., MARTIN-LOPEZ, B., MCPHEARSON, T., BOYANOVA, K., ALKEMADE, R.,
   EGOH, B., DUNBAR, M. B. & MAES, J. (2013), A blueprint for mapping and modelling
   ecosystem services. Ecosystem Services. (4), 4-14.
DE GROOT, R. S., ALKEMADE, R., BRAAT, L., HEIN, L. & WILLEMEN, L. (2010), Challenges
   in integrating the concept of ecosystem services and values in landscape planning, man-
   agement and decision making. Ecological Complexity, 7, 260-272.
GRÊT-REGAMY, A., CELIO, E., KLEIN, T. M. & WISSEN HAYEK, U. (2013), Understanding
   ecosystem services trade-offs with interactive procedural modeling for sustainable urban
   planning. Landscape and Urban Planning, 109 (1), 107-116.
M. Pietsch et al.: Analyzing Ecosystem Services in Armenia Using ArcGIS Online        371

GRÜNWALD, A. & WENDE, W. (2013), Integration des ÖSD-Konzepts in die Landschaftspla-
   nung. In GRUNEWALD/BASTIAN (Hrsg.): Ökosystemdienstleistungen. Springer, Berlin/
   Heidelberg.
MA (Millenium Assessment) (2005), Ecosystems and Human Wellbeing: Synthesis. Island
   Press, Washington, DC.
PANAGOS, P., BORELLI, P. & MEUSBURGER, K. (2015), A New European Slope Length and
   Steepness Factor (LS) for Modeling Soil Erosion by Water. Geosciences 2015, 5 (2), 117-
   126.
POTSCHIN, M. & HAINES-YOUNG, R. (2012), Landscapes, sustainability and the place-based
   analysis of ecosystem services, Landscape Ecology, 28 (6), 1053-1065.
SYRBE, R.-U. & WALZ, U. (2012), Spatial indicators for the assessment of ecosystem ser-
   vices: Providing benefiting and connecting areas and landscape metrics. In: Ecological
   Indicators, 21, 80-88.
THE ECONOMICS OF ECOSYSTEMS AND BIODIVERSITY (TEEB) (2010), www.teebweb.org.
You can also read