Annals of Tourism Research - DORAS
←
→
Page content transcription
If your browser does not render page correctly, please read the page content below
Annals of Tourism Research 87 (2021) 103109

                                                            Contents lists available at ScienceDirect

                                                       Annals of Tourism Research
                                 journal homepage: https://www.journals.elsevier.com/annals-of-
                                                        tourism-research

When lightning strikes twice: The tragedy-induced demise and
attempted corporate resuscitation of Malaysia airlines
Shaen Corbet a,b,⁎, Marina Efthymiou a, Brian Lucey c,d,e, John F. O'Connell f
a
  DCU Business School, Dublin City University, Dublin 9, Ireland
b
  School of Accounting, Finance and Economics, University of Waikato, New Zealand
c
  Trinity Business School, Trinity College Dublin, Dublin 2, Ireland
d
  University of Sydney Business School, University of Sydney, Sydney, New South Wales, Australia
e
  Institute of Business Research, University of Economics Ho Chi Minh City, Ho Chi Minh City, Vietnam
f
  School of Hospitality and Tourism Management, University of Surrey, UK

a r t i c l e            i n f o                          a b s t r a c t

Article history:                                          In 2014, Malaysia Airlines experienced two tragedies in quick succession, damaging the
Received 5 February 2020                                  company's reputation and finances, with negative implications for Malaysian tourism. This re-
Received in revised form 18 August 2020                   search assesses the impact of this. We find that the share price response was immediate and
Accepted 13 October 2020
                                                          substantive. The carrier implemented sweeping adjustments, while passenger traffic rapidly
Available online xxxx
                                                          declined particularly in Asian markets. Malaysian Airlines augmented fare reduction after
Associate editor: Andreas Papatheodorou                   each accident to stem the ongoing leakage of passengers. Traffic from China witnessed sharp
                                                          declines, signalling the severity of the incumbents' prognosis. We further examine the investor
                                                          response and the ultimate government decision to nationalise and restructure.
Keywords:
                                                          © 2020 The Author(s). Published by Elsevier Ltd. This is an open access article under the CC BY
Malaysia Airlines
Airline                                                                                               license (http://creativecommons.org/licenses/by/4.0/).
Crisis management
MH17
MH370
Nationalisation

Introduction

   The loss of a technologically advanced commercial airliner is, fortunately, an exceptionally rare event. However, the loss of two
commercial airliners within five months, was, and remains unprecedented. This is what occurred to Malaysia Airlines in 2014, a
scenario that led to the nationalisation of the company in order to protect both the Malaysian tourism industry and twenty thou-
sand airline employees. The carrier experienced two tragedies (hull losses with full loss of life for all those aboard) in quick suc-
cession, but the manner by which both aircraft were lost led to substantial international media coverage. Flight MH17 was shot
down over the eastern Ukraine and MH370 disappeared and remains lost. Management were widely criticised for poor commu-
nication in the wake of both events. An excellent overview of the managerial challenges and the aftermath of the crash and dis-
appearance is found in Nel (2014).
   Malaysia is a nation of over 32 million people, heavily reliant on its tourism industry. A key element of this was its flag-carrier,
Malaysia Airlines. Malaysian Airlines had an excellent safety record prior to 2014, but previously, it had experienced accidents
with loss of life, a Fokker 50 turboprop aircraft in 1995 and a hijacking and subsequent crash in 1977, leading to the deaths of
36 and 100 people respectively.

    ⁎ Corresponding author at: DCU Business School, Dublin City University, Dublin 9, Ireland.
      E-mail address: shaen.corbet@dcu.ie. (S. Corbet).

https://doi.org/10.1016/j.annals.2020.103109
0160-7383/© 2020 The Author(s). Published by Elsevier Ltd. This is an open access article under the CC BY license (http://creativecommons.org/licenses/by/4.0/).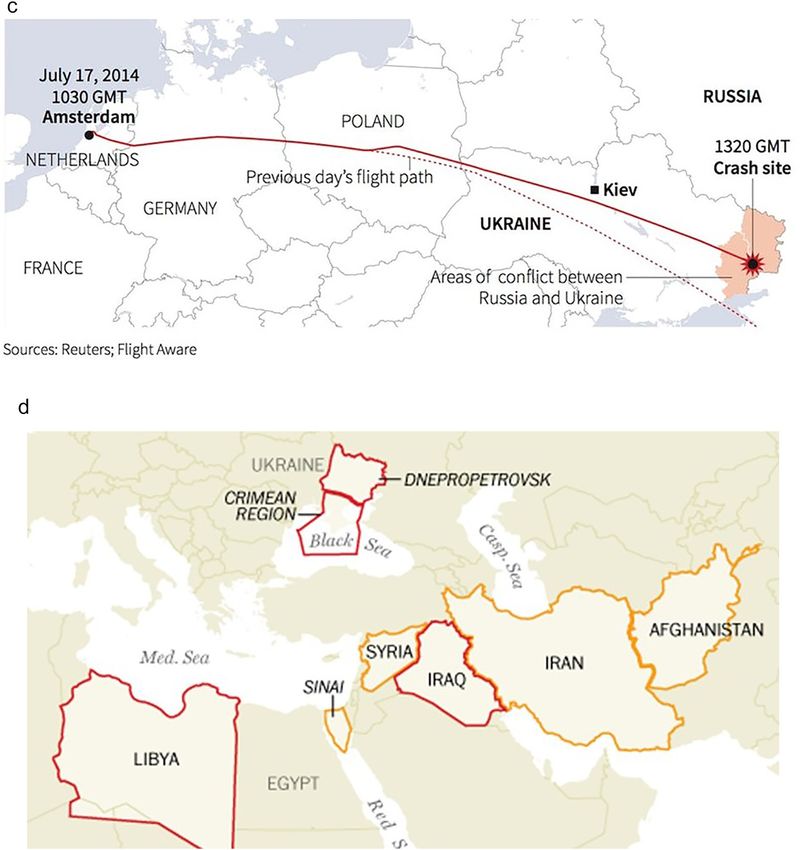
S. Corbet, M. Efthymiou, B. Lucey et al.                                                              Annals of Tourism Research 87 (2021) 103109

    The first tragedy to strike Malaysia Airlines was the loss of flight MH370, which disappeared while flying from Kuala Lumpur
International Airport to Beijing Capital International Airport on 8 March 2014 with the loss of 227 passengers and 12 crew. The
disappearance remains unsolved. Malaysia Airlines were then subjected to their second loss as MH17, a scheduled flight from
Amsterdam to Kuala Lumpur was shot down on 17 July 2014 while flying over eastern Ukraine, where an armed conflict had bro-
ken out in April 2014. Flights over the conflict zone were allowed as there was no indication of risk for civil aeroplanes at cruising
altitude and Malaysia Airlines, as almost all airlines, assumed that the airspace is safe. On that day 160 flights were overflown that
part of airspace. This resulted in the loss of all 283 passengers and 15 crew members.
    The paper will examine the impact of these incidents across a wide number of metrics that include share price volatility;
change in seats sold; dynamic changes in passengers flows as a result of pricing adjustments; and finally, the process and after-
math of nationalisation to secure the future of the flag carrier. This research is, we believe, the first that analyses the collapse of
Malaysia Airlines through multiple lenses. It tracks the behaviour of the share price at various pulse points in the accident time-
line, while also pinpointing how the company adjusted its seat capacity to contain its financial distressed state despite its repu-
tational damage. The aggressive fare reductions applied by the carrier record the stimulation effects on passengers, who were
haemorrhaging to rival carriers. It also delineates the pathway as to why the airline had to become nationalised.
    The rest of the paper is organised as follows. Previous literature provides a thorough review of the associated literature, which under-
pins our research hypotheses and selected methodologies. In Data and methodology, there is a description of the data that was applied as
well as the methodologies activated to address the issues. The results are described in Research results, with an associated discussion and
review of the process and aftermath of the nationalisation of Malaysia Airlines. Concluding remarks are offered in Conclusion.

Previous literature

    A number of high profile aviation disasters occurred in rapid succession in 2014 and into 2015, including the Germanwings
A320 crash; the disappearance of MH370; the shooting down of MH17; and the Air Algerie AH5017 and TransAsia GE222 acci-
dents. The variation in the circumstances of each of these incidents may affect different elements of public perceptions of air
travel. The literature is replete with research on the wide spectrum of effects stemming from an aircraft accident. Madsen
(2013) used data from the US airline industry and found a positive association between airline profitability and airline accident
rates. Airline incidents have economy-wide effects. Kaplanski and Levy (2010) found that the economy as a whole suffers an av-
erage loss of $60b per aviation disaster, largely from market declines.
    Ritchie and Jiang (2019) synthesised 142 papers on tourism risk, and crisis and disaster management to identify key method-
ologies and research gaps. Aliperti and Cruz (2019) further developed from this and stated the need for interdisciplinary research
focused on tourism preparedness. Research deficiencies were also counteracted through Nagai et al. (2020). Other areas also in-
cluded the awareness of tourists surrounding health risks, where Wang et al. (2013) expanded the usage of the use of Protection
Motivation Theory (PMT) to tourism risk management to find that maladaptive perception is negatively associated with the cop-
ing appraisal. Further interdisciplinary research included that incorporating psychometric risk (Wolff et al., 2019), economic anal-
ysis such as that based on Turkey by Okumus and Karamustafa (2005) and volunteer tourism, such as that analysed by Wearing
et al. (2020) using a disaster management framework incorporating community resilience in the aftermath of the 2015 Nepalese
earthquake.
    There is a rich literature on the effects of terror on tourism. Wolff and Larsen (2014), analysed the Norwegian population's risk
perceptions and worries before and after the 22 of July 2011 terrorist attacks in Oslo and Utoya. The authors found that tourists
within this region possessed low perception and fear of terrorist incidents, however, they declined even further after the attacks,
most likely generated by the implementation of new security measures in the aftermath of the incidents. Aliperti and Cruz (2019)
analysed tourist risk information processing comparing Chinese and American tourists to find cross-country differences regarding
the role played by different predictors of risk information seeking intentions. They suggest that the development of country-
tailored risk-communication strategies is an optimal solution. Blake and Sinclair (2003) found sector-specific targeted subsidies
and tax reductions to be the most efficient supports when analysing the United States response to the 11 September 2001 terror-
ist attacks. Seabra et al. (2020) utilised an unrestricted VAR model to analyse terrorism impacts on tourism arrivals in the Med-
iterranean, noting the existence of a consumer short memory effect. Novelli et al. (2018) analysed the response of tourism flows
to Ebola outbreaks in the Gambia, finding again the importance of consumer perception and preparedness.
    Threats to the tourism sector are influenced not only by the business cycle (Smeral, 2012), but by the resilience of companies
within sectors. Dahles and Susilowati (2015), for Indonesia, found that entrepreneurship plays a pivotal role in enhancing liveli-
hoods under crisis, while Orchiston et al. (2016) compare organisational resilience within the tourism sector confirming the im-
portance of innovation as a resilience dimension. Prayag et al. (2018) modelled organisational resilience as a second-order
construct to compare organisational resilience and financial performance and find that adaptive resilience has an impact on finan-
cial performance of firms.

Data and methodology

Data

   To provide a concise analysis of the financial behaviour and the key issues that encapsulated Malaysia Airlines during 2014, the
authors have combined data from a number of different sources. A two-stage analysis is performed, the first focusing on the

                                                                     2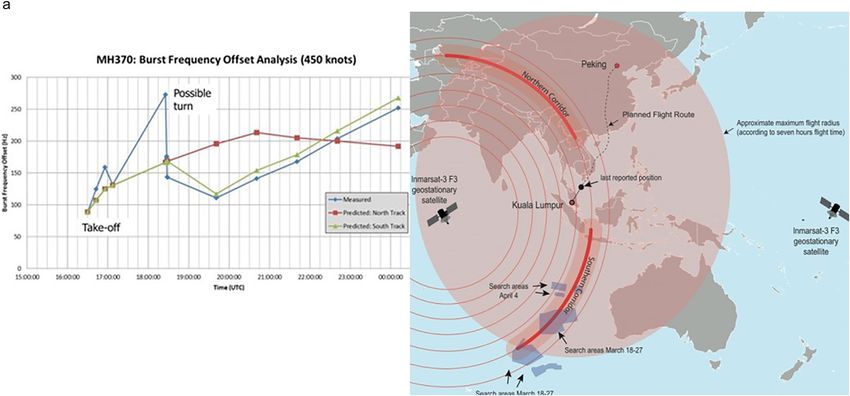
S. Corbet, M. Efthymiou, B. Lucey et al.                                                                   Annals of Tourism Research 87 (2021) 103109

financial performance of the company, portraying a concise overview of the pressures and issues that confronted senior manage-
ment within the company. The second stage analyses the response of the company in terms of the fares that were offered to pas-
sengers and the subsequent change in passenger behaviour that followed. The financial market data is taken from Thomson
Reuters Eikon, which is a set of software products provided by Refinitiv for financial professionals to monitor and analyse financial
information. It provides access to real time market data, news, fundamental data, analytics, trading and messaging tools. Station-
arity of the selected data is identified using the augmented Dickey-Fuller testing. Summary statistics for the selected aviation
index and the Bursa Malaysia, which represents the index on which Malaysia Airlines shares traded, are presented in Table 1.
    The second stage of the analysis required a source of supply side information. Data was obtained from OAG Analytics, a sub-
scription only specialist air travel database. It holds more than 57 million records of flight status updates per year and allows users
to extract and analyse seat capacity. We obtained demand and financial data for Malaysia Airlines through a Global Distribution
System (GDS) Sabre AirVision, Market Intelligence Data Tapes (MIDT), another subscription database that collates passenger de-
mand, fares and revenues by airlines with the ability to extract such for specific routes. This system does not however capture
demand and bookings done direct with the airlines, being a source of indirect (travel agents, travel management companies etc).

Methodology

   This research sets out to analyse ten specific hypotheses that develop an understanding of the specific issues that confronted
Malaysia Airlines (MA) while the company attempted to maintain operational competitiveness across a multiple business fronts.
While broad in scope, the culmination of these individual investigations present a thorough portrait of the mounting difficulties
that faced management during this extraordinary set of circumstances and the results of the various mitigation actions taken to
recover from the crisis. This research attempts to enhance the strategic decision discourse with a better understanding of expected
events and triggers that can be experienced during similar circumstances in the future. Therefore, this research should be of in-
terest to academics across a broad number of disciplines, risk-management and managerial level staff within the aviation industry,
and indeed, governments, regulators and policy-makers alike. The hypotheses that are examined include:

h1. Did MA share price declines extend beyond that of other traded companies who experienced similar catastrophes?

h2. Did share price volatility of MA experience sustained elevation in the period after these incidents?

h3. Did the dynamic correlation of price behaviour change in the aftermath of both disasters?

h4. Did these catastrophic incidents change the traditional price discovery channels in the aftermath of the events?

h5. Did the seat capacity and number of seats sold change in the period after these catastrophes?

h6. Did ticket pricing structures shift significantly in the periods after these catastrophes?

h7. Were ticket pricing structures influenced by type of seat class after these catastrophes?

h8. Did there exist domestic differentials in ticket demand in the period after these catastrophes?

h9. Did there exist regional differentials in ticket demand in the period after these catastrophes?

h10. Did there exist differentials in Chinese ticket demand in the period after these catastrophes?

Table 1
Summary statistics for the Malaysia Airlines share price and other related indices.

                                                   Malaysia Airlines                      Bursa Malaysia                         Aviation Index

  Ticker                                           MASM.KL                                .KLSE                                  .TRXFLDGLPUARLI
  Data start date                                  03/01/2005                             03/01/2005                             25/9/2012
  Data end data                                    31/05/2019                             31/05/2019                             31/05/2019
  Observations                                     3761                                   3761                                   1746
  Minimum price                                    $0.22                                  $829.41                                $75.91
  Date                                             19/05/2014                             29/10/2008                             28/09/2012
  Maximum price                                    $3.04                                  $1895.18                               $207.69
  Date                                             20/06/2007                             19/04/2018                             14/07/2017
  Highest volatility                               17.257%                                4.351%                                 5.467%
  Date                                             02/10/2017                             20/08/2007                             13/06/2017
  Lowest volatility                                −18.421%                               −9.497%                                −8.364%
  Date                                             19/05/2014                             20/03/2008                             24/06/2016
  Mean                                             −0.00028                               0.00018                                0.00048
  Variance                                         0.00038                                0.00005                                0.00012
  Skewness                                         0.52145                                −0.96068                               −0.38241
  Kurtosis                                         12.90755                               13.92162                               3.65873

                                                                                      3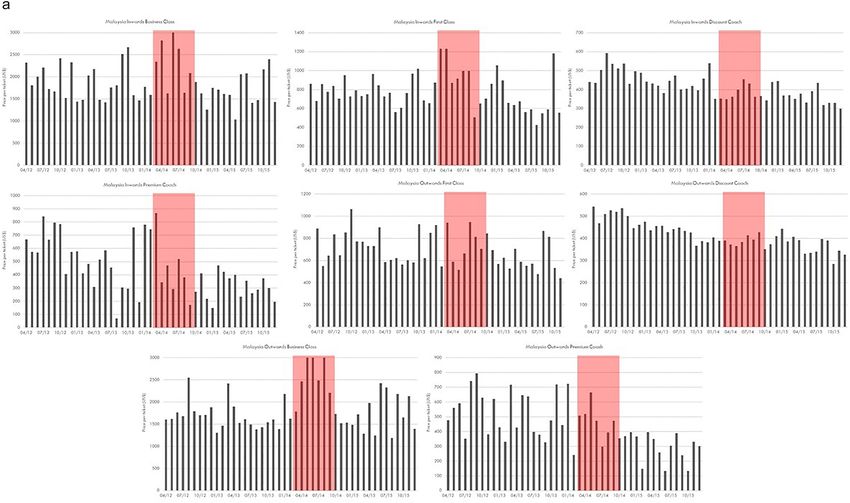
S. Corbet, M. Efthymiou, B. Lucey et al.                                                                         Annals of Tourism Research 87 (2021) 103109

    With regards to the above hypotheses, H1 through H4 analyse stock market data and the interactions of the share price of
Malaysia Airlines and both the company's sectoral and geographic peers. Within this spectrum of investigation, we consider the
use of an analysis of cumulative abnormal returns (CARs) and a GARCH(1,1) methodology to analyse abnormal returns and
stock price volatility, and a DCC-GARCH methodology to analyse interactions between the company and broad market indices
to test for contagion effects. We develop these analyses over a number of differing windows of time to analyse the decay of
such effects. Hypotheses H5 through H10 specifically analyse seat capacity, ticket sales and fare pricing issues that occurred in
the periods after the loss of both planes.

Share price behaviour and volatility effects

                                                                        P i,t
    We calculate the natural logarithm of returns Ri,t ¼ ln            P i,t−1       and develop upon a model of the following form to estimate ab-
normal returns:

         ARi,t ¼ Ri,t −α i −βi Rm,t Þ                                                                                                                   ð1Þ

where on day t, ARi, t is the abnormal return and Ri, t is the daily return for Malaysia Airlines, denoted as company i. Rm, t is either
the regional aviation sector or the Malaysia Stock Exchange, dependent on the structure presented in the results. βi is estimated
using returns for the pre-event window [−30,−1]. We then calculate the abnormal return (arT0) as the return for i on the event
day and cumulative abnormal return for each event across a variety of windows such as [−5,+5], [−3,+3] and [−1,+1], along
with a variety of windows examining returns both before and after each analysed event. The CAR for an event [T1, T2] is computed
as:

                            T2
         CARi,T 1 ,T 2 ¼ ∑ ARit                                                                                                                         ð2Þ
                           t¼T 1

    The abnormal and cumulative returns are given by:

                      N
                  ∑i¼1 ARi,t
         ARt ¼                                                                                                                                          ð3Þ
                     N

                             N
                          ∑i¼1 CARi,T 1 ,T 2
         CART 1 ,T 2 ¼                                                                                                                                  ð4Þ
                                     N

   We next use a GARCH(1,1) methodology as our basis for analysis the volatility. This allows us to control for the phenomenon
that the volatility of prices is not constant across time, high volatility bunching with high and low with low. ARCH, from Engle
(1982), later generalised by Bollerslev (1986) allows us to capture the time series properties of volatility and control for
autoregressive and moving average therein. We can specify this as:

         Rt ¼ xt β þ εt                                                                                                                                 ð5Þ

           2                     2         2         2          2                2              2
         σ t ¼ γ 0 þ γ 1 εt−1 þ γ 2 εt−2 þ ::: þ γ p εt−p þ δ1 σ t−1 þ δ2 σ t−2 þ ::: þ δq σ t−q                                                        ð6Þ

         where γi are the ARCH parameters and δi are the GARCH parameters. The GARCH model of conditional variance can thus be
         best understood as an ARMA process on the squared parameters. Specification tests found that, as is typically the case with
         financial series, a GARCH(1,1) model provided best fit. To isolate international effects we include domestic and interna-
         tional equity indices in the mean equation GARCH(1,1) methodology. The results of all tests are available from the authors
         on request. Only baseline methodologies are presented here. A five day window post each selected event was found to be
         most appropriate across a number of GARCH specifications including EGARCH, TGARCH, Asymmetric Power ARCH
         (APARCH), Component GARCH (CGARCH) and the Asymmetric Component GARCH (ACGARCH). Volatility induced from
         shocks are also controlled for. Dummy variables set at 1 for the first 120 h (5-days) are included. The lagged returns for
         the five hours preceding the incident preceding were found significant and thus included in the mean equation. The
         GARCH (1,1) methodology used then has the following specification

         Rt ¼ a0 þ ∑bj Rt−j þ b2 avt þ b3 borsat þ b4 DoW t þ Dt þ ε t                                                                                  ð7Þ
                       j¼1

    Rt−j represents the lagged value of Malaysia Airlines shares returns, n hours before Rt is observed. b2avt returns on interna-
tional aviation indices n hours before the incident, b3borsat those on the Borsa Malaysia contemporaneous with the hour that
the estimate Rt was observed, to filter local effects, while b4DoWt denotes the day of the week, filtering possible calendar effects.
Dt represents a dummy variable set to 1 in the five-day period after the analysed incident.

                                                                                     4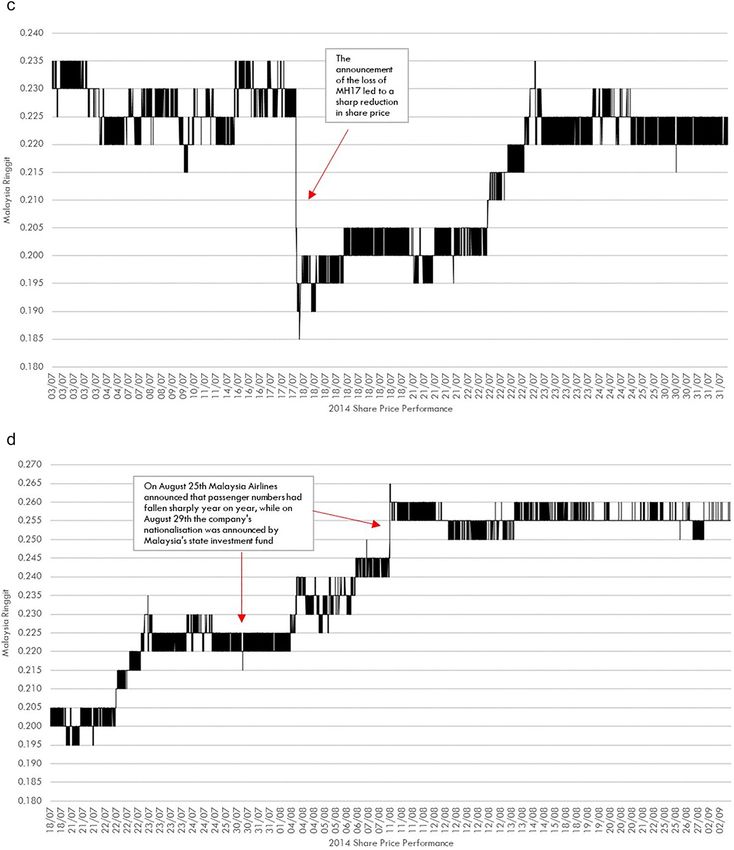
S. Corbet, M. Efthymiou, B. Lucey et al.                                                        Annals of Tourism Research 87 (2021) 103109

The contagion effects of the Malaysia Airlines disasters
    We analyse H3, which specifically questions if these incidents gave rise to contagion effects within the regional aviation sector
and the Malaysia Stock Exchange, we use a DCC-GARCH model to check whether or not there has been a significant increase in
the comovement of such returns around these crises. There is a wide body of literature documenting such increases in times of
crises. Two representative papers would be that of Forbes and Rigobon (2002), who investigate the 1997 Asian crisis, the 1994
Mexican devaluation, and the 1987 U.S. market crash and Baig and Goldfajn (1999) for a wide variety of US news finding
cross-border contagion in both currency and stock markets. Other key works that have developed on the initial work of Forbes
and Rigobon (2002) include that of Corsetti et al. (2005), Kenourgios et al. (2011), Samarakoon (2011), Forbes (2004) and
Markwat et al. (2009). In a first stage, we surface the impact of external shocks on the dynamic conditional correlation. We set
a model as follows:

                             2                   2
         hi,t ¼ A0 þ A1 εt−1 þ B1 hi,t−1 þ Σk¼1 dk DMk,t                                                                               ð8Þ

where A0>0, A1 ≥ 0, B1 ≥ 0 and A1 + B1  y1 if           t ¼ Jan >
              >
              >                          >
                                         >
              < y if             t ¼ Feb =   s
                  2
         St ¼                              ¼ ∑ γ i M it                                                                              ð10Þ
              >
              >      ⋮                   > i¼1
                                         >
              >
              :                          >
                                         ;
                y12 if           t ¼ Dec

   We estimate a baseline model that excludes one month as regressing on both the intercept with all seasonal dummies would
show perfect multicollinearity, We are interested in the initial response of airline passenger numbers in the 3-month period di-
rectly after the Malaysian Airline incidents and therefore include a further dummy variable that specifically investigates this pe-
riod Dt.

                       s−1
         yt ¼ α 0 þ ∑ βi Mit þ Dt þ et                                                                                               ð11Þ
                       i¼1

                                                                        5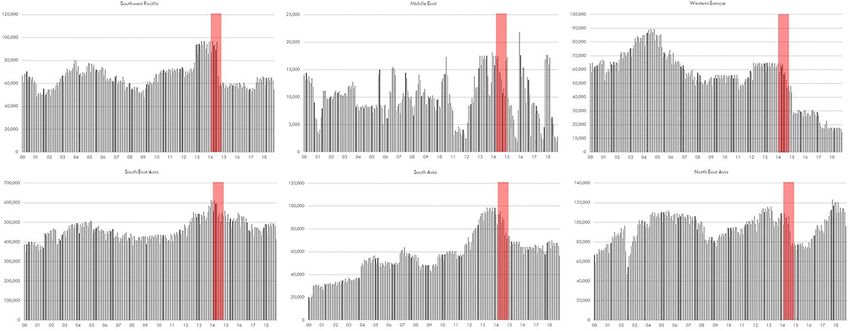
S. Corbet, M. Efthymiou, B. Lucey et al.
6

                                                                                                         Annals of Tourism Research 87 (2021) 103109
    Fig. 1. Price levels and volatility of Malaysia Airlines share price and other comparable metrics.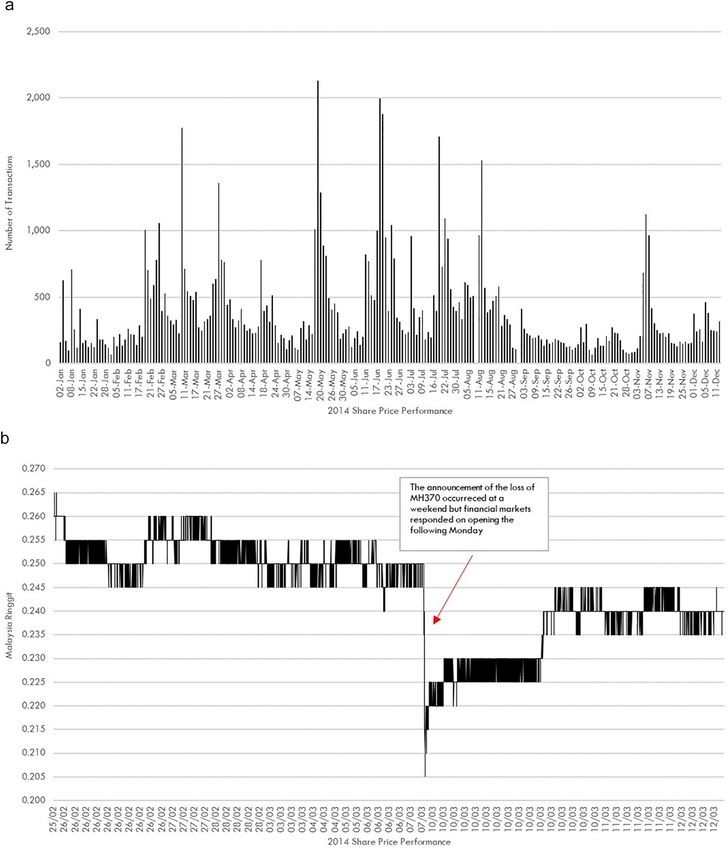
S. Corbet, M. Efthymiou, B. Lucey et al.                                                          Annals of Tourism Research 87 (2021) 103109

                                                            Fig. 1 (continued).

    Eq. (11) generates an estimate of the scale of the impact from the incidents while controlling for the presence of seasonality.
Our initial analysis focuses on two issues. The first is the effects of the incidents on the total number of seats filled. The second is
the number of seats sold by ticket class. Each of these investigations are further sub-divided into arriving and departing flights.
Where data is available by region, we separate seats and fares by class. The described methodologies use the same independent
variables but differing dependent variables, facilitating cross equation analysis. ∑s−1
                                                                                      i=1 βiMit represents a seasonal-adjustment to ac-
count for differing sales patterns throughout the year. Dt is a dummy variable that is designed to account for changes in ticket
sales and fare changes in the periods each incident.

Research results

    Our selected methodologies results are presented in two distinct sections. The first section presents results based on the anal-
ysis of share price behaviour, indicative of the substantial corporate pressures that the board of management experienced during
the financial and reputational crisis that followed after the loss of both flight MH370 and MH17. The second section presents ev-
idence of the attempted response of the company through the manipulation of fares and routes while measuring how the passen-
gers responded to such incentives in an environment of perceived risk after two aircraft were downed in quick succession.

Share price behaviour

    The first stage of our analysis focuses on the financial market effects that ensued following the Malaysia Airlines disasters and
the subsequent nationalisation of the company. Within this context, an analysis referring to Hypothesis H1, was instigated to in-
vestigate the share price of Malaysia Airlines pre and post accidents. Fig. 1 observes the levels, volatility and distribution of the
airline's returns in comparison with the Bursa Malaysia which is the exchange on which the company's shares traded, and the
Thomson Reuters International Aviation Index, acting as a metric of the performance of the largest international aviation
companies.
    It can be clearly depicted that while domestic indices and the industry at large were experiencing growth and reduced levels
of volatility, Malaysia Airlines had struggled quite substantially in the aftermath of the global financial crisis of 2007, presenting

                                                                    7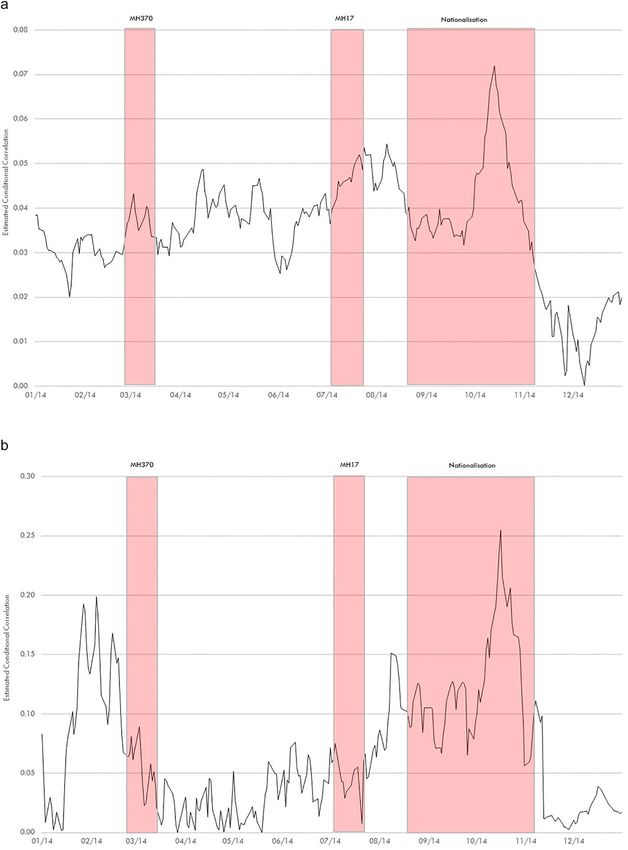
S. Corbet, M. Efthymiou, B. Lucey et al.                                                         Annals of Tourism Research 87 (2021) 103109

                                                           Fig. 1 (continued).

levels of instability far above its industry peers. In Fig. 2, we observe share price performance data indicative of all trades in the
period throughout 2014, with the immediate time periods surrounding the loss of both flights highlighted. While trading at
MYR0.255 in the time immediately before the loss of MH370, the share price subsequently fell in excess of 20% to MYR0.20. Sim-
ilarly, in the period before the loss of flight MH17, the share price traded upwards towards MYR0.235 while then falling to
MYR0.185, a decline of around 21%. Both cases present evidence of substantial share price volatility and respective declines in
value. This sentiment is echoed in Fig. 3, which presents evidence of the substantial elevations in transaction numbers in the pe-
riods of time surrounding the loss of both flights as well as the speculative rumours from social media and uncertainty that per-
severed in the following months. This share price oscillation in the share price of Malaysia Airlines is by no means unusual when
compared to other similar scenarios. While considering that the share price fell in excess of 20% during both of the Malaysia Air-
lines disasters, we must note that these disasters represent one of the world's worst aviation catastrophes for any traded aviation
company. Other carriers witnessed downward pressure on their share price, post-accident with Air France in 1997 resulting in a
share price fall of 10.99%, while the Korean Air disaster led to a decline of 13.06%, and both of the China Airlines calamities re-
sulted in share price reductions of 6.73% and 6.91% respectively. For added methodological robustness, we further consider the

                                                                   8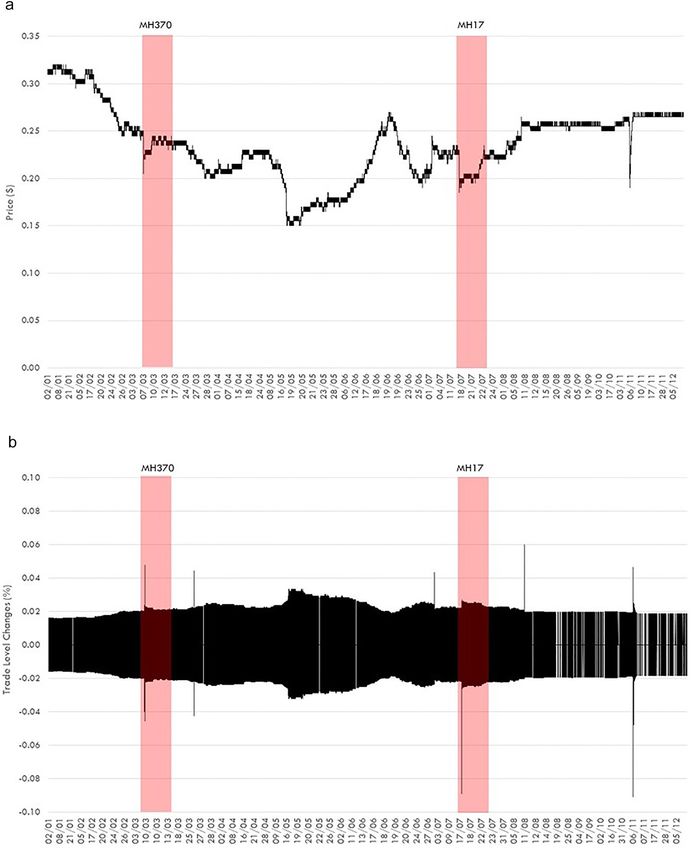
S. Corbet, M. Efthymiou, B. Lucey et al.
9

                                                                                                  Annals of Tourism Research 87 (2021) 103109
    Fig. 2. High frequency price levels and volatility of Malaysia Airlines share price in 2014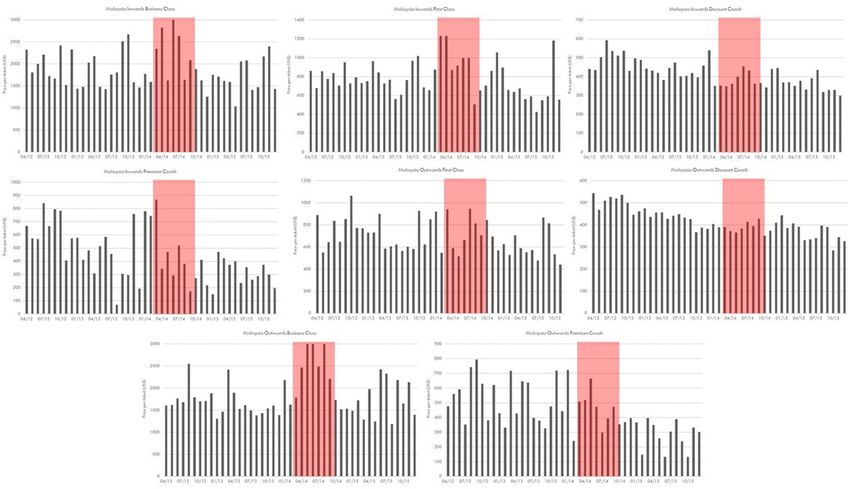
S. Corbet, M. Efthymiou, B. Lucey et al.                                                                          Annals of Tourism Research 87 (2021) 103109

                                           Fig. 3. Malaysia Airlines number of share price transactions in 2014

interactions and abnormal returns using high frequency tick data in the form of a concise event study Table 2. These significant
results present further evidence of the sharp collapse of Malaysia Airlines share prices relative to both domestic and international
peers during both events. While considering the similarities in the associated events, we can clearly observe that Malaysia Airlines

                                                                           10
S. Corbet, M. Efthymiou, B. Lucey et al. Annals of Tourism Research 87 (2021) 103109
Table 2
Cumulative abnormal returns based on high frequency tick data during both Malaysia Airlines catastrophes.
MH370, 8 March 2014 MH17, 17 July 2014
MAL KLSE Av Sector MAL CARs MAL KLSE Av Sector MAL CARs
[−30,+30] −0.3492⁎,⁎⁎,⁎⁎⁎ 0.0279⁎⁎⁎ 0.0618⁎⁎⁎ −0.3771⁎⁎⁎ −0.1091⁎⁎⁎ 0.0021⁎⁎⁎ 0.0125⁎⁎⁎ −0.1112⁎⁎⁎
[−30,−1] −0.1587⁎⁎⁎ 0.0088⁎⁎⁎ 0.0639⁎⁎⁎ −0.1676⁎⁎⁎ −0.0909⁎⁎⁎ 0.0056⁎⁎⁎ 0.0061⁎⁎⁎ −0.0965⁎⁎⁎
[−10,−1] 0.0392⁎⁎⁎ −0.0009⁎⁎⁎ 0.0108⁎⁎⁎ 0.0401⁎⁎⁎ 0.1111⁎⁎⁎ −0.0036⁎⁎⁎ 0.0007⁎⁎⁎ 0.1147⁎⁎⁎
[−5,+5] −0.0816⁎⁎⁎ −0.0061⁎⁎⁎ 0.0100⁎⁎⁎ −0.0756⁎⁎⁎ −0.0889⁎⁎⁎ −0.0085⁎⁎⁎ −0.0193⁎⁎⁎ −0.0804⁎⁎⁎
[−3,+3] −0.0600⁎⁎⁎ −0.0007⁎⁎⁎ −0.0066⁎⁎⁎ −0.0593⁎⁎⁎ −0.1702⁎⁎⁎ −0.0067⁎⁎⁎ −0.0038⁎⁎⁎ −0.1635⁎⁎⁎
[−1,+1] −0.2642⁎⁎⁎ −0.0051⁎⁎⁎ −0.0011⁎⁎⁎ −0.2590⁎⁎⁎ −0.3400⁎⁎⁎ −0.0039⁎⁎⁎ −0.0083⁎⁎⁎ −0.3361⁎⁎⁎
[−1.+10] −0.1132⁎⁎⁎ −0.0016⁎⁎⁎ −0.0243⁎⁎⁎ −0.1116⁎⁎⁎ −0.1000⁎⁎⁎ −0.0048⁎⁎⁎ 0.0055⁎⁎⁎ −0.0952⁎⁎⁎
[−1.+20] −0.1509⁎⁎⁎ 0.0122⁎⁎⁎ −0.0252⁎⁎⁎ −0.1631⁎⁎⁎ −0.0400⁎⁎⁎ −0.0056⁎⁎⁎ −0.0232⁎⁎⁎ −0.0344⁎⁎⁎
[−1.+30] −0.2264⁎⁎⁎ 0.0193⁎⁎⁎ −0.0019⁎⁎⁎ −0.2457⁎⁎⁎ −0.0200⁎⁎⁎ −0.0035⁎⁎⁎ −0.0176⁎⁎⁎ −0.0165⁎⁎⁎
N 90,564 484,073 342,462 90,564 484,073 342,462
⁎ Indicates significance at the 10% level.
⁎⁎ Indicate significance at the 5% level.
⁎⁎⁎ Indicate significance at the 1% level.
share price fell substantially in comparison to similar events due to the abnormal conditions associated with the disasters. To
identify events which could have generated potential significant effects outside of the disasters that are the primary focus of
this research, we conducted a thorough news analysis using the LexisNexis, Bloomberg and Thomson Reuters Eikon databases sur-
rounding the entire period of analysis, through which no events of a similar scale of either international attention or the gener-
ation of negative investor response could be identified. Re-estimating the above analysis with a number of relatively minor
structural events such as corporate hires and board changes, no significant deviation on the above presented results could be
identified.
The study further considers as to whether there was consistent pressures on Malaysia Airlines share price volatility in the pe-
riod following both disasters. Fig. 4 shows that there was a sudden and sharp collapse in share prices following the loss of both
aircraft, however the subsequent nationalisation of the company resulted in an increase in share price for one month after the
announcement was released to the market (7 August 2014). Table 3, highlights the results of the selected GARCH methodology,
which presents evidence of significant elevations in volatility of +0.535% and +0.182%. However, following the nationalisation of
the company, volatility increased at a very moderate rate of +0.018%. There is evidence to suggest that the loss of both flights led
to both an increased and sustained elevation in share price volatility, while the company's nationalisation led to a period of rel-
ative stability thereafter. The similarity of the results presented in the full specification methodology adds considerable robustness
to these findings. Further, we must consider the interactions of Malaysia Airlines with its industrial peers. The company is found
to interact far more substantially with the Bursa Malaysia (+1.082) than that of its industrial peers (+0.408). These significant
correlations present interesting evidence as to the regional and quite isolated behaviour of Malaysia Airlines since 2005.
In Table 3, further observe the estimates of the DCC-GARCH analysis that investigates the dynamic correlations between
Malaysia Airlines and both the Bursa Malaysia and the Aviation Performance Index. Estimates identify similar elevated relation-
ships between Malaysia Airlines and the domestic Malaysia index when compared to industry peers. Fig. 5 presents the modelled
dynamic correlations, indicating increasing levels of correlation with industrial peers during the loss of both flights and quite sub-
stantially during the process of nationalisation. It is interesting to note that dynamic correlations between Malaysia Airlines and
the Bursa Malaysia appear to fall during the aftermath of both disasters, indicative of evidence of changing correlation behaviour.
While identifying a close alignment between Malaysia Airlines and the national index on which it trades when compared to
other industrial peers, we must also consider the source of information flows and as to how this dynamic potentially changed
during this period of uncertainty. Table 4, displays six distinct scenarios. Scenarios one through three analyse the periods prior
to the disappearance of MH370; the time period between the loss of MH370 and the loss of MH17, and the third scenario analyses
the period up to the point of nationalisation. Scenarios four, five and six focus on information flows through 2012, 2013 and 2014
respectively.
It is immediately clear that in scenarios one, four and five, all of which analyse the period before the disappearance of flight
MH370, Malaysia Airlines is firmly the recipient of information flows from both the domestic index and its industrial peers. How-
ever, while only moderate changes are presented in scenario two which considers the period after the loss of MH370, this same
relationship changes considerably. Before nationalisation, and considering that Malaysia Airlines remained considerably exposed
to external factors, the company had become more influential and shocks appeared to be capable of propagating upon external
agents.
Analysing airline seat supply and passenger demand dynamics over time
The presented financial market behaviour presents clear evidence of both the distinct and acute reputational problems that
faced the board of management of Malaysia Airlines. While the company made immediate steps to streamline operations and re-
duce costs, there existed an equally important decision as to how the company could entice concerned passengers to avail of their
selection of flights. The next stage of the analysis focuses specifically on the response by Malaysia Airlines to adjust their seat
11S. Corbet, M. Efthymiou, B. Lucey et al. Annals of Tourism Research 87 (2021) 103109
capacity and realign their network to accommodate for the lower number of passengers who booked tickets with the incumbent.
Fig. 6, shows clear evidence that Malaysia Airlines significantly reduced its seat capacity in many of its markets after the tragedies
and its subsequent nationalisation. It is noted that it substantially decreased its presence in the Middle Eastern market but this
decline is based on relatively low comparable seat flows, possibly because this market was already under-performing
Fig. 4. High frequency share price response to key Malaysia Airlines events.
12S. Corbet, M. Efthymiou, B. Lucey et al. Annals of Tourism Research 87 (2021) 103109
Fig. 4 (continued).
commercially and was easy to curtail. However, at its domiciled regional market of Southeast Asia where it is most dominant, we
also observe a sharp decline, however it appears to contract to levels observed in the period between 2012 and 2013. Similar ev-
idence is observed in the Southwest Pacific and Southern Asian markets, while the seat capacity to Western European airports
posted substantial declines, found to be in excess of 70% between 2014 and 2017, the company clearly wanted to concentrate
on nearby markets to capitalise of the longevity of its historical brand strength. The North-Asian market also underwent
13S. Corbet, M. Efthymiou, B. Lucey et al. Annals of Tourism Research 87 (2021) 103109
Table 3
Multivariate GARCH and DCC-GARCH methodologies analysing Malaysia Airlines response to major events.
Specification Pre-MH370 MH370 MH17 Nationalisation Total Period DCC-GARCH
Model M1 M2 M3 M4 M5 M6
R1 −0.0406⁎ −0.0438⁎⁎ −0.0405⁎ −0.0406⁎ −0.0439⁎⁎ −0.0560⁎
(−1.93) (−2.09) (−1.92) (−1.93) (−2.09) (−1.86)
Av. sector 0.4074⁎⁎⁎ 0.3969⁎⁎⁎ 0.4055⁎⁎⁎ 0.4078⁎⁎⁎ 0.3964⁎⁎⁎ 0.3871⁎⁎⁎
(4.70) (4.33) (4.67) (4.71) (4.31) (4.19)
Bursa Mal. 1.0818⁎⁎⁎ 1.0826⁎⁎⁎ 1.0817⁎⁎⁎ 1.0818⁎⁎⁎ 1.0824⁎⁎⁎ 1.1619⁎⁎⁎
(23.58) (23.82) (23.57) (23.57) (23.80) (15.72)
Monday – – – – – −0.0032⁎
– – – – – (−1.89)
Tuesday 0.0008 0.0007 0.0008 0.0008 0.0007 −0.0022
(0.82) (0.78) (0.82) (0.82) (0.77) (−1.46)
Wednesday 0.0016 0.0017 0.0016 0.0016 0.0017 −0.0018
(1.47) (1.58) (1.47) (1.47) (1.58) (−1.28)
Thursday 0.0018 0.0017 0.0018 0.0018 0.0017 –
(1.50) (1.38) (1.51) (1.50) (1.39) –
Friday 0.0006 0.0006 0.0006 0.0006 0.0006 −0.0022
(0.54) (0.55) (0.54) (0.54) (0.55) (−1.41)
D1 (MH370) 0.0535⁎⁎⁎ – – 0.0497⁎⁎⁎ –
– (5.21) – – (4.99) –
D2 (MH17) – – 0.0182⁎⁎⁎ – 0.0142⁎⁎⁎ –
– – (4.20) – (4.01) –
D3 (Nationalisation) – – – 0.0018⁎ 0.0012⁎ –
– – – (1.99) (1.82) –
Constant 0.0001⁎⁎⁎ 0.0001⁎⁎⁎ 0.0001⁎⁎⁎ 0.0001⁎⁎⁎ 0.0001⁎⁎⁎ 0.0001⁎⁎⁎
(13.11) (13.03) (13.08) (13.10) (13.00) (10.03)
ARCH 0.2331⁎⁎⁎ 0.2377⁎⁎⁎ 0.2330⁎⁎⁎ 0.2331⁎⁎⁎ 0.2377⁎⁎⁎ 0.2315⁎⁎⁎
(13.53) (13.80) (13.52) (13.53) (13.80) (9.11)
GARCH 0.5099⁎⁎⁎ 0.5218⁎⁎⁎ 0.5092⁎⁎⁎ 0.5100⁎⁎⁎ 0.5217⁎⁎⁎ 0.5169⁎⁎⁎
(15.80) (16.65) (15.72) (15.79) (16.61) (11.82)
Note: T-statistics are in parentheses.
⁎ Indicates significance at the 10% level.
⁎⁎ Indicate significance at the 5% level.
⁎⁎⁎ Indicate significance at the 1% level.
substantial realignment as MH370 was operating to China, but the capacity supplied by Malaysia Airlines had recovered by 2018,
some four years after the accident. Evidence suggests that the company was expanding throughout the sector quite substantially
in the period between 2012 and 2014 before the accidents. Thus, the deterioration in the company's route network was particu-
larly damaging for the airline as well as Malaysia's connectivity with tourism origin countries.
In Table 5, we observe the seasonally-adjusted effects of the Malaysia Airlines disaster using the regression methodology
outlined in Data and methodology. We observe that the largest significant passenger declines to the loss of flight MH370 occurred
in Southwest Pacific, closely followed by Southeast Asia and South Asia. Results for the Middle East and Northeast Asian markets
are found to be not significant. When comparing accidents, the Southwest Pacific and Southeast Asian markets respond more neg-
atively to the loss of MH370 than that of MH17 as the aircraft was reported to be operating in these regions before its disappear-
ance. It is of interest to note that passenger numbers are found to continue their seasonally-adjusted decline after the point of
corporate nationalisation of Malaysia Airlines, presenting evidence that this final attempt to save the company was not enough
to mitigate the severe reputational damage that had occurred.
The depth of this damage is even more evident when observing both Fig. 7 and Table 6. Both present evidence of the varying
responses of fares charged by ticket-class by Malaysia Airlines in the periods after the tragedies. We observe evidence of the ef-
fects of a significant decline in the pricing of all Australian-based routes as there are substantial traffic flows between Europe and
Australia as well as Asia to Australia, while airlines try to capture these lucrative traffic flows by exercising sixth freedom traffic
rights via airport hubs such as Kuala Lumpur. Malaysia Airlines was attempting to prevent this traffic leakage to other carriers as a
result of the accidents and subsequent nationalisation by lowering fares. There is clear evidence that the discount coach passenger
fares to destinations such as Asia and Europe were also significantly reduced as these passengers are very price sensitive and are
not so aligned to frequent flyer programs as their business class counterparts.
To analyse Hypothesis H7, we focus on Table 7, which presents the results of a seasonally-adjusted, non-regional analysis of
ticket pricing across all classes of travel and across all routes offered by Malaysia Airlines. Dummy variables are again utilised
to determine the points at which the MH370 and MH17 disasters occur along with the company's nationalisation. It is of interest
to observe the acute declines in ticket pricing for the most price sensitive passengers (discount coach) in the aftermath of both
tragedies, with a sharper reduction calculated in the aftermath of the second incident. It would appear that Malaysian Airlines
responded to the loss of the first plane with an immediate reduction of discount coach ticket prices (−6.94%), but had to further
reduce fares after the second incident (−10.61%). Malaysia Airlines enforced drastic measures after the second accident, by
14S. Corbet, M. Efthymiou, B. Lucey et al. Annals of Tourism Research 87 (2021) 103109
Fig. 5. Conditional correlations between Malaysia Airlines, industry peers and the Bursa Malaysia.
15S. Corbet, M. Efthymiou, B. Lucey et al. Annals of Tourism Research 87 (2021) 103109
Table 4
The Information flow of investors due to the Malaysia Airlines disasters.
Aviation index Bursa Malaysia
IS IS rev. CS ILS Lags IS IS rev. CS ILS Lags
Scenario 1 From MA 0.0008 0.0129 0.0049 0.0740 2 0.0001 0.0029 0.0013 0.2984 3
Jan 2014 to MH370 loss To MA 0.9992 0.9871 0.9951 0.9259 0.9999 0.9971 0.9986 0.7015
Scenario 2 From MA 0.0198 0.0335 0.0273 0.2117 2 0.0222 0.0395 0.0311 0.3138 4
MH370 loss to MH17 loss To MA 0.9802 0.9665 0.9727 0.7882 0.9778 0.9605 0.9688 0.6861
Scenario 3 From MA 0.0539 0.0322 0.0736 0.3112 2 0.0836 0.0544 0.0864 0.2648 2
MH17 loss to nationalisation To MA 0.9461 0.9678 0.9264 0.6887 0.9164 0.9456 0.9135 0.7351
Scenario 4 From MA 0.0029 0.0016 0.0069 0.0715 2 0.0258 0.0302 0.0318 0.2914 2
Full year of 2012 To MA 0.9971 0.9984 0.9931 0.9284 0.9742 0.9698 0.9681 0.7085
Scenario 5 From MA 0.0015 0.0020 0.0083 0.1689 2 0.0337 0.0326 0.0409 0.2893 2
Full year of 2013 To MA 0.9985 0.9980 0.9917 0.8310 0.9663 0.9674 0.9590 0.7106
Scenario 6 From MA 0.0475 0.0191 0.0587 0.2924 2 0.0701 0.0577 0.0627 0.2455 2
Full year of 2014 To MA 0.9525 0.9809 0.9413 0.7075 0.9299 0.9423 0.9372 0.7544
reducing Business class fares in order to retain existing clients and attract new customers, which signals that its most important
high yield clientele base were switching to other carriers. While not only faced with the widespread international reputational
damage and the costs associated with the tragedies, the company was losing key and high yield market segments, namely, busi-
ness class passengers. This provides clear evidence of the distinct and acute problems that faced the board of management at this
time. The response to continue operations and maintain a passenger base through reduced ticket pricing appeared to have failed
as numbers continued to fall quite substantially across a number of key routes. These effects were felt most severely on the
company's European and South Asian routes, both of which acted as epicentres in the immediate aftermath of the incidents.
Table 8 outlines the results of the seasonally-adjusted passenger flows by class from the key regions on which Malaysia Air-
lines served after these catastrophes. Hypothesis H8 focuses on the domestic Malaysia market, where only moderate, significant
seasonally-adjusted reductions in passenger flows are identified for economy passengers (−4.70%). There is no discernible evi-
dence of significant effects for both domestic business and first class passengers. There are a number of possible explanations
for such a result. Firstly, MA benefited from the implicit national brand loyalty associated with being the national flag carrier. Sec-
ond MA was a member of the Oneworld alliance which can be read as an implicit endorsement by each other member. Finally its
longevity and market power, having been founded in 1972, well before its local competitor Air Asia. This finding is in contrast
with the case of the 9/11 terrorist attacks, where Blunk et al. (2006) found that the attack had a significant short-run impact
on the domestic US market which did not return to the levels that would have existed in the absence of the attack. This may
be explained by the fact that Malaysians understood that the incidents were beyond the control of the carrier and there were
no chances of re-occurrence.
Meanwhile, Hypothesis H9 focuses on the regional markets where Table 8 also portrays evidence of sharp reductions in pas-
senger flows by type of class travelled, particularly in the cases of Australia and Europe. The loss of flight MH17 appears to have
generated severe European reputational damage for the company with seasonally-adjusted flows found to have fallen in excess of
16% across first, business and economy classes, while the Australian market experienced higher reductions, despite the substantial
fare reductions that were offered by Malaysia Airlines. Such results present evidence of strong regional differentials in the behav-
iour of the passengers, even by sub-category of ticket type. There is no evidence of a significant effect for Asian markets excluding
China, which is analysed in Table 9.
The case of Chinese ticket demand is particularly important as flight MH370 was en-route to Beijing and it was code sharing
with China Southern Airlines, which implies that the Chinese carrier sold tickets for profit on the doomed airliner with the loss of
153 Chinese citizens. The media coverage of the loss of the aircraft was even more pronounced as the search initially indicated
that the aircraft could possibly have ended up in Chinese airspace. However the triangulation of lack of clarity about the situation;
the perceived lack of compassion for families; and the lack of detailed information to the whereabouts of the aircraft, instigated
reputational damage, and even anger in China towards Malaysia Airlines. The seasonally-adjusted analysis focuses on passenger
numbers both into and out of Chinese airports. While there is no significant evidence of changes in passenger flows into China
using Malaysia Airlines, the opposite effect is palpable with traffic flows out of China. There is a sharp drop in price sensitive pas-
sengers travelling from China (−17.11%) with equally substantial, however, insignificant results identified for both business class
and first class passengers. The research indicates that Malaysia Airlines' encountered reputational damage in many of its key mar-
kets in the aftermath of severe tragedies. The regional side-effects of these disasters would act as a particularly strong direction for
future research, with particular emphasis on the regional and national responses from which many tourism-dependent areas
attempted to mitigate suppressed demand due to issues such as passenger fear and anxiety in the aftermath of the Malaysia Air-
lines disasters.
The case of Malaysia Airlines appears to be most likely defined by both inefficiency and bad luck. It was unfortunately the vic-
tim of two consecutive low-probability, but not improbable events, however, the company then appears to have fallen victim to
the corporate environment that it had created for itself over four decades of trading. The MYR1.38 billion presence of broad losses
and inefficiencies were very much central to the company's poor performance since the Asian financial crisis and again from the
16S. Corbet, M. Efthymiou, B. Lucey et al. Annals of Tourism Research 87 (2021) 103109
Fig. 6. Seats supplied by Malaysian Airlines by region (2000–2018).
17S. Corbet, M. Efthymiou, B. Lucey et al. Annals of Tourism Research 87 (2021) 103109
Fig. 6 (continued).
18S. Corbet, M. Efthymiou, B. Lucey et al. Annals of Tourism Research 87 (2021) 103109
Table 5
Seasonally-adjusted effects of the Malaysia Airlines Disasters on Seats Sold by Region.
Southwest Pacific Middle East Western Europe Southeast Asia South Asia Northeast Asia
Model type D1&2 DN D1&2 DN D1&2 DN D1&2 DN D1&2 DN D1&2 DN
D1 −0.320⁎⁎⁎ – −0.339⁎⁎ – −0.160 – −0.258⁎⁎⁎ – −0.391⁎⁎⁎ – 0.036 –
(−6.77) – (−1.52) – (−0.76) – (−5.24) – (−2.59) – (0.63) –
D2 −0.203⁎⁎⁎ – −0.374⁎ – −0.156 – −0.196⁎⁎⁎ – −0.450⁎⁎⁎ – 0.088 –
(−5.38) – (−1.94) – (−0.86) – (−4.79) – (−3.43) – (0.17) –
Dnation. – −0.221⁎⁎⁎ – −0.466⁎⁎⁎ – −0.043 – −0.202⁎⁎⁎ – −0.529⁎⁎⁎ – −0.002
– (−7.29) – (−4.70) – (−0.44) – (−10.79) – (−8.21) – (−0.06)
R2 0.2776 0.2289 0.0875 0.132 0.1186 0.088 0.2038 0.3969 0.1408 0.2482 0.0488 0.0341
Adj. R2 0.2333 0.1855 0.0314 0.0831 0.0415 0.047 0.155 0.3629 0.0881 0.2082 0.0095 0.0203
No. of obs 226 226 226 226 226 226 226 226 226 226 226 226
Prob > F 0.0000 0.0000 0.0982 0.0021 0.0902 0.0995 0.0000 0.0000 0.0881 0.0000 0.6209 0.8178
Root MSE 0.1385 0.1428 0.4795 0.4666 0.4515 0.4527 0.1016 0.08823 0.3251 0.3034 0.1596 0.1604
Note: T-statistics are presented in parentheses.
⁎ Indicates significance at the 10% level.
⁎⁎ Indicate significance at the 5% level.
⁎⁎⁎ Indicate significance at the 1% level.
2007 global financial crisis. Meanwhile industry peers were advancing and taking more and more market share, while Malaysia
Airlines had been struggling to remain financially viable. The 2014 tragedies were simply two incredibly unlucky events that
pushed the company to what must be observed as an inevitable demise. But, can we devise an optimal response to such disasters
in the future? Simply, the answer is no. Malaysia Airlines selected the correct course of response in the aftermath of these events
by reducing capacity and cutting fares to entice passenger demand. However, the damage to both the brand and the corporate
reputation appears to have been insurmountable. Nationalisation was the sole rational option in the face of bankruptcy, the latter
option being exceptionally detrimental to the region's broad tourism industry. The Malaysian government needed to safeguard its
tourism and ring-fence its flag carrier which was an essential tourism pillar whose reputation had suddenly imploded. Undoubt-
edly, the decision to nationalise Malaysia Airlines was the correct, if not too late.
Fig. 7. Malaysia Airlines pricing both by region and by ticket type.
19S. Corbet, M. Efthymiou, B. Lucey et al. Annals of Tourism Research 87 (2021) 103109
Table 6
Seasonally-adjusted effects of the Malaysia Airlines disasters on seats supplied by region.
Business class First class Discount coach
Asia Australia Europe Asia Australia Europe Asia Australia Europe
Dnat −0.0123 −0.2060⁎⁎⁎ −0.0057 0.0531 −0.6032⁎⁎⁎ 0.0947 −0.1136⁎⁎ −0.2984⁎⁎⁎ −0.1333⁎⁎⁎
(−0.17) (−3.66) (−0.07) (0.68) (−3.35) (1.01) (−2.32) (−3.45) (−2.45)
R2 0.3427⁎ 0.3584 0.3807 0.2941 0.3622 0.3659 0.3551 0.3267 0.4106
Adj. R2 0.2670 0.2894 0.2211 0.1298 0.2948 0.2100 0.2846 0.2444 0.3635
No. of obs 226 226 226 226 226 226 226 226 226
Prob > F 0.0978 0.1478 0.1861 0.1480 0.2364 0.2258 0.2580 0.3535 0.1210
Root MSE 0.2275 0.1781 0.2504 0.2482 0.5689 0.2954 0.1548 0.2735 0.1720
Note: T-statistics are presented in parentheses.
⁎ Indicates significance at the 10% level.
⁎⁎ Indicate significance at the 5% level.
⁎⁎⁎ Indicate significance at the 1% level.
Conclusion
For an airline, the loss of an aircraft in tragic circumstances is a scenario that must be realistically stress tested due to its low
probability. However, the loss of two commercial airliners within five months is unprecedented. Incredibly, this is what happened
to Malaysia Airlines, a scenario that led to the nationalisation of the company in an attempt to protect both the Malaysia tourism
industry and the twenty thousand employees that relied on the company's survival. We find that the share price response to both
tragedies was immediate and substantial, even when compared to similar events experienced by competitor airlines. The elevated
levels of volatility was both substantial and prolonged, generating a hostile environment in which the corporate entity had to
make challenging decisions. The reverberating shocks were also so substantial as to change long-standing correlations and
information flows. Further, in response to such a stark challenge, the management of Malaysia Airlines made the decision to
scale-down capacity and lower fares to mitigate the substantial fall off in passenger numbers that had been experienced across
its network. However, this was of little advantage.
Our research indicates that Malaysia Airlines significantly reduced its capacity in many of its key markets such as its domiciled
regional market of Southeast Asia to levels observed some three years earlier. However, its European market was extensively im-
pacted as it cut capacity in excess of 70% between 2014 and 2017. The occurrence of two airline disasters for the same company
in such close temporal proximity undoubtedly worked to reinforce negative perceptions.
The study also indicates that Australian, Chinese and European passengers immediately moved away from Malaysia Airlines in
the aftermath of the tragedies, focusing more on the perceptions of safety rather than on monetary gains derived from lower fares
offerings. The carrier engaged in significant fare reductions after each accident for both price sensitive passengers travelling in
economy class as well as its most important clientele base of business travellers who were switching to other rival carriers. Cal-
culations revealed that economy passengers travelling on domestic markets with the incumbent instantly fell by almost 5%, while
severe reputation damage was evident in European markets as traffic flows had fallen by over 16% across all classes (economy,
business, first), while the Australian market witnessed even higher plunges despite the substantial fare offerings initiated by
Table 7
Seasonally-adjusted effects of the Malaysia Airlines disasters on ticket pricing by ticket class.
Business class First class Premium coach Discount coach
Model type D1&2 DN D1&2 DN D1&2 DN D1&2 DN
D1 −0.0384⁎ – 0.0372 – 0.0519 – −0.0694⁎⁎⁎ –
(−0.26) – (0.11) – (0.14) – (−4.39) –
D2 −0.3383⁎⁎ – −0.1838 – 0.0066 – −0.1061⁎⁎⁎ –
(−2.01) – (0.23) – (0.02) – (−6.71) –
Dnat – −0.1814 – 0.0772 – −0.1259⁎⁎⁎ – −0.0716⁎⁎⁎
– (−1.16) – (0.45) – (−3.96) – (−5.42)
R2 0.4255 0.3666 0.3132 0.2846 0.2246 0.2265 0.2558 0.2519
Adj. R2 0.1574 0.101 0.201 0.1155 0.1372 0.1453 0.1985 0.1618
No. of obs 226 226 226 226 226 226 226 226
Prob > F 0 0.051 0.4975 0.5189 0.8265 0.1535 0.0915 0.0782
Root MSE 0.2142 0.2236 0.2416 0.2426 0.5596 0.3857 0.16636 0.1641
Note.
⁎ Indicates significance at the 10% level.
⁎⁎ Indicate significance at the 5% level.
⁎⁎⁎ Indicate significance at the 1% level.
20S. Corbet, M. Efthymiou, B. Lucey et al. Annals of Tourism Research 87 (2021) 103109
Table 8
Domestic and international seat demand changes in the period after the Malaysia Airlines disasters.
Hypothesis H8 Hypothesis H9
Malaysia Asia (excl. China) Australia Europe
All internal flights All flights (both in and out) All Flights (both in and out) All flights (both in and out)
Business Economy 1st class Business Economy 1st class Business Economy 1st class Business Economy 1st class
Jan −0.09669 −0.0879 −0.0710 −0.0917 −0.0874 −0.0243 −0.0848 −0.0530−0.6408 0.1235 0.1357 0.0810
(−0.85) (−0.84) (−0.68) (−0.86) (−0.86) (−0.27) (−0.68) (−0.51)(−1.76) (1.00) (1.13) (0.44)
Feb 0.0182 0.0428 0.0327 0.0337 0.0498 0.0311 0.0811 0.0434 −0.5276 0.0724 0.0638 −0.0417
(0.16) (0.41) (0.31) (0.32) (0.49) (0.34) (0.65) (0.41) (−1.45) (0.58) (0.53) (−0.23)
Mar 0.1210 0.1549 0.2213⁎⁎ 0.1322 0.1602 0.2435⁎⁎⁎ −0.0323 0.1749⁎−0.4741 0.2569⁎⁎ 0.3199⁎⁎⁎ 0.2795
(1.07) (1.48) (2.12) (1.24) (1.57) (2.69) (−0.26) (1.67) (−1.30) (2.07) (2.67) (1.53)
Apr 0.1228 0.0943 0.1865 0.1332 0.1044 0.1658 0.0592 0.0612 −0.2905 0.2879⁎⁎ 0.1872 0.2412
(0.94) (0.78) (1.55) (1.08) (0.88) (1.58) (0.41) (0.51) (−0.69) (2.01) (1.35) (1.14)
May 0.1447 0.0725 0.1731⁎ 0.1409 0.0656 0.1633 0.2548⁎ 0.1545⁎⁎
0.0126 0.1838 0.0300 0.2995
(1.28) (0.69) (1.66) (1.32) (0.64) (1.80) (2.03) (1.48) (0.03) (1.48) (0.25) (1.64)
Jun 0.2170⁎ 0.1641 0.2138⁎⁎ 0.2128⁎⁎ 0.1545 0.2282⁎⁎ 0.2924⁎⁎ 0.3438⁎⁎⁎ −0.1546 0.3620⁎⁎⁎ 0.2659⁎⁎ 0.4842⁎⁎⁎
(1.92) (1.57) (2.05) (1.99) (1.51) (2.52) (2.33) (3.28) (−0.43) (2.92) (2.22) (2.65)
Jul 0.0299 −0.0414 0.1444 0.0378 −0.0381 0.1639 −0.0690 −0.0378 −0.2800 0.2842⁎⁎ 0.1568 0.3841⁎⁎
(0.26) (−0.40) (1.38) (0.35) (−0.37) (1.81) (−0.55) (−0.36) (−0.77) (2.29) (1.31) (2.10)
Aug 0.0277 −0.0128 0.0849 0.0187 −0.0241 0.0433 0.0829 0.1301 −0.0711 0.1047 0.0918 0.0897
(0.25) (−0.12) (0.81) (0.17) (−0.24) (0.48) (0.66) (1.24) (−0.20) (0.84) (0.77) (0.49)
Sept 0.1710 0.1068 0.1704 0.1574 0.0912 0.1448 0.1909 0.3026⁎⁎⁎ −0.0437 0.2155⁎ 0.1389 0.2859
(1.51) (1.02) (1.63) (1.47) (0.89) (1.60) (1.52) (2.89) (−0.12) (1.74) (1.16) (1.57)
Oct 0.1079 0.0651 0.0435 0.1017 0.0534 0.0875 0.1946 0.1983⁎ −0.0743 0.1189 −0.0111 0.1633
(0.95) (0.62) (0.42) (0.95) (0.52) (0.97) (1.55) (1.89) (−0.20) (0.96) (−0.09) (0.89)
Nov 0.1280 0.1202 0.1820⁎ 0.1157 0.1027 0.2057⁎⁎ 0.2886⁎⁎ 0.3339⁎⁎⁎ 0.0343 0.3166⁎⁎ 0.2172⁎ 0.4028⁎⁎
(1.13) (1.15) (1.74) (1.08) (1.01) (2.27) (2.30) (3.19) (0.09) (2.55) (1.81) (2.21)
Dec −0.0837 −0.0477 0.0095 −0.0923 −0.0492 0.0045 −0.0670 0.0591 −0.1747 0.0548 0.0634 0.0175
(−0.74) (−0.46) (0.09) (−0.86) (−0.48) (0.05) (−0.53) (0.56) (−0.48) (0.44) (0.53) (0.10)
Dnat 0.0324 −0.0470 0.0148 0.0343 0.0470 0.0436 −0.1765⁎⁎ −0.2291⁎⁎ −0.3171⁎⁎⁎ −0.1620⁎⁎ −0.1842⁎⁎⁎ −0.1691
(0.29) (2.45) (0.14) (0.32) (0.46) (0.48) (−2.41) (−2.19) (−2.87) (−2.31) (−3.54) (−0.93)
2
R 0.3088 0.2670 0.3607 0.3246 0.2656 0.4163 0.4413 0.5281 0.1953 0.3691 0.3289 0.3625
Adj. R2 0.2093 0.1506 0.2836 0.2032 0.2526 0.1634 0.1991 0.3236 0.1534 0.2957 0.2381 0.2863
No. of obs 226 226 226 226 226 226 226 226 226 226 226 226
Prob > F 0.4495 0.6173 0.2656 0.3890 0.6228 0.1270 0.0858 0.0157 0.8657 0.2403 0.3733 0.2599
Root MSE 0.1599 0.1478 0.1478 0.1512 0.1444 0.1281 0.1774 0.1481 0.5143 0.1754 0.1696 0.2599
Note.
⁎ Indicates significance at the 10% level.
⁎⁎ Indicate significance at the 5% level.
⁎⁎⁎ Indicate significance at the 1% level.
the carrier to circumvent the leakage. To compound an already perilous situation, its outbound China leisure traffic fell by 17%,
with equally substantial reductions in premium traffic as MH370 was code sharing with China Southern and as a result 64% of
the passengers who were on-board the doomed airliner were Chinese citizens, which significantly damaged its reputation in
China. It was at this point that Malaysian Airlines was in a vulnerable situation. The reputation damage was simply too acute,
ever exacerbated by the long-standing search for a missing long-range aircraft which ambiguously positioned flight MH370, as
one of the greatest aviation mysteries of the twenty-first century.
However, long-standing issues within the structure of Malaysian Airlines also appear to have been the catalyst for its commer-
cial decline. It was already in financial difficulties prior to the 2014 catastrophes, as it had amassed losses of 1.2 billion dollars
from 2011 to 2013. As noted earlier the share price had plummeted in the aftermath of both tragedies, when compared to com-
panies who experienced similar severe tragedies, yet multiple significant factors also increased the company's probability of de-
fault. These factors included more lean and efficient regional competitors such as AirAsia who was fast gaining traction in
markets out of Malaysia, while new entrant established flag carriers such as British Airways identified opportunities due to
such weakened opposition and entered into the lucrative Malaysia to UK market. Finally, the growing presence of social media
was another key factor in damaging Malaysia Airlines which was evident from the substantially negative responses originating
from both Chinese and European passengers in the periods after the 2014 tragedies. While management were attempting to ex-
plain the anomalies to the public there was an associated mixture of ineptitude and inability to answer decisive questions such as
why was MH17 operating over an active conflict zone? Or, how does an airline simply lose track of the location of an aircraft in
today's high technology landscape? While rational answers may exist, to the families of the victims of both tragedies they bare
little consequence.
The combination of these factors generated an environment in which Malaysia Airlines was most likely going to experience
failure. To present the best opportunity for the Malaysian tourism sector, it was necessary, and the most prudent choice for the
21You can also read