Applying barrier analysis to overspeed events in rail operations
←
→
Page content transcription
If your browser does not render page correctly, please read the page content below
Ergonomics & Human Factors 2021, Eds R Charles & D Golightly, CIEHF

Applying barrier analysis to overspeed events in
rail operations
Nora Balfe1,2, Ken Byrne1 & Ron McLeod3
1
Iarnród Éireann Irish Rail, 2Trinity College Dublin, 3Ron McLeod Ltd.

ABSTRACT
Irish Rail has applied the Bowtie Analysis method and followed the CIEHF White Paper guidance
on Barrier Management to analyse the risk from overspeed events on the national rail network. The
analysis was performed in the early days of the COVID19 restrictions, requiring a virtual approach
to the analysis, rather than the normal face-to-face workshop format. This paper briefly describes
the process followed and the results obtained, focusing on the learnings and potential improvements
to the process, rather than the technical details of the analysis. These include: at what point in the
bowtie development process to include frontline expertise; prioritising threats and consequences
identified so that most effort can be focussed on the most important controls; the complexity of
degradation factors relating to human performance; and ensuring presentation of the results matches
the expectations of the stakeholder community.
KEYWORDS
Railway safety, barrier analysis, risk assessment, human performance

Introduction
Trains exceeding their permitted speeds (overspeed events) present a significant threat to the safety
of railway operations. Unlike road driving, train safety at higher speeds is not predominantly a
function of the skill of the driver but of the physics at the interface between the wheel and the rail.
Exceeding the permissible speed for a section of track has the potential to result in a range of
consequences from passenger discomfort at the lower end of the scale, to derailment, multiple
fatalities, infrastructure damage and significant financial loss at the upper end.
Irish Rail monitors overspeed trends on the network, traditionally using handheld radar guns but
increasingly via automatic detection of overspeeds using both trainborne and trackside monitoring
systems. The data obtained from these systems have raised the profile of overspeed events and
generated a desire to better understand the associated risk and how it is controlled. At the time of
writing (October) Irish Rail had recorded four significant overspeeds in 2020 compared to nine in
2019, eight in 2018 and 10 in 2017. The apparent reduction in 2020 may be due to reduced train
services during COVID-19 restrictions.
Internal safety investigations into overspeed events have generally identified train driver
performance as a causal factor. Currently, the Irish railway network does not have widespread
automated support to help drivers avoid or recover from overspeeds. There was therefore a desire to
better understand and evaluate the controls currently in place in relation to avoiding and recovering
from overspeeds, and how these could be improved upon both in terms of improvements to existing
controls and implementation of new controls.
Ergonomics & Human Factors 2021, Eds R Charles & D Golightly, CIEHF
Approach
Bowtie Analysis can be useful in assessing risk in railway operations (ORR, 2020; Turner et al,
2017). Recognising the central role of human performance – including train drivers, signallers,
technicians, management as well as potentially the general public – in preventing overspeed events,
Irish Rail were keen to follow the CIEHFs guidance and recommendations on good practice in
Human Factors in Barrier Management (CIEHF, 2016).
The analysis was initiated and planned to be carried out in early 2020, based on face-to-face
training and workshops held on Irish Rail premises. Restrictions imposed by the COVID-19 crisis
however required the approach to be re-planned such that it could be carried out virtually, without
requiring face-to-face meetings.
Irish Rail were also keen to avoid issues identified both by CIEHF and others that can limit the
quality of bowtie analysis (CIEHF, 2016); for example; treating human error as a threat; allowing
the analysis to be dictated by the functionality available in commercially available software tools;
and focusing on drawing bowtie diagrams before giving adequate consideration to the nature and
characteristics of the risks and controls involved (McLeod, et al, In Press).
Method
A working group was put together with expertise from across the organisation, including:
• Operational expertise, including train drivers, driver competence managers and operational
managers
• Civil engineering, responsible for designing, building and maintaining the track
infrastructure
• Safety managers, responsible for implementing and auditing rules and procedures
• Human factors specialist
The group was facilitated by an external Human Factors specialist with experience facilitating
Bowtie Analysis.
The analysis was structured around the first four stages of the 5-stage process developed by NHS
Education for Scotland (NES, 2020), including using worksheets to capture, document and evaluate
information generated at each stage before drawing Bowtie diagrams.
The definitions of control types defined by CIEHF were adopted (i.e. barriers, key safeguards and
safeguards). Full barriers were required to satisfy the six quality criteria defined by CIEHF: i.e.
“Having clear ownership, being traceable to the HSE management system, and being specific,
independent, effective and capable of being assured.” (CIEHF, 2016, section 2.5). Note that
preparation of the Barrier Management Plan and Human Performance Specifications for operational
controls (CIEHF, 2016) were not included in this phase of the work.
Due to the Covid-19 restrictions, the working group met virtually in five online meetings held on a
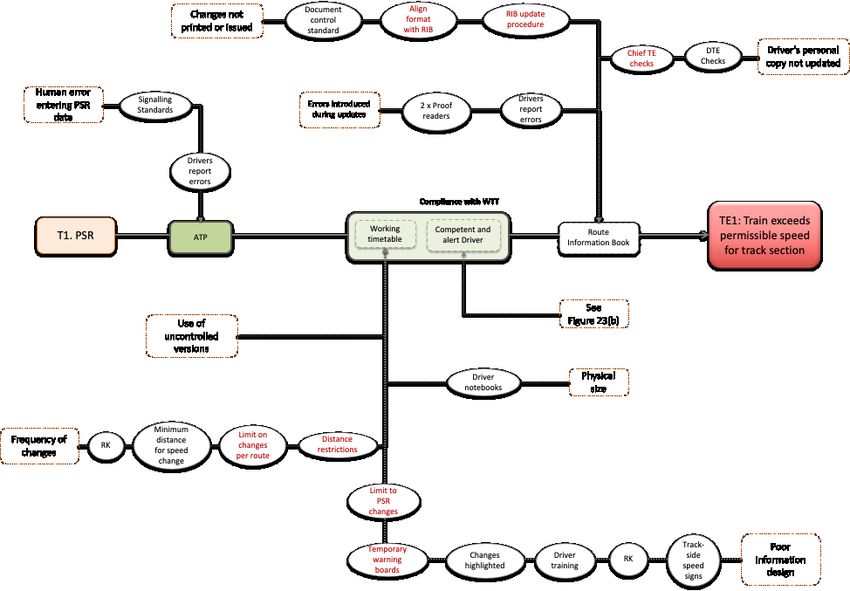
weekly basis. Figure one summarises the workflow of the virtual analysis. The meetings were held
for 2 hours on Mondays and comprised three elements: i) any training or refresher awareness
needed; ii) reviewing the results from the analysis from the previous week, and iii) initiating the
analysis for that week. The first meeting included extended awareness training, concentrating on the
concepts and terminology used in Bowtie Analysis and the 5-stage process. Following the Monday
meetings, the working group met without the facilitator to complete the analysis for that week. The
completed worksheets for each stage were returned to the facilitator each Friday such that they
could be used in preparation for the following Monday meeting.Ergonomics & Human Factors 2021, Eds R Charles & D Golightly, CIEHF
Figure 1: Summary of virtual analysis workflow
No customised bowtie software was used to support the analysis: information documented using the
worksheets was used as the basis for manually creating and amending diagrams (using Powerpoint)
once the information had been assessed and reviewed and was considered of sufficient quality.
Results
The results of the analysis were represented in two formats:
• An Excel workbook containing the full analysis in tabular format.
• A series of hierarchically organised bowtie diagrams showing progressively more detail.
Bowtie diagrams provide a visual representation of the risk space, and how it is controlled, in a way
that is easier to understand than a textual or tabular representation. Because different users of the
analysis need different perspectives on the risk, diagrams were presented at three levels of detail;
1. An ‘at-a-glance’ summary of the entire risk space on a single page;
2. Expanded diagrams of each of the threat and consequence lines, showing the degradation
factors and the number of safeguards protecting each control, and;
3. Detailed diagrams showing the safeguards protecting each of the controls against
degradation.
Due to the size and complexity of the bowtie diagrams produced, it is beyond the scope of this
paper to give a full description of the results. However, the left-hand side of the ‘at-a-glance’
diagram is shown in Figure 2. The figure shows that the hazard is the train’s kinetic energy, the top
event is that the train exceeds the permissible speed for the current track section and that eight
threats (at the far left of the diagram) have the potential to lead to the top event. Although at this
level there are no details included, the diagram shows the number, quality and type of controls as
well as the number of degradation factors identified for each control. Taking as an example
‘Failure of the (train’s) braking system’ (the fifth threat from the top), the diagram shows:
• The number of controls: Four controls are relied on, represented by the individual boxes
between the threat on the far left and the central event on the far right;Ergonomics & Human Factors 2021, Eds R Charles & D Golightly, CIEHF
• The quality of the controls: Two are full barriers while two are key safeguards; full barriers
are indicated by a solid border on the box while safeguards are indicated by a dashed border;
• The type of control: One of the barriers is technical (represented by the cogs icon) and the
other organisational (represented by the document icon), while there is one operational
(indicated by the person icon) and one organisational key safeguard;
• The number of degradation factors for each control: For example, for the full technical
barrier on the top threat line, four degradation factors were identified for the organisational
element, and five for the operational element.
The importance of human controls across the analysis can clearly be seen in Figure 2, by the
prevalence of the person icon.
Figure 2: ‘At-a-glance’ bowtie diagram for rail overspeeds (Left-hand side only)
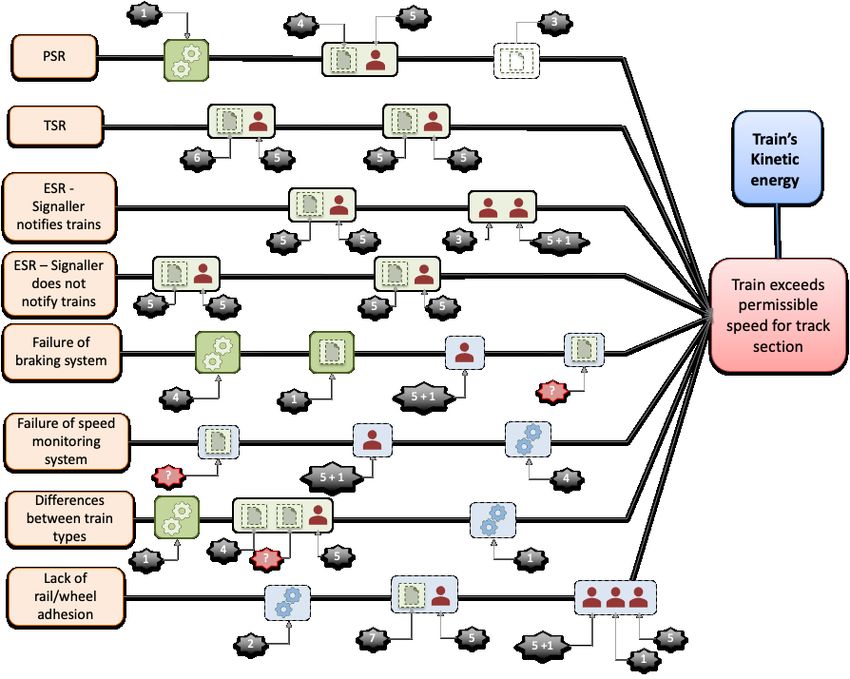
Figure 3 illustrates one of the most detailed diagrams, showing the safeguards protecting main
controls against degradation. In this diagram, the threat is a Permanent Speed Restriction (PSR), i.e.
a speed limit permanently applied to a particular section of track. There are three controls,
comprising two full barriers and one key safeguard. The first full barrier is a technical barrier of an
Automatic Train Protection (ATP) system which is in place in only some parts of the Irish Rail
network. This system supervises train speed and prevents the train from exceeding the permitted
speed. The second full barrier is achieved through a combination of a competent and alert driver
with the information on PSRs that is provided to drivers via the Working Timetable. The final keyErgonomics & Human Factors 2021, Eds R Charles & D Golightly, CIEHF
safeguard is the route information book provided to drivers that summarises the hazards, including
PSRs, for each route on the network.
The degradation factors for each of these barrier elements and safeguards are shown in Figure 3 at
the end of each line. For example, use of the Working Timetable can be degraded by;
1. The physical size which deters drivers from placing it on the driving console of the train;
2. Poor information design which impacts readability and usability;
3. Frequency of changes which can impact on driver ability to absorb information and hence
workload;
4. The use of uncontrolled versions which are not subject to document control
The red text on figure three indicates controls that, although not currently fully implemented, are
either in development or could, in principle, be implemented. Each degradation factor also has
controls; for example, in the case of the physical size of the Working Timetable, drivers sometimes
transfer the relevant information for their next journey to their own personal notebook.
Figure 3: Example of most detailed bowtie diagram showing safeguards against degradation of
main controls for an overspeed event associated with a Permanent Speed Restriction.
Discussion
The analysis produced a comprehensive picture of the threats that must be managed, the
consequences that could result, and the controls, both in existence and under development, that
must be managed to control the risk of overspeed events. Overall, use of the bowtie analysis method
produced a more focussed and targeted qualitative assessment of the risk than existing risk
assessments used by Irish Rail. The benefits include providing a thorough framework to support
auditing of compliance with existing controls.Ergonomics & Human Factors 2021, Eds R Charles & D Golightly, CIEHF Observations A number of observations were made about the process of conducting the analysis. First, several of the concerns with the treatment of human factors in bowtie analysis documented in the CIEHF white paper arose during the analysis. For example, the working group was initially keen to capture human error as a threat (reflecting the tendency of investigation reports to identify the immediate cause of an overspeed event as human error). This was overcome with the help of the facilitator and the group became convinced of the contradiction of designating the human elements, (predominantly the train driver in this case), as both a threat and a control for overspeeds. Second, understanding the concepts behind bowtie analysis involved a steep learning curve. That was true for those members of the working group who had previous experience in risk assessment but most particularly for those (such as train drivers) who did not have such prior experience. This was significantly more difficult due to the Covid-19 restrictions which limited face-to-face interactions and opportunities for informal queries and clarifications. The clear guidance from the CIEHF White Paper however provided a valuable structure: by the third meeting, the working group were confident in identifying controls and degradation factors for inclusion in the final bowtie. While the inclusion of operational stakeholders was extremely important, their contributions were made more in the later stages of the analysis in explaining what their actions are and what conditions exist to confound them (i.e. degradation factors). Taking account of the learning curve, it may have been beneficial for a smaller group to set the initial framework of the bowtie, (i.e. the top event, threats and consequences), and then invite the detailed expertise of the frontline staff to contribute to the development of the controls and degradation factors. Third, the composition of the working group, and particularly the inclusion of frontline operational and technical staff, meant that there was a good understanding of the nature and complexity of the tasks they face. It also meant it was possible to be confident that the group had avoided basing the analysis on ‘work-as-imagined’ rather than ‘work-as-done’. However, this did mean that the exercise was resource intensive. There were 18 staff members on the working group, and 12 meetings took place including the five primary workshops and seven additional follow-up internal meetings. Fourth, the offline meetings led to significant iteration as the analysis progressed, in particular clarifying the definitions and distinctions between the various threats and consequences, and the nature of the controls relied on. The need for these clarifications often only became clear as a result of consideration of the details of particular controls, degradation factors or their safeguards. This meant that elements of the analysis were changing even at very late stages in the analysis. It was therefore crucial to be prepared to amend and revise all elements of the analysis, even if they had been agreed early in the process. Finally, the fact that customised bowtie software was not used to support the analysis added very significantly to the time and effort needed to create and maintain the diagrams. It also meant that the final information is held in a spreadsheet format, limiting the ease of accessing, exploring and managing the data. These limitations were significant: in most cases, it would not be realistically practical to conduct a bowtie analysis of the same complexity without using commercial software. However, the benefit of creating the diagrams manually lay in the ability to focus attention and think much more clearly, deeply and creatively about the nature of the risks and the characteristics of the controls than would have been achieved had the process been driven and constrained by the capabilities of currently available software packages.
Ergonomics & Human Factors 2021, Eds R Charles & D Golightly, CIEHF

Opportunities for Improvement
Based on Irish Rail’s experience of this analysis, a number of opportunities for improving the
efficiency and usefulness of future Bowtie Analysis were identified.
Focusing on key threats
Prior to the analysis, the principal concerns were around failure of the controls intended to ensure
driver compliance with speed restrictions, whether permanent (PSR), temporary (TSR), or
emergency (ESR). Given the rigour and comprehensive nature of the analysis, five other threats
were also identified and analysed. While these are theoretically valid, operational experience
suggests they are not of the same level of concern as driver compliance with speed restrictions.
On reflection, it was felt that the analysis time could have been used more efficiently by focusing on
those threats where operational experience indicates there is most potential for an overspeed.
Focusing on threats of most concern would also aid communicating the outputs to the wider
stakeholder group. Although the overspeed analysis was comprehensive, its size and scope make it
difficult for stakeholders external to the working group to engage with. Prioritising threats and
consequences could generate more digestible outputs on a phased basis.
Meeting stakeholder expectations
There was some degree of dissociation between the expectations of the stakeholders involved in
initiating the analysis, and the way the results were presented. The analysis produced a
comprehensive and thorough review of the quality of existing controls and what is needed to assure
they perform as well as is expected and needed. It was recognised after the analysis however that
the initial motivation was to focus on identifying improvements that could be introduced over and
above existing controls. Many working group members were looking for concrete actions that could
improve current performance and reduce the residual risk level.
Possible improvements to existing controls as well as potential new controls that could be
introduced were captured and incorporated in the results. Although the expectation was that these
would be included in the development of the barrier management plan, they were not given special
emphasis or priority in the presentation of the results.
This lack of focus on recommending specific improvements meant that the expectations of some
members of the working group were not fully met. With hindsight, it may have been preferable to
give prominence and priority to highlighting improvement areas in the presentation of the results of
the analysis. These could serve as an input to development of the barrier management plan which
can then evaluate their feasibility and build a business case for investment. That said, the analysis
as it stands provides the opportunity for significant improvement in the management (and reduction
in the incidence) of future overspeed events if adequate attention is given to ensuring the controls
identified are monitored and assured to confirm they are performing the functions expected of them
to the standard required.
Conclusions
In summary, the exercise was beneficial in creating a baseline and improving awareness and
understanding of the threats, consequences and controls for overspeed events. Although the process
of developing the analysis presented some challenges, the clear guidance within the CIEHF white
paper, and the detailed knowledge of the facilitator, helped the working group engage with the
bowtie concept and populate the overspeed bowtie. The comprehensive risk picture will facilitate
future work to create a barrier management plan, including an action plan to improve individual
controls and implement new controls where gaps were identified.
Ergonomics & Human Factors 2021, Eds R Charles & D Golightly, CIEHF

References
CIEHF (2016). Human Factors in Barrier Management. Birmingham: Chartered Institute of
    Ergonomics and Human Factors.
McLeod, R.W., Bowie, P. (2020). Guidance on customising Bowtie Analysis for use in healthcare.
    CIEHF Annual Conference.
McLeod, R. W., Russell, W., Stewart, M., Prentice, M., Bowie, P. (In Press). A preliminary case
    report study of training and support needed to conduct Bowtie Analysis in healthcare.
    Submitted to British Medical Journal: Open Quality.
NES (2020). Conducting Bowtie Analysis in healthcare: A guide for practitioners. NHS
     Education for Scotland.
ORR (2020). Guidance on health risk management assurance. https://www.orr.gov.uk/guidance-
    compliance/rail/health-safety/occupational-health/good-practice/health-risk-management-
    assurance. UK Government Office of Rail and Road.
Turner, C., Hamilton, I., Ramsden, M. (2017). Bowtie diagrams: A user-friendly risk
     communication tool. Proc. Inst. Mech. Eng. F: J. Rail and Rapid Transit. 231(10); 1088-
     1097.
You can also read