Arbeitslosigkeit in Europa. Beschäftigungsordnungen europäischer Länder in der Finanzmarktund Staatsschuldenkrise - Martin Heidenreich, März ...
←
→
Page content transcription
If your browser does not render page correctly, please read the page content below
Arbeitslosigkeit in Europa.
Beschäftigungsordnungen europäischer
   Länder in der Finanzmarkt- und
         Staatsschuldenkrise
         Martin Heidenreich, März 2013

    Die Krise des Euro und die Zukunft Europas
   6. Tag der ökonomischen Bildung, Oldenburg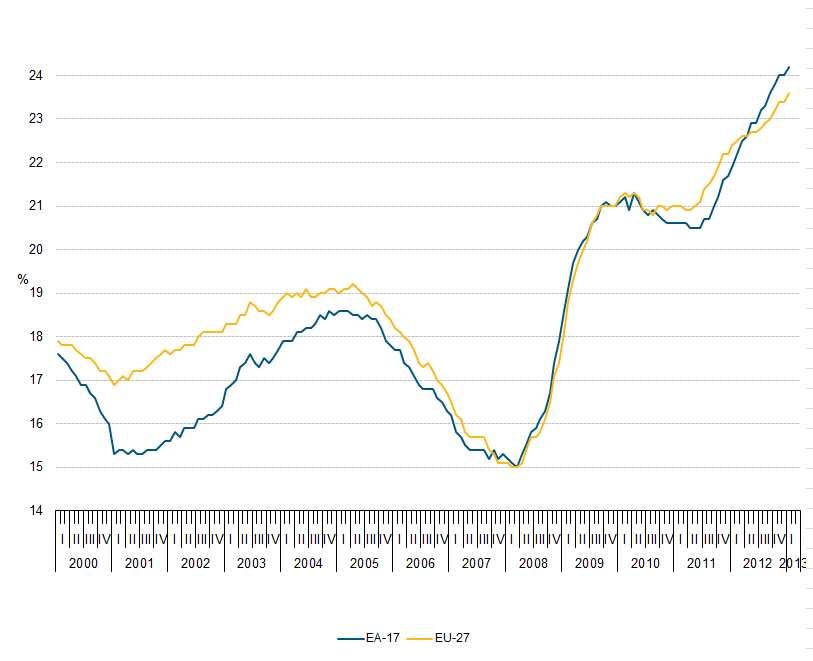
Theses
1. The current employment crisis in Southern and Eastern Europe
   is the result of an inadequate architecture of the EMU
2. Its impact on young and low-skilled employees, migrants and
   unemployed is the result of segmented labour market regimes
   characterised by huge divisions between insiders and outsiders
3. This segmentation could be reduced by active labour market
   policies and social services which however practically do not
   exist in the Southern and Eastern European countries
4. The labour market exclusion of younger, female, unemployed
   and low-skilled Europeans risks to undermine the legitimacy
   of the European integration project
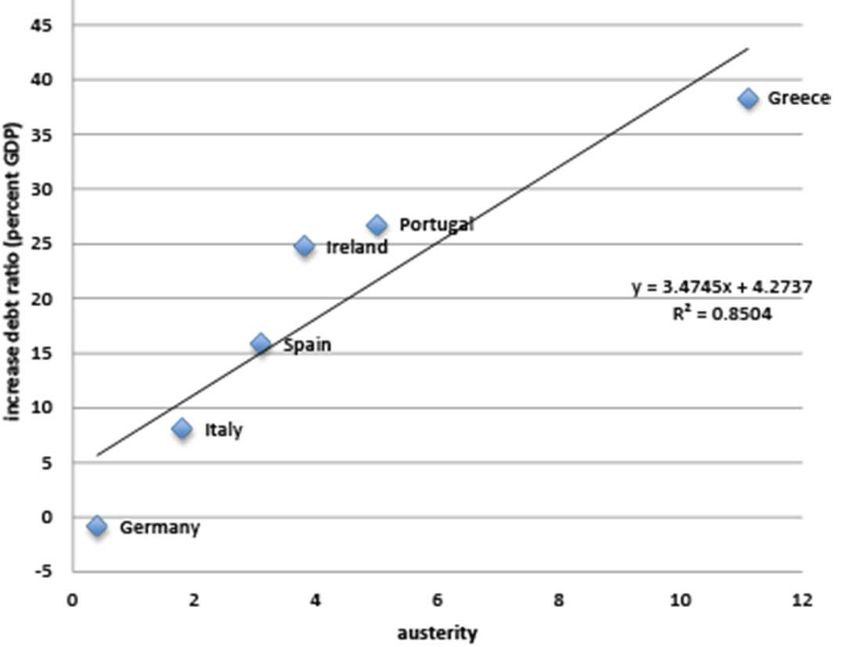
Table of Contents
1. Unemployment and labour market segmentation in the current
   crisis
2. The role of active labour market policies and social services
3. Conclusion

1. Unemployment and labour market segmentation in the
current economic crisis
• Increasing unemployment rates (2013/3: 11.9 %).
• Decreasing employment rates (70.3 % in 2008 to 68.6% in 2011)
• Significant and increasing national and regional disparities (Austria: 4.9 %,
  Germany 5.3 % vs. Spain: 26.2 %, Greece: 27 %) and Portugal (17.6 %);
  January 2013.
• High unemployment of young people, migrants and low-skilled =>
  Segmented labour markets
• High and increasing share of long-term unemployed (2009Q1: 31 %;
  2012Q3: 45 %) => Social exclusion

• 26, 2 Millionen Arbeitslose (11,9 %) in EU
                      27 (1/2013).
                    • Kontinuierlicher Anstieg seit Ende 2007 (7
Arbeitslosigkeit in   %), während die Alo in den USA seit 2009
Europa                wieder sinkt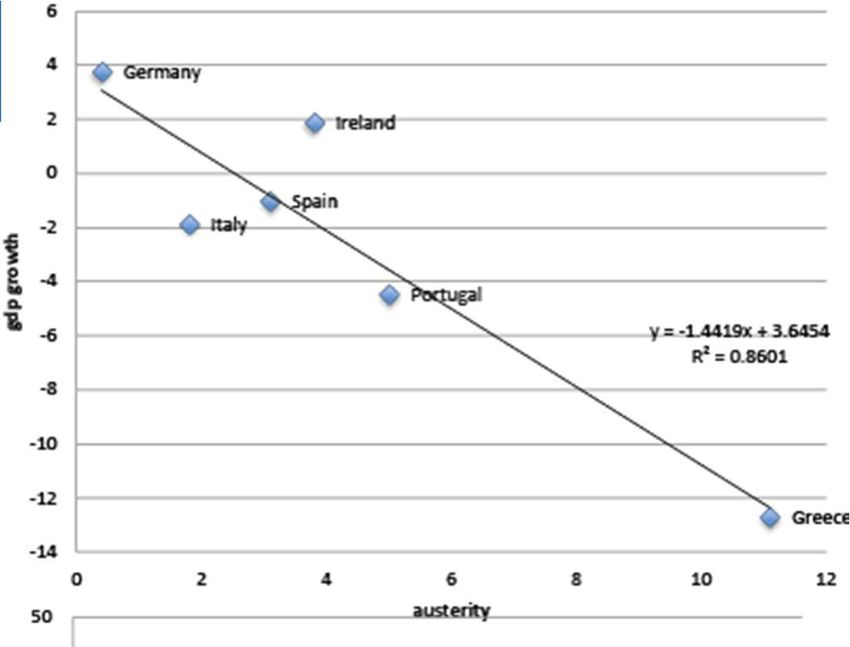
Arbeitslosigkeit in der EU
Erhebliche Unterschiede zwischen Nord- und Südeuropa:
Österreich (4,9 %) und Deutschland (5,3 %) einerseits und
Griechenland (27 %), Spanien (26,2 %) und Portugal (17,6 %)
andererseits.
Unemployment rates of nationals and foreigners
 25 %
        Extra EU-27

        Other EU27-countries
 20 %
        Home country national

 15 %

 10 %

 5%

 0%
Unemployment rates in the EU-27 by education
18 %
Low education
16 %
Medium education
14 % High education
12 %
10 %
8%
6%
4%
2%
0%
2008Q2 2008Q3 2008Q4 2009Q1 2009Q2 2009Q3 2009Q4 2010Q1 2010Q2 2010Q3 2010Q4 2011Q1Youth unemployment rates in the EU-27: Twice as high as the rate for the total population At 22.1 %, more than one out of every five young persons in the labour force was not employed. In Spain, Greece, Italy, Lithuania, Slovakia, Ireland, and Portugal youth unemployment rates were higher than 30 % (2011)
Long-term unemployment (LTU) in selected EU-
countries (in % of total unemployment; 2008-2012)
The incidence of LTU varies from 20 % (Sweden) to 70 % (Slovakia)
Strong increase of LTU from 1/2009 (31.3 %) to 3/2012 (44.7 %) – especially in Greece,
Spain, Ireland and the Baltic countries
60 %

50 %
                                                                Italy
40 %
                                                                Germany
                                                                EU27
30 %
                                                                Spain
20 %                                                            France
                                                                Poland
10 %                                                            UK
                                                                Sweden
 0%
Different patterns of long-term unemployment rates in the EU (2011) Huge differences between universalist (UK, Sw, FI, DK …) and Bismarckian countries (BE, DE, FR, IT …)
Increasing matching problems on the labour market
since 2010 – the EU Beveridge Curve (2008-2012)
       Labour shortage indicator
 10
             08q2
  9                                  EU-27
  8
  7
                                                                 12q2
  6                                              11q2
  5
  4
  3
                                                          10q2
  2
                                         09q2           Unemployment rate
  1
  0
      6,5           7,5        8,5              9,5          10,5           11,5

The long-term component of unemployment is raising in almost all Member States.
This may be due to a skills’ mismatch provoked by the crisis since sectors recovering
quicker are not the ones that shed most jobs at the onset of the crisis, probably
reflecting a shift in skills and sectoral needs in the last three years.
Source: EMCO/28/130911/EN- rev3. Reaching the Employment Target: Progress and
Thematic Surveillance
High persistence in unemployment
in Southern and Eastern Europe
“the share of the short-term unemployed remaining in unemployment has been the lowest in the
Nordic countries (Sweden, Finland, Denmark), Austria, Cyprus, Germany, the Netherlands and the
UK. A high persistence ratio is found in Greece, Slovakia, Ireland, Portugal, Bulgaria and Hungary”
(EU 2012: Employment and social developments)Risks of long-term exclusion in Bulgaria, Romania, Estonia, Greece, Malta, Portugal and Italy
2. Spending and participation in ALMP decrease long-
term unemployment
Social Services. An Essential Dimension of Inclusive
Activation
• Active labour market policies have been criticised as being
  “partially responsible for disappointing poverty trends”
  (Cantillon, 2011: 445)
⇒ Egalitarian and enabling role of social services for the labour
  market integration of groups with complex social problems
  (e.g. low qualifications, indebtedness, health, alcoholism,
  addiction, housing, transport)
Varieties of Inclusive Activation
   What is Activation? “(R)emoval of            Public
                                             education and
   options for labour market exit and         health care

   unconditional benefit receipt”                Social
                                                services
1. Demanding facets:                          (counselling,
                                             care, housing)
       Placement
                                              Job search
       Conditionality                        assistence,
                                              placement,
2. Enabling facets:                             training

       Employment services: Job search,
        placement, training, personalised
        support                              Compensatory
                                                  LMP,
       Social services: Housing,              incentives

        counselling, childcare, disability
       Public education and health care
Services in kind (2009, in % of GDP, without health)
8%
7%
6%
5%
Old age and other
4% Housing
Disability
Family, children
3%
Unemployment
2%
1%
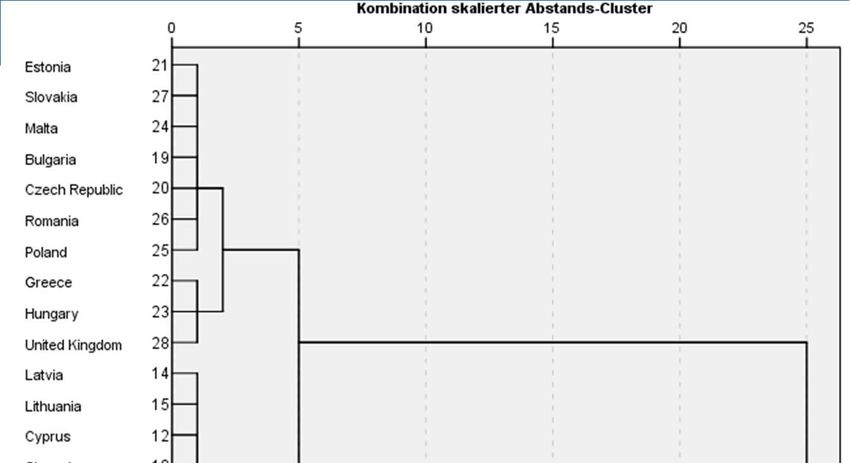
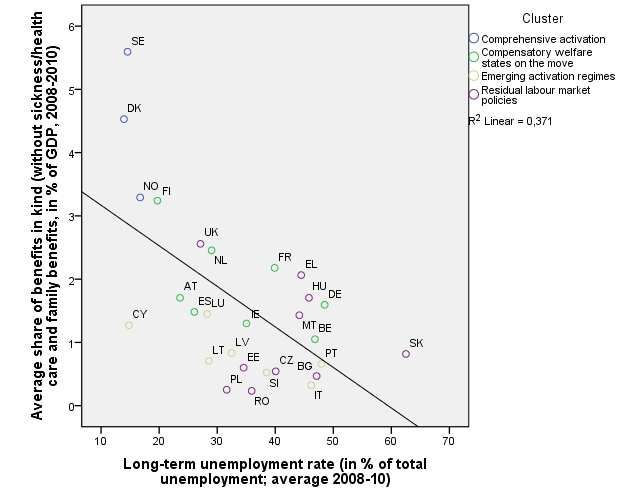
0%The results of a
Residual labour market policies
cluster analysis
with 7 variables in
three dimensions
Emerging activation regimes
1. Intensity of passive Compensatory welfare
labour market policies states on the move to
2. Active labour market more active employment
policies
policies
3. Social and family
services Comprehensive activationFour worlds of inclusive activation
Unweighted Comprehensive Compensatory welfare Emerging activation Residual labour market
means activation states on the move regimes policies
Countries Denmark, Austria, Belgium, France, Cyprus, Italy, Latvia, Bulgaria, Czech Republic,
Sweden Germany, Netherlands, Lithuania, Portugal, Estonia, Greece, Hungary,
Norway Finland, Ireland, Spain Slovenia, Luxembourg Malta, Poland, Romania,
Slovakia, UK
Passive LMP 0.8 1.8 0.8 0.5
Passive 0.17 0.25 0.1 0.05
LMP/unemp
ALMP 0.78 0.74 0.31 0.19
ALMP/unemp 0.16 0.11 0.04 0.02
Replacement 76 74 79 61
Social services 4.5 1.9 0.8 1.1
Family services 1.7 0.7 0.5 0.3
Public education 7.4 5.7 5.3 4.6
Health care 5.9 7.4 5 5
Employment 75.1 67.3 64.3 61.3
∆ men/ women 4.9 10.1 10.6 15
Unemployment 5.4 8.3 8.5 8.6
Youth unempl 14.3 18.1 20 20.6Social services reduce long-term unemployment
3. Fazit
• Hohe Arbeitslosenquoten und geringe und sinkende
  Erwerbstätigenquoten insbesondere in Südeuropa
• Stark segmentierte Arbeitsmärkte: Ausschluss von
  Jugendlichen, Migranten, Geringqualifizierten und
  Arbeitslosen aus dem Erwerbsleben
• Gefahr der dauerhaften Verfestigung von Arbeitslosigkeit und
  Armut in Süd- und Südosteuropa („Hysteresis“)
• The high youth unemployment rates may contribute to a
  downward spiral of demotivation, social exclusion, social
  problems and dequalification which undermine the long-term
  perspectives not only of Southern European societies
Conclusion (2)
• Need for more inclusive activation policies; important role of
  social services for reduction of gender, age, educational and ethnic
  segmentation of the labour market
• Four worlds of activation: Comprehensive activation,
  compensatory welfare states on the move, emerging activation
  regimes, residual labour market policies and their workfare variant
• Success of integrated activation policies is not determined by
  national patterns of activation, but by local organisation of service
  provision
Vielen Dank für Ihre Aufmerksamkeit
1. Reaktion auf asymmetrische Schocks bei flexiblen
und festen Wechselkursen bei hoher Kapitalmobilität

                  Flexible          Feste
                Wechselkurse   Wechselkurse/WWU
Austerity and growth (2011) „Countries that imposed the strongest austerity measures also experienced the strongest declines in their GDP (…) The more intense the austerity, the larger is the subsequent increase in the debt-to-GDP ratios (…) undermined the capacity of these countries to continue to service the debt.” (Paul De Grauwe, Yuemei Ji 2013, Panic-driven austerity)
You can also read