Are Kenya Meteorological Department heavy rainfall advisories useful for forecast-based early action and early preparedness for flooding?
←
→
Page content transcription
If your browser does not render page correctly, please read the page content below
Nat. Hazards Earth Syst. Sci., 21, 261–277, 2021
https://doi.org/10.5194/nhess-21-261-2021
© Author(s) 2021. This work is distributed under
the Creative Commons Attribution 4.0 License.

Are Kenya Meteorological Department heavy
rainfall advisories useful for forecast-based early
action and early preparedness for flooding?
David MacLeod1,2 , Mary Kilavi3 , Emmah Mwangi4 , Maurine Ambani4 , Michael Osunga4 , Joanne Robbins5 ,
Richard Graham5 , Pedram Rowhani6 , and Martin C. Todd6
1 Atmospheric  Oceanic and Planetary Physics, Department of Physics, University of Oxford, Oxford OX1 3PU, UK
2 Schoolof Geographical Sciences, University of Bristol, BS8 1SS, UK
3 Kenya Meteorological Department (KMD), Nairobi 00100 GPO, Kenya
4 Kenya Red Cross Society, Nairobi 00100 GPO, Kenya
5 Met Office, Exeter EX1 3PB, UK
6 Department of Geography, University of Sussex, Brighton BN1 9QJ, UK

Correspondence: David MacLeod (david.macleod@bristol.ac.uk)

Received: 14 April 2020 – Discussion started: 27 April 2020
Revised: 16 October 2020 – Accepted: 26 November 2020 – Published: 25 January 2021

Abstract. Preparedness saves lives. Forecasts can help im-           synoptic patterns associated with extremes as well as access
prove preparedness by triggering early actions as part of pre-       to new dynamical prediction tools that specifically address
defined protocols under the Forecast-based Financing (FbF)           extreme event probability; for example, KMD access to the
approach; however it is essential to understand the skill of a       UK Met Office Global Hazard Map was introduced at the end
forecast before using it as a trigger. In order to support the de-   of 2017.
velopment of early-action protocols over Kenya, we evaluate             Overall we find that KMD HRAs effectively warn of heavy
the 33 heavy rainfall advisories (HRAs) issued by the Kenya          rainfall and flooding and can be a vital source of information
Meteorological Department (KMD) during 2015–2019.                    for early preparedness. However a lack of spatial detail on
   The majority of HRAs warn counties which subsequently             flood impacts and broad probability ranges limit their utility
receive heavy rainfall within the forecast window. We also           for systematic FbF approaches. We conclude with sugges-
find a significant improvement in the advisory ability to an-        tions for making the HRAs more useful for FbF and outline
ticipate flood events over time, with particularly high levels       the developing approach to flood forecasting in Kenya.
of skill in recent years. For instance actions with a 2-week
lifetime based on advisories issued in 2015 and 2016 would
have failed to anticipate nearly all recorded flood events in
that period, whilst actions in 2019 would have anticipated           1   Introduction
over 70 % of the instances of flooding at the county level.
When compared against the most significant flood events              Like many worldwide the Kenyan population is at signifi-
over the period which led to significant loss of life, all three     cant risk from heavy rainfall-induced flooding. In the last
such periods during 2018 and 2019 were preceded by HRAs,             2 years alone flood losses and damages have been exten-
and in these cases the advisories accurately warned the spe-         sive. Recent examples of this include flooding during the
cific counties for which significant impacts were recorded.          “long rains” season of 2018, impacts of which included the
By contrast none of the four significant flooding events in          displacement of 300 000 people (OCHA, 2018). This was
2015–2017 were preceded by advisories. This step change              shortly followed by the “short rains” flooding of 2019, which
in skill may be due to developing forecaster experience with         induced a landslide in West Pokot, killing 72 (reliefweb,
                                                                     2019). In response to this kind of hydro-meteorological risk,

Published by Copernicus Publications on behalf of the European Geosciences Union.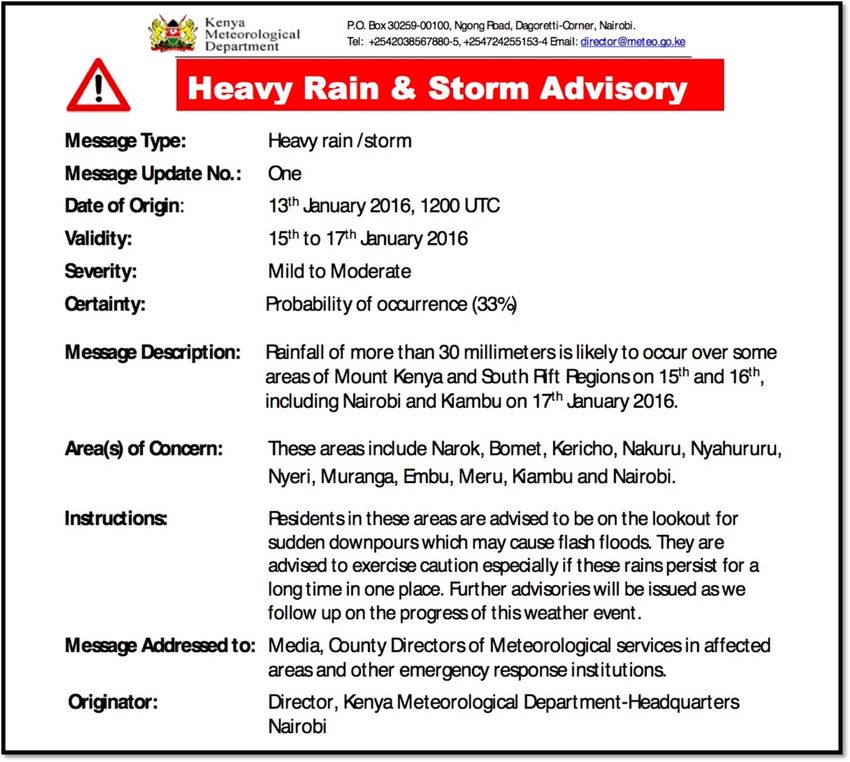
262                        D. MacLeod et al.: Evaluating the Kenya Meteorological Department heavy rainfall advisories

the Red Cross Red Crescent movement has pioneered the              chance of action in vain) could still be linked to a lower-cost
Forecast-based Financing approach (FbF; see https://www.           or “no-regret” action such as repair of river dykes.
forecast-based-financing.org/, last access: 11 January 2021,           Forecast skill assessment is therefore an essential step in
for more details).                                                 designing a system for FbF. In order to be used (in this case
   In the humanitarian action landscape FbF sits within a          by the KRCS and national disaster management agencies),
wider set of approaches to anticipatory risk management,           forecasts must show evidence of skill, which should be quan-
which can broadly be termed early warning–early action, of         tified. In addition the forecast must be readily available to
which there are many examples (see Wilkinson et al., 2018,         the actors from the mandated agency for providing weather
for a review of FbF initiatives). FbF specifically has three       forecasts (in this case the KMD). Finally the forecast must
defining features: a set of objective pre-defined forecast trig-   be provided in such a way to be easily integrated within the
gers, which when met activate a set of pre-defined early ac-       EAP.
tions, themselves funded by a dedicated finance mechanism.             Through the IARP programme a “menu” of potential fore-
Together these constitute the early-action protocols (EAPs)        casts of flood risk has been developed for the Kenya EAPs. In
of an FbF system. The EAPs can facilitate early actions (such      the absence of a Kenya-wide national flood forecast system
as evacuation or cash transfers) or readiness actions (such        (Weingärtner et al., 2018), forecasts of rainfall provide the
as pre-positioning of non-food items) which can be imple-          most appropriate proxy. One key potential forecast for heavy
mented before the hazard event occurs, thus moving from            rainfall events that could result in flooding is the KMD heavy
disaster response to early preparation and reduction in poten-     rainfall advisories (HRAs; described in full in Sect. 2.1).
tial risks posed by the hazard event. Many FbF pilots are ac-      These text-based advisories are issued on an irregular ba-
tive worldwide, and whilst it is not simple to precisely quan-     sis by the KMD when forecasters’ interpretation of current
tify the impact of such programmes, evidence suggests they         conditions and the output of dynamical atmospheric mod-
can significantly reduce individual and community expenses         els point to risk of heavy rainfall. These advisories are made
(Gros et al., 2019) along with bringing unquantifiable bene-       widely available to the public and risk management agencies
fits to lives and livelihoods.                                     in relevant counties.
   Following the establishment of the DREF (Disaster Risk              As these heavy rain advisories are issued from the man-
Emergency Fund) by the International Federation of Red             dated forecasted agency, they have high potential to be used
Cross and Red Crescent Societies in December 2017, na-             in a systematic manner as an FbF trigger in flood EAPs.
tional Red Cross and Red Crescent societies are working            However the skill of these advisories is unknown. In addi-
to define their EAPs for the dominant hazard types. In             tion they are developed explicitly for heavy rainfall warnings
Kenya this work is facilitated through the project “Innova-        and only implicitly warn of flooding. Here then we assess the
tive Approaches in Response Preparedness” (IARP), funded           accuracy of the historically issued KMD HRAs and evaluate
by the IKEA Foundation and implemented by the Kenya                their potential to be used as a trigger in an FbF system for
Red Cross Society (KRCS) with further support from aligned         flooding. Understanding the level of skill of the advisories
projects, notably the UK-funded NERC (Natural Environ-             supports the development of early-action protocols by disas-
ment Research Council) and DFID (Department for Inter-             ter managers.
national Development) project “Toward Forecast-Based Pre-              The verification of the advisories also helps to build con-
paredness Action” (ForPAc3; http://www.forpac.org, last ac-        fidence in early warnings from subjective forecasts. Many
cess: 11 January 2021). ForPAc has been working since              forecasts of natural hazards are produced with some level
2017 with partners including the Kenya Meteorological De-          of expert judgement, but this subjectivity makes verification
partment (KMD) and KRCS to establish the scientific ba-            difficult as a large number of forecasts produced using a con-
sis for FbF and investigate the development of anticipatory        sistent method are rarely available for objective evaluation.
approaches in Kenya for managing flood and drought risk            Without this evaluation, trust in the forecast producer alone
across a range of forecast timescales.                             determines confidence in the forecasts. However when a rea-
   Setting up an FbF EAP for a particular hazard begins by         sonable archive of forecasts is available, forecast verification
identifying priority risks or impacts that can be addressed        can help both to build confidence in the use of the forecasts
by anticipatory early action. The next step is to identify the     and to increase trust in the forecast producer.
best forecasts to use to trigger early action. In Kenya under          The forecast and verification data are described in the fol-
the IARP programme, this involved exploring a range of po-         lowing section, along with an outline of the challenges to
tential forecasts that can support anticipation of the priority    verification posed by the format of the advisories and the
risks and evaluating the accuracy (or skill) of the forecasts.     approach taken to meet this challenge. Results follow, and
Anticipatory actions are then selected which are consistent        the paper concludes with a discussion of the main findings
with the skill of the forecast. For instance a reliable forecast   and limitations to the analysis along with recommendations
of extremely high probability of imminent flooding might be        for design and operation of the Kenya EAPs and further re-
an appropriate trigger for a higher-cost intervention such as      search.
evacuation, whilst a lower probability level (with a higher

Nat. Hazards Earth Syst. Sci., 21, 261–277, 2021                                    https://doi.org/10.5194/nhess-21-261-2021
D. MacLeod et al.: Evaluating the Kenya Meteorological Department heavy rainfall advisories                                   263

2     Data and verification approach                              (e.g. 30 mm in 24 h), otherwise an accumulation total with-
                                                                  out a rate is mentioned. Finer-scale details are often included
2.1    Production of the KMD heavy rainfall advisories            in this description, such as when within the valid period the
                                                                  rainfall can be expected to start for different regions. Fol-
The first HRA was issued at the KMD on 2 June 2015 after          lowing the forecast description, the full list of potentially
being introduced as a forecast product as part of the Severe      affected counties is listed, along with general instructions
Weather Forecasting Demonstration Project (SWFDP) for             for flood preparedness (e.g. “be on the lookout for potential
East Africa (https://www.wmo.int/pages/prog/www/swfdp/            floods”, “avoid driving through or walking in moving water”,
SWFDP-EA.html, last access: 11 January 2021). This project        “people in landslide prone areas . . . should be on high alert”).
was implemented with support from the World Meteorologi-             There are no clear objective criteria triggering issuance
cal Organization (WMO) with the aim of improving the abil-        of HRAs, which is a subjective process depending on fore-
ity of National Meteorological and Hydrological Services          casters’ experience and perception of model skill, consen-
(NMHSs) to forecast severe-weather events and improve the         sus within the forecasting section, and forecast data avail-
lead time of early warnings as well as the interaction of         able. The forecast information used at the KMD to pro-
NMHSs with disaster managers before and during the event.         duce the HRAs has changed over the advisory period under
The intended audiences for these advisories are national and      study: in mid-2016, the KMD was granted a 2-year trial li-
county risk management agencies, humanitarian organiza-           cense to ECMWF “eccharts” through the SWFDP, and in Au-
tions, relevant ministries, and the media for dissemination to    gust 2017 the KMD began using the UK Met Office Global
the general public within areas of concern.                       Hazard Map (GHM) as part of the ForPAc project. The GHM
   The decision to issue an advisory is subjective, informed      provides an at-a-glance summary of forecast high-impact
by dynamical model output and forecaster experience. Ev-          weather over the coming week by visualizing forecasts from
ery day forecasters at the KMD’s Severe Weather Fore-             the UK Met Office (MOGREPS-G, which is the Met Of-
casting section review forecast products from Global Pro-         fice Global and Regional Ensemble Prediction System) and
ducing Centres (such as the European Centre for Medium-           ECMWF (ENS), both separately and in a multi-model en-
Range Weather Forecasts, ECMWF; National Centers for              semble forecast. The multi-model informs summary poly-
Environmental Prediction, NCEP; UK Met Office; and Me-            gons which direct forecasters to the potential for high-impact
teo France) using their judgement to produce a 5 d running        weather over the week ahead via an overview map.
severe-weather forecast. This 5 d severe-weather forecast is         By the end of 2019 a total of 33 HRAs had been issued.
based on areas expected to receive any of the following: rain-    These 33 have been digitized here for the purpose of verifi-
fall above 50 mm in 24 h, winds greater than 25 knots, or         cation, with relevant information extracted: the date of issue
waves above 2 m height. These forecasts are presented graph-      and validity, the probability range, and the rainfall thresh-
ically as polygons, along with tables showing the level of risk   old specified along with all counties mentioned. Details are
(low, medium, or high) over specified areas. At 09:00 Z rep-      given in Table 1, and descriptive statistics are shown in Fig. 2.
resentatives from the NMHSs of all the contributing coun-         Several aspects of the KMD advisories demand a careful ap-
tries of the SWFDP participate in a teleconference call to        proach to verification, as detailed in the following section.
discuss the forecast and develop a consensus.
   If any models indicate a raised chance of an extreme           2.2   Verification approach
event occurring over Kenya during the next few days, then
a high-impact weather conference is held at the KMD by            There are three characteristics of the HRAs with implications
experts from the forecasting unit, and a consensus advisory       for verifying them against observed rainfall:
is drafted. A subjective probability of occurrence is esti-
                                                                    1. The small sample size (33) means it is difficult to as-
mated based on the consensus between models, taking into
                                                                       sess specific aspects of the forecast such as reliability
account weighting of the better-performing models (where
                                                                       of probabilities or accuracy of rainfall thresholds. De-
model quality is judged subjectively according to forecast-
                                                                       scriptive statistics for these are provided in Fig. 2, which
ers’ experience). Once the advisory is drafted it is examined
                                                                       shows that the probability range of “33 %–66 %” is in-
and reviewed by the senior management within the forecast-
                                                                       dicated in nearly all advisories (Fig. 2d; used in 26 ad-
ing division and finally sent to the director for approval to
                                                                       visories), and other probability ranges are rarely used.
disseminate it to the public by the public weather service sec-
tion.                                                               2. The forecast window over which advisories are active
   HRAs are the most frequently issued type of advisory by             is variable from 1 to 6 d but most commonly out to 3 d
the KMD (advisories for strong winds, ocean waves, and                 (Fig. 2c; 13 advisories), so the definition of heavy rain-
temperature are also issued but are not considered in this             fall for verification cannot be consistent.
study). The advisories are text-based (an example is shown
in Fig. 1). They generally specify a rainfall threshold which       3. The spatial characteristics of the forecasted heavy rain-
could be reached: sometimes this is included as a rainfall rate        fall are ambiguous. To illustrate: should we deem an

https://doi.org/10.5194/nhess-21-261-2021                                  Nat. Hazards Earth Syst. Sci., 21, 261–277, 2021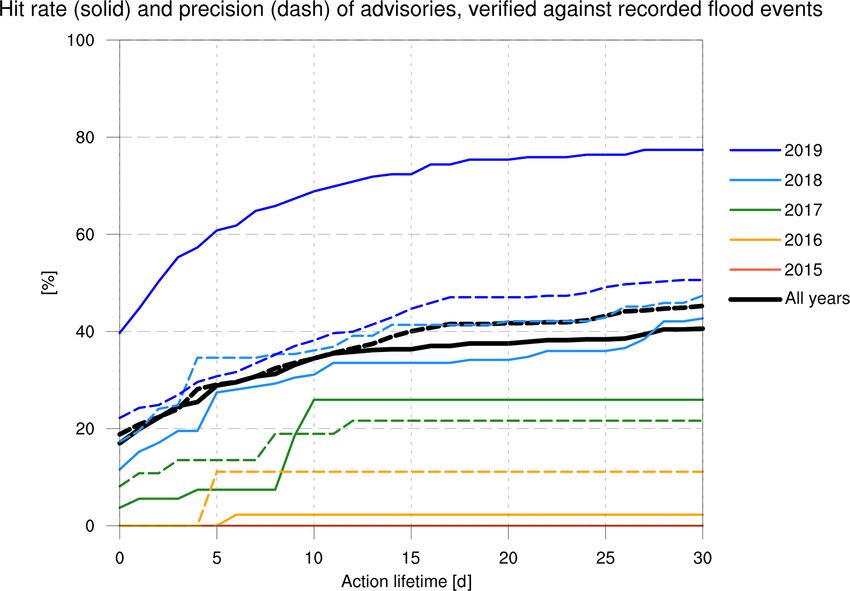
264                         D. MacLeod et al.: Evaluating the Kenya Meteorological Department heavy rainfall advisories

Figure 1. An example of a heavy rainfall advisory issued by the KMD.

Figure 2. Summary statistics of advisories issued over 2015–2019 detailed in Table 1. (a) The number of advisories issued per year, (b) the
rainfall threshold mentioned, (c) the length of the valid period, and (d) the probability mentioned.

Nat. Hazards Earth Syst. Sci., 21, 261–277, 2021                                          https://doi.org/10.5194/nhess-21-261-2021
D. MacLeod et al.: Evaluating the Kenya Meteorological Department heavy rainfall advisories                                        265

Table 1. Summary of all advisories 2015–2019 evaluated in this study.

                      Label    Issue date            Period length         Largest rainfall   Probability indicated
                                                        (days)          threshold mentioned
                      A        2 June 2015                 2                  50 mm                    33 %–66 %
                      B        2 July 2015                 2                  50 mm                     0 %–33 %
                      C        25 April 2016               2                  50 mm                   80 %–100 %
                      D        18 April 2017               2                  50 mm                    33 %–66 %
                      E        28 April 2017               1                  50 mm                    70 %–89 %
                      F        18 September 2017           3                  50 mm                   80 %–100 %
                      G        11 October 2017             3                  50 mm                    33 %–66 %
                      H        30 October 2017             2                  50 mm                    33 %–66 %
                      I        2 November 2017             4                  30 mm                   66 %–100 %
                      J        27 February 2018            3                  50 mm                    33 %–66 %
                      K        9 March 2018                4                  40 mm                     0 %–33 %
                      L        15 March 2018               4                  50 mm                   66 %–100 %
                      M        27 April 2018               5                  40 mm                    33 %–66 %
                      N        2 May 2018                  3                  50 mm                    33 %–66 %
                      O        7 May 2018                  3                  50 mm                    33 %–66 %
                      P        20 May 2018                 1                  50 mm                    33 %–66 %
                      Q        30 May 2018                 1                  30 mm                    33 %–66 %
                      R        4 June 2018                 3                  40 mm                    33 %–66 %
                      S        24 September 2018           3                  50 mm                    33 %–66 %
                      T        23 October 2018             3                  40 mm                    33 %–66 %
                      U        25 March 2019               3                  30 mm                    33 %–66 %
                      V        3 May 2019                  4                  40 mm                    33 %–66 %
                      W        7 May 2019                  5                  30 mm                    33 %–66 %
                      X        22 May 2019                 3                  40 mm                    33 %–66 %
                      Y        31 May 2019                 6                  40 mm                    33 %–66 %
                      Z        10 October 2019             5                  20 mm                    33 %–66 %
                      A0       14 October 2019             5                  40 mm                    33 %–66 %
                      B0       23 October 2019             6                  20 mm                    33 %–66 %
                      C0       18 November 2019            6                  40 mm                    33 %–66 %
                      D0       23 November 2019            3                  30 mm                    33 %–66 %
                      E0       28 November 2019            6                  30 mm                    33 %–66 %
                      F0       3 December 2019             3                   None                    33 %–66 %
                      G0       6 December 2019             3                  20 mm                    33 %–66 %

     advisory warning of 50 mm of rainfall for two named                the KRCS who is interested in the consequences of using the
     counties to be a “hit” if 50 mm accumulated rainfall is            advisories as a trigger for preparedness.
     observed (a) over a single point within at least one of the           We first assume that every advisory triggers preparedness
     counties, (b) over the entirety of either or both counties,        actions independent of the rainfall threshold or probability
     or (c) any areal extent between these extremes? This               specified. We then define the extent of the preparedness ac-
     spatial aspect is further complicated by the wide range            tions according to the counties mentioned in the advisory.
     of size of Kenyan counties: from just over 200 km2                 Such actions are unspecified here and could range from a
     (Mombasa) to over 70 000 km2 (Turkana). The hit rate               low-regret communication to county-level Red Cross volun-
     and false-alarm rate would be highly sensitive to these            teers to a more expensive decision to pre-position supplies.
     verification criteria.                                             This approach is consistent with the FbF approach, though
                                                                        with action triggered on the release of an advisory rather than
   In order to address these issues, we take a step back and re-        being associated with a particular probability level.
focus on the question of whether these advisories would have               After assuming that action was taken within the entire re-
been worthwhile for flood preparedness. Though “heavy                   gion under advisory for each advisory window, we then con-
rainfall” does not necessarily lead to flooding, and flooding           sider the question of whether this action was worthwhile.
does not always require a heavy rainfall event for triggering           There is no single answer to this question as it depends on the
(Berghuijs et al., 2019), we proceed by considering the per-            specific actions along with individual and institutional toler-
spective of a manager responsible for flood preparedness at             ances for false alarms and misses. However following this

https://doi.org/10.5194/nhess-21-261-2021                                         Nat. Hazards Earth Syst. Sci., 21, 261–277, 2021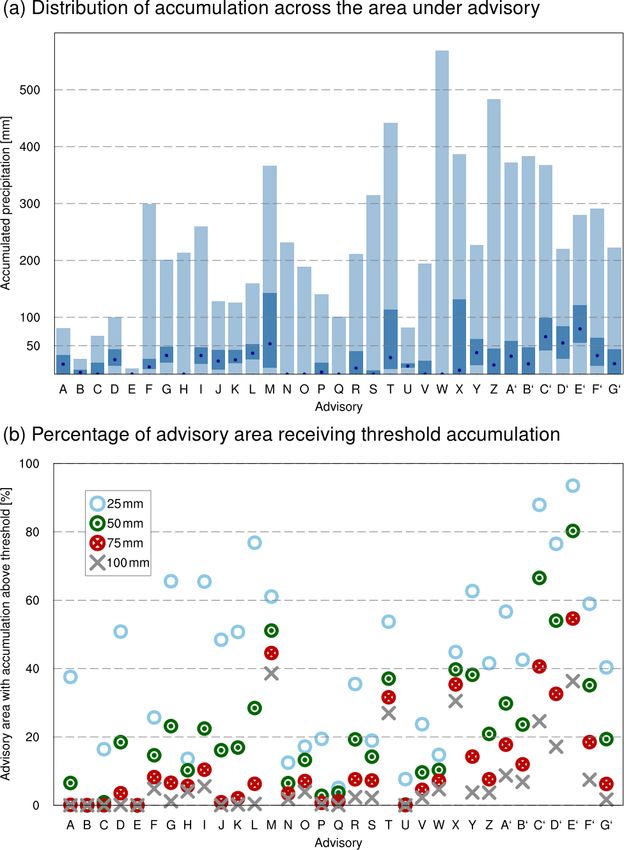
266                       D. MacLeod et al.: Evaluating the Kenya Meteorological Department heavy rainfall advisories

approach we can identify clear hits and false alarms and can      do not suggest that this threshold has primacy over others;
confront the advisories with “what really happened”. As such      an in-depth analysis would be necessary to determine and
our method involves answering the following four questions:       quantify the most relevant thresholds for flood risk in a loca-
                                                                  tion. Instead we take 50 mm as a working definition of heavy
 1. How well does the total area under advisory warn of the       rainfall to keep the discussion concise whilst including other
    extent of heavy rainfall? (Sect. 3.1)                         thresholds in the analysis for reference.
 2. What is the relative spatial extent of preparedness ac-
                                                                  2.2.2   Estimating the relative extent of preparedness
    tions implied by each advisory? (Sect. 3.2)
                                                                          actions implied by advisories
 3. How many flooding events in the period 2015–2019
    would the advisories have anticipated? (Sect. 3.3)            To answer question 2 we estimate the relative scale of pre-
                                                                  paredness implied by each advisory. In practice preparedness
 4. How often would an FbF system based on the advisories         actions would be determined by overlaying the forecast haz-
    be expected to trigger? (Sect. 3.4)                           ard footprint with data on exposure and vulnerability to that
                                                                  hazard. Many different actions are possible which would tar-
  By answering these questions we determine the extent to         get different groups, and we do not attempt to evaluate the
which the KMD HRAs could effectively guide preparedness           cost of specific actions. Instead we aim at a broad indication
activity.                                                         of the magnitude of the general preparedness activities ap-
                                                                  propriate for each advisory by assuming that preparedness is
2.2.1   Comparing advisory areas with subsequent
                                                                  taken based on advisories to target communities exposed to
        rainfall
                                                                  a 1-in-5-year riverine flood event.
We address question 1 with a visual comparison of the total          We use ward-level exposure data provided by the KRCS,
area warned under each advisory with the total rainfall accu-     which have been created by combining population density
mulation in the subsequent advisory window. Rainfall obser-       with an estimate of the areas inundated by a 1-in-5-year
vations are taken from the Climate Hazards and Infra-Red          flood which has been provided to the KRCS by the ECMWF
Precipitation Data with Stations (CHIRPS) dataset (Funk           and calculated using the modelling framework of the Global
et al., 2015). We use CHIRPS as it compares favourably            Flood Awareness System (GloFAS). The exposure estimate
against other rainfall datasets over East Africa and bene-        is not intended to quantify the absolute level of assistance re-
fits from relatively high station density in Kenya (Dinku         quired (not least because the frequency of advisory issuance
et al., 2018). Particular weaknesses of CHIRPS include spu-       means that the vast majority will not be followed by a 1-
rious drizzle and underestimation of peak magnitudes of           in-5-year event by definition). However it does allow a rel-
the most extreme rainfall (specifically the 99.9th percentile;    ative estimate of the extent of preparedness action required
Beck et al., 2017), but our focus on multi-day accumulation       between advisories. For instance an advisory active in loca-
of heavy but not necessarily extreme rainfall should be in-       tions where 2 million people are exposed to flooding is likely
sensitive to these biases.                                        to require more preparedness than an advisory relevant for
   With this visual comparison we begin with a subjective         only 200 000 people. It should also be noted that the number
assessment of the overall performance of advisories. Follow-      exposed to flooding is an upper bound on those actually re-
ing this we calculate the distribution of accumulation totals     quiring assistance as we do not take vulnerability to flooding
across all 5 km CHIRPS grid points inside the polygon asso-       into account.
ciated with the warned counties, quantifying the spatial ex-         We then assess the amount of rainfall falling in the spe-
tent of high rainfall totals for areas under advisory. In addi-   cific areas where people are exposed to flooding and esti-
tion we show the distribution as the percentage of grid points    mate the percentage of the “prepared people” who received
within the warned region receiving more than a specified          above-threshold rainfall. From this we can estimate the rela-
rainfall threshold. Throughout the analysis we evaluate the       tive “worthiness” of each preparedness action: assuming that
total rainfall accumulation across each variable-length advi-     when flood preparedness assistance is given in a location, and
sory window.                                                      significant rainfall follows, the action is considered worthy
   In addition we derive the proportion of the warned             (even if that heavy rainfall does not lead to flooding). We
area that experienced accumulated rainfall above indicative       note the potential mismatch between local rainfall and flood-
thresholds. No single rainfall threshold leads to increased       ing (e.g. when rainfall falls upstream in the catchment and
flood risk, which depends on many factors, both hydrome-          floods the lower reaches of the river), which suggests that our
teorological and social. Even for a single location the same      assumption of worthiness only when heavy rainfall is experi-
amount of rainfall may cause a flood in one year but not the      enced locally should be considered a lower bound; inclusion
next. In the following analysis we show results for 25, 50,       of flooding related to non-local rainfall would only increase
75, and 100 mm accumulation over the advisory window and          the estimate of worthiness.
focus the discussion on results for 50 mm accumulation. We

Nat. Hazards Earth Syst. Sci., 21, 261–277, 2021                                   https://doi.org/10.5194/nhess-21-261-2021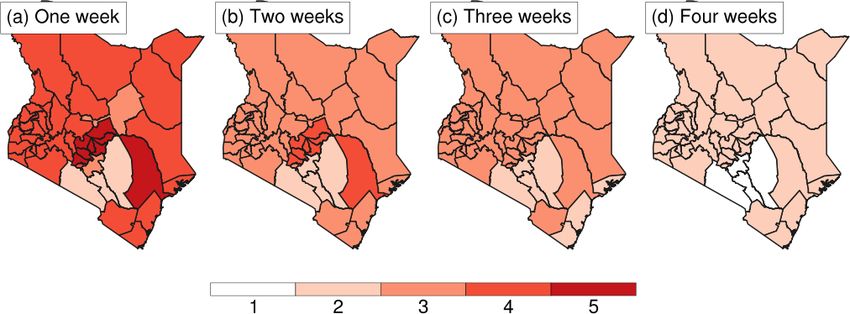
D. MacLeod et al.: Evaluating the Kenya Meteorological Department heavy rainfall advisories 267
2.2.3 Verifying HRAs against flood events and – 10 or more people dead;
evaluating frequency of action triggering
– 100 or more people affected;
The analysis so far quantifies the extent of rainfall accumu-
– the declaration of a state of emergency;
lations and estimates the relative scale of the actions which
each advisory may trigger. Whilst heavy rainfall is not the – a call for international assistance.
only factor in flooding (Amoako and Frimpong Boamah,
2015) and does not always trigger flooding, flood risk and Eight significant flood events in Kenya are recorded in
response managers may be inclined to use the HRAs to trig- EM-DAT for the period June 2015 to December 2019. From
ger readiness activities for flooding. It is therefore instruc- these we remove the Solai earth dam collapse of May 2018
tive to verify the issued HRAs directly against recorded flood as there were major non-meteorological reasons for its col-
events, answering question 3 above. We use two sources of lapse (including lack of maintenance and an outdated de-
flood records, and their use in verifying the advisories is de- sign; NECC, 2018). We merge the two entries beginning
scribed below. 14 March 2018 as they relate to the same period of heavy
The first flood record database has been created by the rainfall. This leaves six flood events, to which we add the
KRCS. This comprises a county-level record of flood events landslide of November 2019 as this was directly triggered by
based on information from the KRCS Emergency Operations a period of heavy rainfall. Compared to the KRCS record,
Center (EOC). The EOC operates 24 h a day at KRCS head- the EM-DAT record is much smaller and so precludes a ro-
quarters and records disaster incidences that are recorded all bust quantitative analysis. Instead we consider each event in
over the country on social and mainstream media and by turn and determine the relevance of the advisories for antici-
KRCS volunteers. The record from the EOC has been sup- pating these most significant flooding events, for which early
plemented with additional events identified post hoc from warning would have been most valuable.
other online sources. In total over the 5 years 2015–2019, Finally we conclude by addressing question 4. Here we de-
the database notes 461 flood events, with 167, 44, 54, 164, termine the number of times an FbF system based on HRAs
and 199 for each year separately (we note that simultaneous might be expected to trigger in each county. We assume here
flooding in two counties is considered in this count as two that actions have a lifetime as described above and that the
events). system will not be triggered again if an action is still active
The KRCS flood record is then used to calculate two key in that county.
skill statistics across the entire sample (over all counties):
firstly the hit rate (HR), calculated here as the percentage of
3 Results
events which were preceded by advisories. Secondly we cal-
culate the precision, which is defined as the percentage of 3.1 How much rain fell in counties under HRAs?
advisories which are followed by a flood event (NB preci-
sion is equal to 100 % minus the false-alarm ratio, another We begin by identifying the total area of all counties named
key metric for FbF, and is a commonly used diagnostic in in each HRA and compare this with the accumulated rainfall
informatics; Powers, 2011). HR and precision are calculated over Kenya during the advisory valid window. For conve-
over the whole sample and for each year separately. Follow- nience, advisories are labelled (A–Z, followed by A0 –G0 ) in
ing Coughlan de Perez et al. (2016) they are also calculated Table 1, and these labels are used from this point.
under the assumption that actions related to flood prepared- Figure 3 shows all the advisories and the resultant accumu-
ness have a lifetime; that is, preparedness carried out today lation. From a visual comparison, we see that 18 advisories
will still avert flood risk even if that flooding does not oc- provide a good forecast of all areas going on to receive at
cur immediately. Actions such as evacuation will only re- least 50 mm rainfall accumulation (A, F, H, J, K, L, P, R, S,
main effective whilst people remain evacuated, whilst low- Y, Z, A0 , B0 , C0 , D0 , E0 , F0 , and G0 ). For these advisories, pre-
regret actions focused on readiness such as pre-positioning paredness is most likely to have been considered worthy, and
of water purification tablets will still be useful if flooding oc- local actions based on these advisories are likely to be hits.
curs months later. Coughlan de Perez et al. (2016) use a 30 d Nine advisories do successfully warn of heavy rainfall in
lifetime in their verification; here we evaluate the advisories some areas whilst failing to warn other counties which re-
across a range of action lifetimes from 0 to 30 d following ceived similar amounts (G, I, M, N, O, T, V, W, and X). In
the end of the advisory window. these cases preparedness may have been considered worthy,
The second source of flood record we use is the EM-DAT although preparedness would not have reached all those po-
database (EM-DAT, 2020). EM-DAT collects data on the oc- tentially affected by flooding, with risk of missed events and
currence and effects of mass disasters globally, requiring at therefore failing to act.
least one of the following four conditions for inclusion in the Five advisories warned the “wrong” counties, where more
database: accumulation was seen in unwarned counties than those re-
ceiving warnings (C, D, E, Q, and U). One advisory (B)
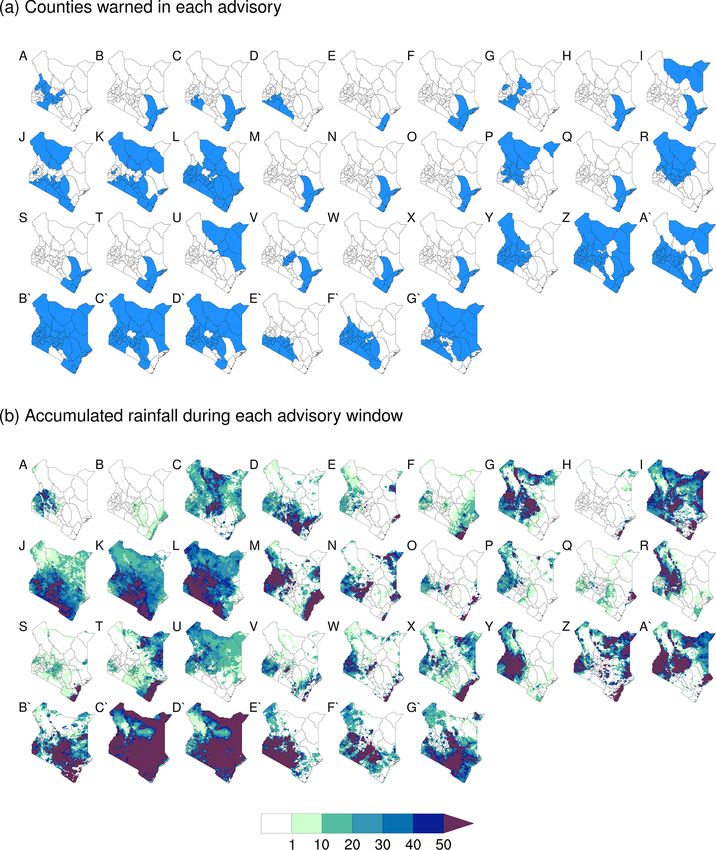
https://doi.org/10.5194/nhess-21-261-2021 Nat. Hazards Earth Syst. Sci., 21, 261–277, 2021268 D. MacLeod et al.: Evaluating the Kenya Meteorological Department heavy rainfall advisories Figure 3. (a) Counties with active warnings for each of the 33 heavy rainfall advisories issued by the KMD during 2015–2019 (advisory details are given in Table 1). (b) Rainfall accumulations (mm) during each advisory window, based on CHIRPS. Nat. Hazards Earth Syst. Sci., 21, 261–277, 2021 https://doi.org/10.5194/nhess-21-261-2021
D. MacLeod et al.: Evaluating the Kenya Meteorological Department heavy rainfall advisories                                       269

                                                                      Figure 5. Ward-level density of the population exposed to 1-in-5-
                                                                      year flooding, produced by KRCS (see Sect. 2.2.2 for details).

                                                                      convective storms, leading to high spatial variability in rain-
                                                                      fall totals.
                                                                         From a meteorological perspective then, we find the ad-
                                                                      visories to be relatively good indications of heavy rainfall.
Figure 4. How much rain fell in counties under advisory? (a) Rain-    Summarizing the above semi-quantitative analysis of Figs. 3
fall accumulation during advisory window, showing distribution        and 4, we conclude that 18 successfully warned those regions
over all 5 km square grid points within counties mentioned in ad-     which did receive heavy rainfall, 9 provide warning for some
visory (light/dark shading shows the range/interquartile range of     regions but miss other regions, and only 6 of 33 are unlikely
the distribution, and the dot indicates the median). (b) Percentage   to be useful for early preparedness actions. However at the
of each advisory region where rainfall accumulation was above 25,     same time, nearly all “good” advisories warn significantly
50, 75, or 100 mm.                                                    larger areas compared to the areas which go on to receive
                                                                      heavy rainfall.
                                                                         We next turn to potential actions triggered by the advi-
warned coastal counties of heavy rain, yet 20 mm fell during          sories, estimating the relative extent of preparedness action
a 2 d window, a relatively normal amount for the region. For          implied by advisories along with the potential public percep-
these six advisories it is unlikely that preparedness triggered       tion of the actions based on locally experienced rainfall.
by the advisories would be considered worthwhile; instead it
                                                                      3.2   What is the extent of preparedness action implied
would possibly be seen as false alarms and misses.
                                                                            by advisories?
   Next, we consider the rainfall distribution across these re-
gions under advisory. Figure 4a shows the rainfall accumu-            Ward-level density of the population exposed to 1-in-5-year
lation across the warned region for each advisory, presented          flooding is shown in Fig. 5. High population density is seen
as the distribution over the sample of 25 km2 CHIRPS grid             around the Lake Victoria basin and elsewhere in the central
points. Figure 4b shows the percentage of the warned area             highlands, although large areas of this highly populated re-
which receives rainfall accumulation above thresholds 25,             gion are not exposed to significant flood risk. This indicates
50, 75, and 100 mm. We see that for the vast majority of ad-          the importance of taking patterns of exposure into account.
visories (29 out of 33), less than 50 % of the warned area            This population density is then integrated across the warned
received over 50 mm. This implies that for any point location         region for each advisory to estimate the total number of ex-
falling in an area under advisory, there is generally over a          posed people warned by the advisory. This is shown as the
50 % chance that no “significant” accumulation will be seen.          black stars in Fig. 6a.
This is inevitable for rainfall early warnings, particularly in
a region with a large contribution from localized but intense

https://doi.org/10.5194/nhess-21-261-2021                                      Nat. Hazards Earth Syst. Sci., 21, 261–277, 2021
270 D. MacLeod et al.: Evaluating the Kenya Meteorological Department heavy rainfall advisories
only be improved if heavy rain falls on an area at risk from
flooding, and this improvement will be higher if the area
is more densely populated. In this way we move beyond
purely meteorological verification and take into account real-
world implications of acting on a forecast. This also consid-
ers the potential response of beneficiaries of flood prepared-
ness: if flood preparedness is carried out in a region that sub-
sequently receives significant rainfall, most people will see
the preparedness as worthwhile. Conversely, people are more
likely to see the action as a false alarm if no significant rain-
fall falls where they live.
Focusing again on 50 mm accumulation as a nominal
threshold for increased flood risk, we see several advisories
for which most people receiving early preparedness would
not have seen significant rainfall. For eight advisories less
than 10 % of those receiving assistance would have seen
more than 50 mm; these are unlikely to be seen by most as
worthy actions (A–E, P, Q, and U). At the other end of the
scale, six advisories see significant accumulation for at least
60 % of those assisted (M, T, X, A0 , C0 , and E0 ). The re-
maining 24 see significant rainfall for between 10 %–40 %
of those affected. Notably, by this metric the first five ad-
visories (covering mid-2015 to mid-2017) are among the
worst-performing, whilst those most likely to have led to
worthy actions were all issued in 2018 and 2019.
3.3 Did advisories warn of flooding?
Figure 6. What is the extent of preparedness action implied by advi- We next turn to the verification of the advisories against
sories? (a) The total population living in the warning region (black recorded flooding in the KRCS flood record. HR and pre-
star) and the number living in that region also receiving at least 25, cision are shown in Fig. 7. This shows a clear improvement
50, 75, or 100 mm rainfall over the advisory window. (b) Percent-
of the advisories over time: for advisories in 2015 and 2016
age of the population living in the advisory region and also receiving
above-threshold rainfall.
less than 5 % of flood events were hit, even with a favourable
assumption of a 30 d lifetime of preparedness actions. Con-
versely action on advisories in 2019 would have seen a 40 %
HR with a 0 d lead time, rising to 60 % or over 70 % if actions
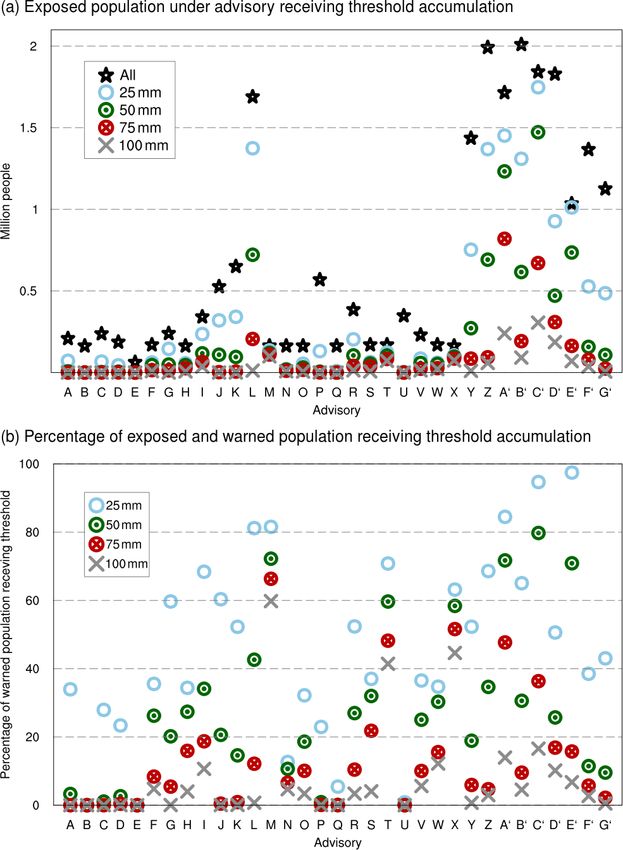
There is significant variability in the extent of the warn- are taken with a 1- or 2-week lifetime. Though 2019 also saw
ings for the population at risk from flooding: eight advi- many more advisories issued compared to earlier years, each
sories warn areas where at least 1 million people are ex- was also more precise, with a 40 % chance of seeing flooding
posed to flooding. The rest warn around 500 000 people and in a county within 2 weeks of taking action during 2018 and
fewer, and of these the warning from 18 advisories is “only” 2019, compared with 20 % in 2017, 10 % in 2016, and 0 % in
targeted at fewer than 200 000 people (these smallest-scale 2015.
warnings are generally when only warnings for coastal coun- Though recent advisories perform well when measured
ties are active). This quantifies the significant variations in against the KRCS record of flooding, it may not be that
the extent and cost of preparedness actions which could be all events in the record would have required significant pre-
linked to the advisories. paredness. We therefore turn now to the seven most signifi-
To evaluate the extent to which this preparedness would cant flooding events in Kenya over the period, recorded in the
have been perceived as worthwhile, we also show the number EM-DAT database. These are compared with relevant advi-
of exposed people living in a warned area which then went on sories; for simplicity we consider an advisory to be relevant
to receive accumulation of 25, 50, 75, or 100 mm. These re- if it was issued in the 7 d preceding the indicated start date
sults are also shown in Fig. 6a, whilst Fig. 6b presents these of the impact as early preparation triggered by that advisory
values as a percentage of the population warned which re- would have been in place for the onset of the event. We do
ceived rainfall above each threshold. Since these scores are not require the heavy rainfall window to explicitly overlap
conditioned on exposed population, they are highly sensi- with the recorded period of impact, allowing for some lag be-
tive to the underlying exposed population density. They will tween heavy rain and flooding. The locations and details of
Nat. Hazards Earth Syst. Sci., 21, 261–277, 2021 https://doi.org/10.5194/nhess-21-261-2021D. MacLeod et al.: Evaluating the Kenya Meteorological Department heavy rainfall advisories 271
response based on this advisory, activating response teams
and sending out warnings via SMS to communities living in
lowland areas. Although no heavy rainfall was directly ex-
perienced in those regions for which the response was trig-
gered, the action was felt to be worthwhile at the KRCS as
some flooding was experienced later due to the Tana River
bursting its banks after heavy rainfall in the central highlands.
The next EM-DAT event occurred in May 2017 (Fig. 8d).
This involved coastal counties along with some in the central
highlands and some in the west. A total of 26 deaths were
recorded, with over 25 000 affected for this event, during
which a reported 235 mm of rain fell on Mombasa in a 24 h
period between 8–9 May. Although an advisory for coastal
counties was issued in late April (advisory E), the valid pe-
riod was a single day which saw little accumulation in the
Figure 7. Skill statistics of the advisories when verified against ob- warned counties.
served flood events at county level. The hit rate shows the percent-
Figure 8e shows the impacts of heavy rainfall during
age of events which were preceded by an advisory in that county
(solid line), whilst the precision shows the percentage of county
the 2018 long rains season, which has been evaluated in
warnings which were followed by an event (dashed line; note that depth elsewhere (Kilavi et al., 2018; Finney et al., 2019).
precision is equivalent to 100 % minus the false-alarm ratio). Statis- Widespread flood impacts were seen across the country be-
tics are calculated for all years (black line) and each year separately ginning on 14 March and extending throughout the month.
(coloured lines) across a range of “action lifetimes”, such that theo- Two advisories were issued during March (advisories K and
retical action based on each advisory is assumed to have a lifetime L). The first was issued on the 9 March and covered the pe-
so is still considered a “hit” as long as the flood event occurs within riod 13–15 March, and a follow-up was issued on 15 March,
the lifetime of the action. covering the period 16–19 March. Both of these periods saw
significant rainfall accumulation (see Fig. 3 and Kilavi et al.,
2018). Every county noted in EM-DAT as experiencing flood
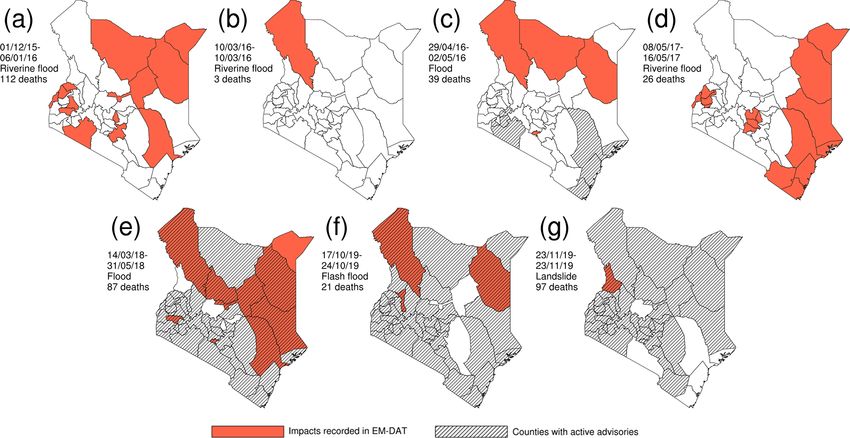
the events are plotted in Fig. 8, which also shows the coun- impacts was mentioned in these advisories except for Man-
ties mentioned in any relevant advisories as defined above (if dera in the extreme north-east of Kenya.
any). These seven events are now discussed in turn. Figure 8f shows impacts that occurred from 17–24 Octo-
Figure 8a shows the significant flooding which occurred ber during the short rains 2019. Flash floods, landslides, and
across Kenya in December 2015 during the large 2015 El riverine floods were reported in Turkana, Wajir, and Elgeyo-
Niño event that peaked in December. This event led to the Marakwet counties. Two advisories were issued preceding
highest number of deaths recorded in the sample (112). No this event (advisories Z and A0 ). The first was issued on 10
HRA was issued at any point before or during this event or October, covering the period 10–14 October, and a second
during the season as a whole. Notably, seasonal forecasts was issued on 14 October, covering the period 16–20 Octo-
did indicate an increased risk of a particularly wet season, ber. Counties with reported flood impacts were all mentioned
although as a whole the seasonal rainfall anomalies were in these HRAs.
smaller than previous comparable El Niño events (Siderius The final event in the sample also occurred during the
et al., 2018; MacLeod and Caminade, 2019). 2019 short rains: a landslide in West Pokot on 23 Novem-
Figure 8b represents a smaller event in Turkana ber (Fig. 8g). This occurred following heavy rainfall across
county caused by intense rainfall on a single afternoon many counties, for which a warning was issued several days
(10 March 2016). This rainfall led to river overflow, three ahead of the event, on 18 November, covering 19–24 Novem-
deaths, displacement of 1000 people, and loss of livestock. ber (advisory C0 ).
No HRA was issued for this event. In summary the first four events in the study period were
The third event (Fig. 8c) occurred at the end of April 2016. not well warned by advisories. The third event in April 2016
This flooding impacted over 10 000 people across semi-arid was preceded by a warning, but it did not target the counties
counties in the north (Turkana, Marsabit, and Wajir) along with significant flood impacts. The final three events in 2018
with Nairobi. In Nairobi the rainfall triggered the collapse and 2019 were all preceded by advisories correctly targeting
of a building in the Huruma estate (a building which was the counties which saw major impacts from heavy rainfall;
not constructed to safe standards), ultimately leading to 52 the lead time between the first advisory and the recorded start
deaths. In advance of this period, an HRA was issued by the of the impacts for these three events was 5, 7, and 5 d, respec-
KMD (advisory C); however warnings were given for coastal tively. Advisories issued in 2018–2019 therefore gave effec-
counties and parts of western Kenya but not for those coun- tive warning to areas experiencing significant flooding im-
ties most seriously impacted. The KRCS did trigger an early pacts, whilst the earlier advisories did not. Along with skill
https://doi.org/10.5194/nhess-21-261-2021 Nat. Hazards Earth Syst. Sci., 21, 261–277, 2021272 D. MacLeod et al.: Evaluating the Kenya Meteorological Department heavy rainfall advisories
Figure 8. Were the most significant impacts of heavy rainfall preceded by advisories? All seven relevant events extracted from EM-DAT
across the advisory period (see Sect. 2.3 for details of event selection). Counties reporting impacts are shown in orange, whilst hatching
indicates counties for which warnings were active when the impact was recorded to have begun.
analysis shown in Fig. 7, this suggests that in recent years and 13 in 2019; Fig. 2a). For low-cost actions such as tar-
advisories have improved and have the potential to act as geted communication of the warning to vulnerable communi-
a trigger for an FbF system. However it should be recalled ties, this may be an acceptable number of triggers, and results
that the warned area is often much larger than the area ex- from Sect. 3.3 suggest that these would successfully warn
periencing heavy rainfall (see Figs. 4, 6, and 8). Even those against all significant flood events. A key requirement of the
advisories where triggering leads to worthy action where im- advisories is to warn the vulnerable public of significant haz-
pacts are felt will also simultaneously trigger action in many ards, and so for this purpose the frequency of issuance is ap-
places which do not require early preparedness, and these propriate to the cost of the warning.
“actions in vain” may be quite expensive in highly populated In the FbF context the advisories could be used to insti-
regions such as western Kenya. In the next and final section, gate actions from response organizations and disaster man-
we turn to a practical consideration of basing such a system agement. Several actions have already been identified as po-
on advisories and estimate how often such a system might be tentially forming part of an EAP (Maurine Ambani, personal
expected to trigger. communication, 2020):
3.4 How often would an FbF system based on – strengthening of barriers designed to prevent people
advisories trigger? from crossing rivers or places where there is usually
fast-flowing water;
An important consideration in setting up an FbF system is
– provision of water containers and water treatment;
how frequently it can be expected to be activated. It is desir-
able to prepare for all significant events; however more fre- – provision of vouchers to affected populations to ac-
quent triggering limits the cost of actions if the system is to cess water treatment tablets, containers, and treated
remain financially sustainable. Here we estimate how often mosquito nets.
such a system might trigger.
Naturally the number of advisories will fluctuate year to These kinds of actions would have significant costs, and so
year depending on climate variability. However 2018 and more than 10 triggers in a year may not be realistic. However
2019 could reasonably indicate the potential number of ac- on the other hand, triggering on every advisory may not be
tivations of an FbF system, given that they both experienced necessary. Frequently an advisory is issued which follows on
significant rainy seasons (with 11 advisories issued in 2018 from another, describing a continuing rainfall event (e.g. J–L,
Nat. Hazards Earth Syst. Sci., 21, 261–277, 2021 https://doi.org/10.5194/nhess-21-261-2021D. MacLeod et al.: Evaluating the Kenya Meteorological Department heavy rainfall advisories 273
Figure 9. How many times per year might an FbF system based on advisories trigger? The number of potential triggers per county during
2019: here we assume that an action is triggered if an advisory is issued as long as no action had already been triggered in the preceding 1,
2, 3, or 4 weeks (a–d).
M–O, C0 –G0 ). Significant flood preparedness may not need are currently being developed. Our assessment of the advi-
to be carried out for each individual one of the advisories sories has considered the following:
in sequence as actions of this nature will have a “lifetime”
that may span the interval between several consecutive issued – the relationship between area warned and the subse-
warnings (Coughlan de Perez et al., 2016). For example river quent rainfall received;
defences will still be effective several weeks after action is
taken to repair or reinforce them. – the scale of preparedness triggered by the advisories and
The impact of action lifetime on trigger frequency is il- the perception of the actions based on locally experi-
lustrated for each county in 2019 in Fig. 9. Here we assume enced rainfall;
that the action will not be repeated if another advisory fol-
– whether the most significant recent flood events fol-
lows closely after the action is triggered. The number of total
lowed HRAs;
actions is shown, assuming an action lifetime of 1, 2, 3, or 4
weeks. We consider multiple chained advisories such as C0 – – how frequently an FbF system could be expected to trig-
G0 as triggering a single preparedness action: after the first ger.
days of heavy rain, activity will have already moved from
preparedness to response mode; additional advisories may We now draw some general conclusions and provide some
trigger scaling-up of existing response operations. recommendations for improvement of the HRAs and outline
With an action lifetime of 1 week most counties would the development of flood risk forecasting in Kenya.
have triggered 4 times in 2019. With a longer lifetime the
system activates less often, and in the longest case of 4 weeks 4.1 Conclusions
no county would have activated in 2019 more than twice (on
average, once for each of the rainy seasons). Advisories issued in the “early period” (from the first in 2015
Typical FbF approaches tend to focus on extreme events up to and including 2017) do not appear to be particularly ef-
rather than floods which occur every year (RCRCCC, 2020), fective for preparedness for flood or heavy rain impacts. For
and so even taking into account long action lifetimes, this each of the nine advisories that were issued in this early pe-
trigger frequency may still be too high for high-cost ac- riod, the counties which were warned did not generally re-
tions. However this frequency may yet be appropriate for FbF ceive significant amounts of rainfall. Furthermore four sig-
linked to low-cost, low-regret actions, such as fast-tracking nificant flood events were reported in this period, and none
drainage clearance which has already been planned and bud- were anticipated by any advisory, whilst 0 %, 5 %, and less
geted for. than 20 % of all recorded flooding of any magnitude was
preceded by advisories in each event of 2015–2017, respec-
tively. We conclude then that it is unlikely that conduct-
4 Discussion and recommendations ing preparedness actions based on advisories between 2015–
2017 would have effectively reduced flood or heavy rain im-
Here we have evaluated the KMD HRAs. This has been done pacts.
from the perspective of a humanitarian agency such as the However we note evidence of an improvement in the
KRCS as if the advisories were used to initiate a prepared- potential utility of advisories in recent years of 2018 and
ness protocol such as FbF in order to reduce risks related to 2019, when they were more frequently issued. Notably, these
heavy rainfall. Such EAPs for a national flood FbF system years had particularly wet seasons: March–May 2018 and
https://doi.org/10.5194/nhess-21-261-2021 Nat. Hazards Earth Syst. Sci., 21, 261–277, 2021274 D. MacLeod et al.: Evaluating the Kenya Meteorological Department heavy rainfall advisories
October–December 2019. For a 2-week action lifetime, pre- 4.2 Recommendations
paredness at county level based on advisories in 2018 and
2019 would have anticipated 40 % and 70 % of all 363 Though the HRAs have skill, their likely utility will clearly
recorded county-level flooding events in these years, whilst depend on the specific context of use. In order to fully as-
the three periods which saw significant mortality were di- certain appropriate actions which could be triggered by the
rectly associated with heavy rainfall which was well warned HRAs, an econometric analysis of the costs and avoided
by advisories. We conclude then that advisories issued across losses of a range of preparedness actions is necessary (and
2018/19 were particularly skilful at anticipating heavy rain- recommended). We note here however that their intended
fall and that preparedness actions based on these could have purpose is to alert county governments, other agencies, and
led to reductions in the impacts of the worst floods in this the general public of the possibility of heavy rainfall. For
period. If the performance of advisories over this period is this purpose they are effective: they are widely disseminated;
indicative of future performance, then they have the poten- the text identification of counties under advisory requires no
tial to effectively anticipate significant flooding impacts in technical knowledge to understand; and most importantly,
Kenya. they have skill. Indeed, Kilavi et al. (2018) note dissemina-
One factor for the improved hit rate in 2018 and 2019 may tion and use of HRAs during the long rains 2018.
be the higher frequency of issuance. However this does not As a source of information for a systematic FbF system
explain the fact that infrequent early advisories were not gen- for flooding, the advisories have several useful characteris-
erally followed by significant rainfall as noted above. This tics for the KRCS: they are produced by the national man-
poor performance in the early period might instead be re- dated agency for weather forecasting; they are readily avail-
lated to the novelty of the system. The first advisories were able at no cost; and being text-based, they require no spe-
issued in 2015, and it may have taken some time to develop cific knowledge for interpretation. However it is likely that
the systems and expertise and gain confidence in issuing ad- they are not suitable for triggering a KRCS EAP for flood-
visories. Another explanation for the change in skill is the ing. The county-scale warning limits the spatial precision of
evolving access to forecast information from global models interventions, and the frequency of the triggering per county
at the KMD. is likely to be too high for FbF, which is intended to tar-
In mid-2016 the KMD was granted a 2-year trial license get extreme events with a return period of 1 in 5 years or
to ECMWF “eccharts” through the SWFDP, which is re- greater. In addition the HRAs only provide a general pic-
ported to have been crucial in informing the advisories re- ture of potential flood impacts without taking into account
leased during that period (Mary Kilavi, personal communi- any local hydrological conditions. However given the clear
cation, 2020) and particularly so during the long rains 2018 skill of HRAs found here, there is clear scope of the KMD
(advisories J–Q). In addition the GHM in use since August to develop these in the context of impact-based forecasting
2017 has provided a multi-model, easy-to-interpret visualiza- (WMO, 2015): here we make some recommendations for im-
tion of potential severe weather. Evaluation has shown that proving the HRAs and the flood forecasting from the per-
multi-model forecasts outperform individual models for ex- spective of stakeholders such as the KRCS.
treme precipitation (Robbins and Titley, 2018). The avail-
ability of a higher-skill, multi-model forecast at the KMD in
an easy-to-interpret format may then be a factor in the sig- 4.2.1 Developing the HRAs
nificant improvement in skill of advisories during 2018 and
2019. Indeed it is reported that the GHM was a key source of Improvement of the probabilistic information in the HRAs
information for the advisories which were issued in advance would make them more fit for the purpose of FbF. A sin-
of all three significant heavy rainfall impacts reported dur- gle category 33 %–66 % is issued in nearly all advisories,
ing 2018 and 2019 (Fig. 8e–g; see also Kilavi et al., 2018, which limits options for preparedness actions. More diverse
for skill analysis of the GHM forecasts used during the 2018 and precise probabilities would allow a range of increasing
“long rains”). levels of preparedness activities, where high-cost actions are
Overall we demonstrate here in the first systematic verifi- only triggered for the highest probabilities. Of course it is
cation conducted of the HRAs that they have skill. We find an essential that these probabilities are reliable, and a relatively
increase in skill over time and that the HRAs anticipated the low frequency of subjectively developed forecasts makes this
most significant flood events during 2018 and 2019. How- aspect of the forecast difficult to evaluate. However the use of
ever we also find they lack spatial precision on the precise historical forecasts and hindcasts from ensemble forecasting
location of heavy rainfall impacts, which may limit their use systems used in the GHM (Robbins and Titley, 2018) cur-
as a trigger in KRCS EAPs. rently in use at the KMD would help to establish the reliabil-
ity of probabilities and provide a scientific basis for issuing
more specific heavy rainfall probability forecasts. Analysis
of these dynamical models should also evaluate their perfor-
mance for the four flooding events in the early period of the
Nat. Hazards Earth Syst. Sci., 21, 261–277, 2021 https://doi.org/10.5194/nhess-21-261-2021You can also read