ARE TOP SCHOOL STUDENTS MORE CRITICAL OF THEIR PROFESSORS? MINING COMMENTS ON RATEMYPROFESSOR.COM
←
→
Page content transcription
If your browser does not render page correctly, please read the page content below
Are Top School Students More Critical of Their Professors?
                                                                  Mining Comments on RateMyProfessor.com
                                                                           Ziqi Tang, Yutong Wang, Jiebo Luo
                                                                                 University of Rochester
                                                       ztang14@ur.rochester.edu, ywang343@ur.rochester.edu, jluo@cs.rochester.edu

                                                                  abstract                                 website claims that users have added more than 19 million
arXiv:2101.12339v1 [cs.IR] 23 Jan 2021

                                         Student reviews and comments on RateMyProfessor.com re-           ratings, 1.7 million professors, and over 7,500 schools to the
                                         flect realistic learning experiences of students. Such infor-     website, and there are more than 4 million college students
                                         mation provides a large-scale data source to examine the          using this website each month (Rat 2020). Such massive text
                                         teaching quality of the lecturers. In this paper, we propose      data is a great resource to study the following topics: features
                                         an in-depth analysis of these comments. First, we partition       of different universities, learning experiences of students,
                                         our data into different comparison groups. Next, we perform       and course and lecture qualities. Past literature has primarily
                                         exploratory data analysis to delve into the data. Furthermore,    examined the usefulness and validity of these ratings (Otto,
                                         we employ Latent Dirichlet Allocation and sentiment analy-        Jr, and Ross 2008), and the correlation levels between easi-
                                         sis to extract topics and understand the sentiments associated    ness, clarity and helpfulness of lecturers (Otto, Sanford, and
                                         with the comments. We uncover interesting insights about          Wagner 2011). Yet the rich data on Rate My Professor con-
                                         the characteristics of both college students and professors.      tain more hidden information to discover. A unique feature
                                         Our study proves that student reviews and comments contain        of Rate My Professor is that it has professor reviews from
                                         crucial information and can serve as essential references for     different tiers of universities, such as Ivy League schools,
                                         enrollment in courses and universities.                           Big Ten schools, and community colleges. These reviews
                                                                                                           discuss the same topic, which is the experiences of taking
                                                               Introduction                                a course from a college professor. This provides an oppor-
                                         Since 1983, the U.S. News & World Report has been pub-            tunity to conduct a plausible control variable experiment to
                                         lishing rankings for the colleges and universities in the         learn about the characteristics of students and professors in
                                         United States each fall. These rankings have remarkable im-       different universities or colleges.
                                         pacts on applications, admissions, enrollment decisions, as          In summary, this study makes several contributions:
                                         well as tuition pricing policies (Monks and Ehrenberg 1999).      1. We conduct a large-scale study of the course learning ex-
                                         It is an important reference for not only students and parents,      periences across the broad spectrum of universities and
                                         but also institutions and professors. The ranking methodol-          colleges in the United States.
                                         ogy measures and calculates a variety of factors, and has
                                         been continuously refined over time based on user feedback,       2. We employ exploratory data analysis, topic modeling, and
                                         discussions with institutions and education experts, litera-         sentiment analysis to mine the behaviors and characteris-
                                         ture reviews and their own data (Morse and Brooks 2020).             tics of different segments of colleges, students and profes-
                                         The current ranking methodology considers the following              sors.
                                         factors, along with indicator weights: Graduation and Reten-      3. we uncover interesting and useful insights that can be
                                         tion Rates (22%), Undergraduate Academic (20%), Faculty              used to understand and improve the learning experience.
                                         resources (20%), Financial Resources (10%), student selec-
                                         tivity for entering class (7%), Graduation Rate performance
                                         (8%), Social Mobility (5%), Graduate Indebtedness (5%),
                                                                                                                   Data Collection and Preprocessing
                                         and Alumni Giving Rate (3%). This measurement takes a             Rate My Professors data was scraped from the website. We
                                         good number of objective factors into consideration. How-         selected about 75 universities based on the U.S. News col-
                                         ever, the learning experiences of students are subjective and     lege rankings of 2020. The rationale of our selection was
                                         personal, which cannot readily be represented by the rank-        the following: The eight Ivy League schools represent the
                                         ing scores. In this regard, a professor rating website such       top ranked private universities, ten Big Ten Academic Al-
                                         as RateMyProfessors.com is a great resource to uncover the        liance Member universities represent the top ranked public
                                         hidden knowledge about the learning experience that the           universities, and the top 15 ranked community colleges in
                                         U.S. News Rankings can not account for.                           the United States represent the community colleges. In ad-
                                             Rate My Professor is a website that allows students to        dition, we selected the top 25 ranked universities and those
                                         anonymously rate their professors and write comments. The         ranked in [100 - 125] in the United States.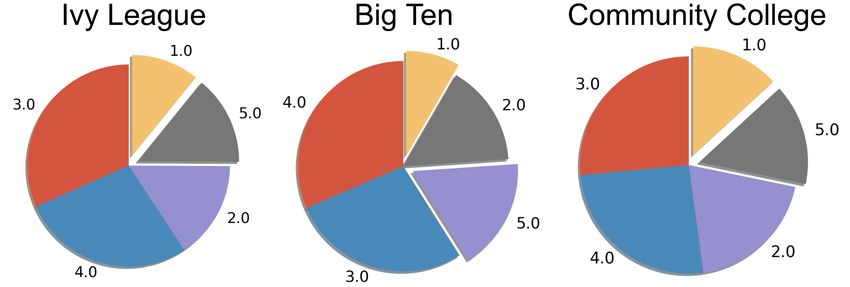
For each university in our selections, we picked the 60
most-rated professors (not highest rated), and for each pro-
fessor page, we scraped the most recent 20 comments. In
total, we collected 87,436 data records, containing the fol-
lowing attributes: “Professor ID”, “Professor Name”, “Uni-
versity”, “Department”, “Course ID”, “Quality score”, “Dif-
ficulty score”, “Comments”. Each data record represents a
review by a student on a course.
We partitioned the collected data into several datasets.
The rationale was the following:
1. Based on the school type, we partition the data into three
categories: private (Ivy League), public (Big Ten), and
community colleges.
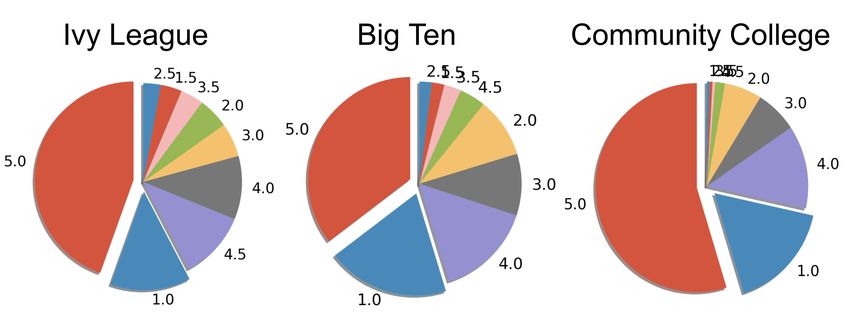
2. Based on the average rating scores of the professors, we Figure 2: Punctuation usage distributions.
calculate the average quality score of each professor, and
selected those professors with an average score above 4.0
and below 2.0 (the full score range is from 1.0 to 5.0), as • Figure 3 is the distribution of average quality ratings of
the high-rating professor and low-rating professor groups, all professors, which has a left skewed distribution.
respectively. • Figure 4 is the distribution of quality ratings from all
3. Based on the quality score of each comment, we also cre- schools (75 schools).
ate datasets for three categories: comments with a score • From Figure 5, the proportions of quality ratings of the
above 4.0, comments with a scores below 2.0, and com- three different groups of schools are different. Commu-
ments with a score in between. nity college students give more high (5/5) ratings, while
In the end, we have 11 datasets for three types of compari- Ivy League students give fewer low (1/5) ratings. This an-
son. Note that these datasets may overlap with each other. swers our initial question in the title – top school students
are not critical when rating their professors and course
Exploratory Data Analysis quality.
We perform exploratory analysis with the following initial • Figure 6 shows the proportions of difficulty ratings of the
findings: three different groups of schools, which are very similar.
• The correlations between quality ratings and difficulty rat-
ings for Ivy League, Big Ten and community colleges
are [-0.178, -0.424, -0.515], respectively. All groups have
negative correlation values that imply the quality rating
decreases when difficulty rating increases, and vice versa.
Ivy League’s correlation is closer to zero which means
there is little relationship between quality ratings and dif-
ficulty ratings. Moreover, students from Big Ten schools
and community colleges are more likely to give a higher
quality rating when the course is easy.
Quality Rating Analysis Using Topic Modeling
In order to find out what factors influence the quality rat-
ings, we perform Latent Dirichlet Allocation (LDA) to ex-
Figure 1: Distributions of Word Counts in different groups. tract topics of the comments. We implement a few types
of topic modeling methods: LDA, BiGram LDA and Tri-
Gram LDA using the Gensim library. Also, we apply tra-
• The word counts shown in Figure 1 indicate that most ditional LDA and Multi-Grain LDA using the Tomotopy li-
of the comments contain around 60 words. All groups brary. Gensim is a well-known python library for topic mod-
have similar distributions. The only difference is that Ivy eling, and Tomotopy is a new library that provides func-
League students use short phrases more often than other tions for topic modeling. The advantages of Tomotopy are
groups. the capability of dealing with large scale datasets, signifi-
• The Punctuation usage shown in Figure 2 demonstrates cantly faster running time than Gensim (5 to 10 times faster
the most commonly used punctuation is period. The dis- than Gensim), and its availability for implementing Multi-
tributions for all groups are similar as well. The only dif- Grain LDA. Multi-Grain LDA takes both local topics and
ference is that community college students use commas, global topics into consideration when performing topic mod-
dashes and exclamation marks more frequently than other eling. Therefore, we decide to examine the Tomotopy Multi-
groups. Grain LDA model for our study. BiGram, TriGram and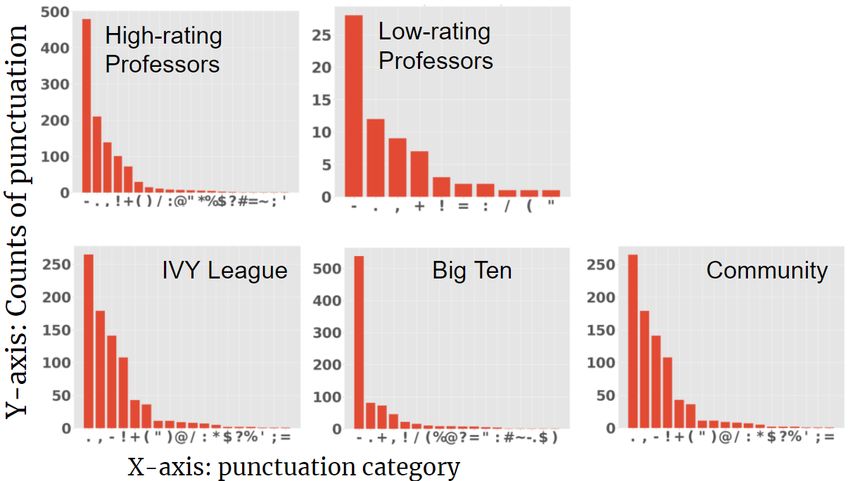
Figure 3: Distribution of average quality ratings of all professors.

                                   Figure 4: Distribution of quality ratings of all schools.

                                                                   Figure 6: Difficulty rating distributions of Ivy League, Big
Figure 5: Quality rating distributions of Ivy League, Big          Ten, and community colleges.
Ten, and community colleges.

                                                                   In our case, the BiGram model has phrases like: “easy-A”,
Multi-Grain LDA models are similar algorithms to the tra-          “office-hour”, “online-course”, etc. For the TriGram model,
ditional LDA. However, they have an additional step that           there are phrases like: “extra-credit-opportunity”, “atten-
adds N-gram phrases to increase the model’s complexity,            dance isn mandatory”, etc.
which could be useful in boosting the model’s performance.            In order to evaluate the performance of all of these mod-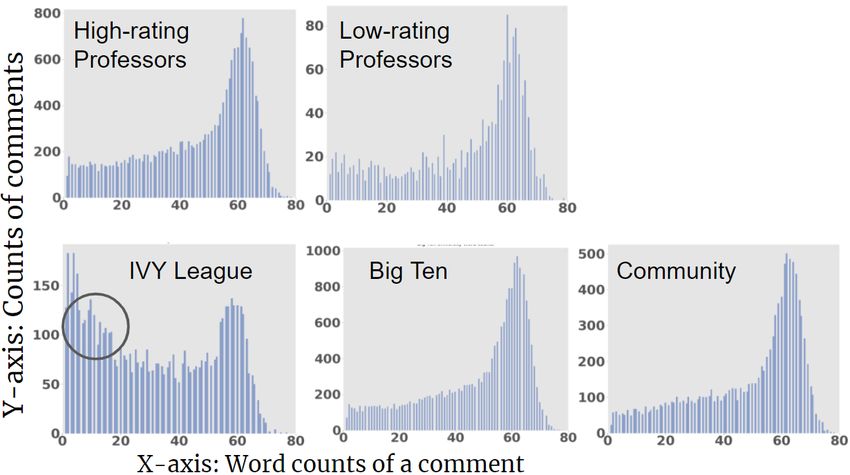
els, we use coherence score, pyLDAvis visualization, log-        The word “friend” appears in Big Ten’s topics, perhaps im-
likelihood, and manual checking as our evaluation metrics.       plying students in Big Ten schools are more likely to get
For LDA, BiGram LDA and TriGram LDA models using                 along with their professors like friends.
Gensim, their coherence score comparison is shown in Fig-
ure 7. Furthermore, we use the pyLDAvis topic modeling           Lower Ratings (1-2) The key words of the topics of lower
visualization tool to analyze the performance of models. For     quality ratings for the three groups are listed in Figure 10.
the Multi-Grain LDA model using Tomotopy, the library            A number of factors are mentioned by students in the com-
does not generate coherence scores, which is a downside          ments with lower ratings. For example, school works (home-
of this library. Therefore, we decide to manually check all      work, test, exam), organization of the content (unclear, dis-
the topics these models generate and choose the one that         organized, useless), professor’s attitude (manner, rude, arro-
makes more sense to us. Figure 8 shows the resulting top-        gant), and so on. One thing to point out is that “cost” is a
ics we create using BiGram LDA, TriGram LDA and Multi-           common factor through all schools as the cost of textbooks,
Grain LDA methods. They are all generated from the same          supplies and software has significantly negative effects on
dataset (community college lower quality rating comments)        quality ratings.
and have the same number of top topics selected (nine top-       Middle Ratings (2-4) The topic key words of middle qual-
ics). A major portion of the topics are similar. However, the    ity ratings for the three groups are listed in Figure 11. The
TriGram LDA model covers the most of the topics. For in-         middle rating comments are usually not too extreme. We
stance, we see key word “online” from the result of TriGram      note that “accent” appears under Big Ten’s topics, and in
LDA. Since this is a community college dataset, we can in-       community college’s topics for lower ratings. This suggests
fer that community colleges tend to offer more online classes    that Big Ten school students may have a higher tolerance for
than other groups, which could be a factor that students con-    professors’ accents than community college students.
sider when they rate the course quality. Moreover, we also
see “accent” for the first time from the result of TriGram       High-Rating Professors vs. Low-Rating Professors
LDA. This is a very interesting factor to include because
                                                                 The key words in the comments for professors with an aver-
many students actually have a different time understanding
                                                                 age quality rating higher than 4 and lower than 2 are listed in
their professors’ accents. The communication experience is
                                                                 Figure 12. One thing to notice is that the coherence score of
an important aspect of course quality rating.
                                                                 higher rating professors is lower, which means the topics of
                                                                 these comments are more dissimilar. Factors that affect the
                                                                 average ratings of professors are: grade, difficulty, organiza-
                                                                 tion of the contents, personality, extra help, passion, knowl-
                                                                 edge, fairness, and so on. In contrast, “voice” and “recita-
                                                                 tion” appear in the lower rating professors category, and this
                                                                 is the only time they appear. This implies communication
                                                                 is critical to students’ experience in classes, and professors
                                                                 teaching science classes (Physics, Chemistry, Biology) that
                                                                 have recitation sections tend to get lower average ratings.

                                                                 Sentiment Analysis Using A Lexical Approach
                                                                 The LIWC2015 toolkit includes the main text analysis mod-
                                                                 ule along with a group of predefined internal lexicons. The
                                                                 text analysis module compares each word in the text against
                                                                 the dictionary and then identifies which words are associ-
Figure 7: Coherence score comparison between BiGram              ated with which psychologically-relevant categories (Pen-
LDA and TriGram LDA models.                                      nebaker et al. 2015). It has been used on previous studies
                                                                 for sentiment analysis on text data from social media (e.g.,
                                                                 (Chen et al. 2020). LIWC2015 provides about a hundred
Ivy League vs. Big Ten vs. Community Colleges                    psychologically-relevant categories, from which we select
Higher Ratings (4-5) The key words of the topics of              around 20 categories for our analysis.
higher quality ratings for the three groups are listed in Fig-
ure 9. There are many factors that students mentioned in the     Ivy League vs. Big Ten vs. Community Colleges
comments when giving higher ratings. For example, school         After we obtain the LIWC scores for each data record, we
works (homework, test, exam), extra help (office hour), pro-     calculate the average scores and standard deviations. Fig-
fessor’s personality (friendly, humor, entertaining), and so     ure 13 shows the LIWC results for our first comparison
on. Meanwhile, some unexpected words stand out in the ta-        group (Group A). Some interesting categories stand out:
ble: “tough”, “boring”, “strict”, implying that these are not    positive emotion, anxiety, achievement, sexual, and gender.
negatively affecting Ivy League and community college’s          We run the t-test on these categories and LIWC grand av-
quality ratings. In addition, both Big Ten and community         erage scores. The two-tailed P values for Positive Emo-
college students mention “extra credit”, “grade” more often.     tion, Achievement and Male Reference were all below 0.001
Figure 8: Comparison of topic results from MultiGrin LDA, BiGram LDA and TriGram LDA models.
(P < 0.001). By conventional criteria, the differences are achievement-related topics more often in their comments.
considered to be statistically significant.
3. The Female Reference score for community colleges and
We make the following observations:
Male Reference score for Ivy League schools stand out.
1. The positive emotion scores for college students are over- The gender reference scores are measured when the stu-
all higher than the average. The Ivy League students score dents mention gender related phrases, such as he or she.
is not only higher than the grand average, but also higher Due to the fact that Rate My Professor website does not
than the other groups. It indicates that students from top record the gender of the professor, we collect a fixed num-
ranked private schools do not tend to criticize professors ber of comments from each professor. The score gener-
more, instead they praise the professors more often than ated from gender reference words is the most reliable way
other groups. to infer male and female professors. Our analysis indi-
2. The Achievement score for community college students cates that there are more male professors in Ivy league
is higher than other groups. Our interpretation is that the schools and more female lecturers in the community col-
community college students may have had jobs previ- leges. Our interpretation is that for research-oriented insti-
ously and they decide to attend community college be- tutions, like Ivy League schools and Big Ten schools, the
cause they want to receive more education and learn professors are required to perform research and teaching
more skills. They possibly have clearer motivation and full-time. Community colleges, on the other hand, have
goals than other groups. Therefore they tend to talk about more part-time lecturer positions. For female professorsFigure 9: Topic key words of higher ratings (4-5) of Ivy League vs. Big Ten vs. community colleges.
Figure 10: Topic key words of lower ratings (1-2) of Ivy League vs. Big Ten vs. community colleges.
who might have to take care of family and children at both less than 0.001 (P < 0.01). By conventional criteria,
the same time, teaching part-time at community college the differences were considered to be statistically significant.
seems to be a good option. The specific findings are:
4. The anxiety scores are considered to be statistically in- 1. The Achievement score for high-rating professors is
significant. Based on the literature, our expectation was higher than the low-rating professors. This may indicate
that students attending top ranked private colleges have a that apart from the general impressions people have for a
higher likelihood to feel depression and pressure (Dere- good professor, students think a good professor also needs
siewicz 2014). However, the LIWC results show that the to know how to motivate the students.
students did not express pressure and anxiety in their re- 2. The Female Reference score for low-rating professors is
views. Our interpretation is that these comments were higher, while the Male Reference score for high-rating
mostly written after the final exams or projects. The stu- professors is higher. This shows that there are more low-
dents no longer feel anxious at the time they post the com- rating female professors and more high-rating male pro-
ments. fessors. It may imply that students are more critical on
5. The sexual scores are considered to be statistically in- female professors than male professors.
significant. The sexual category contains phrases that de-
scribe the appearance of the professors. This could indi- Conclusion and Future Work
cate whether the appearance could affect the student rat- In this paper, we have presented a framework of evaluat-
ings and comments. Our study showed there is no evi- ing the learning experiences of college students from a more
dence to prove the existence of connection between ap- subjective perspective. We first partition the scraped data
pearance and student ratings. from RateMyProfessor.com into different groups and apply
several LDA models to understand the topics of the com-
High-Rating Professors vs. Low-Rating Professors ments. Furthermore, we perform sentiment analysis using
Similarly, after we obtain the LIWC scores for each data LIWC2015. We discover a number of interesting findings
record, we calculated the average scores and standard devia- that may be helpful for improving the college learning expe-
tions. Figure 13 also shows the LIWC results for our second rience for all partied involved, including students, professors
comparison group (Group B). Some interesting categories and administrators.
stand out: Achievement and Gender. We run the t-test on There are three possible directions for future work. First,
these categories and LIWC grand average scores. The two- we can investigate a fine-grained partition strategy to divide
tailed P value for Achievement and Gender Reference were the data by departments, subjects or courses. Second, weFigure 11: Topic key words of middle ratings (2-4) of Ivy League vs. Big Ten vs. community colleges.
Figure 12: Topic key words of professors with high average ratings vs. professors with low average ratings.
can track the comments over time. Our current dataset con- ence on Machine Learning, ICML ’06, 113–120. New York,
tain comments from 2018 to 2020, while most of the com- NY, USA: Association for Computing Machinery. ISBN
ments are posted in May and December, which are the ends 1595933832.
of spring and fall semesters. With more data over time, we Chen, L.; Lyu, H.; Yang, T.; Wang, Y.; and Luo, J. 2020. In
may study individual professor’s teaching style changes and the Eyes of the Beholder: Analyzing Social Media Use of
look at this problem from a brand new point of temporal Neutral and Controversial Terms for COVID-19.
view. Lastly, many in-person lectures are switched to online
lectures due to COVID-19 and quarantine. A valuable study Deresiewicz, W. 2014. Don’t Send Your Kid to
is to first determine the courses that are transformed from in- the Ivy League. URL https://monticellocollege.org/
person to online and then understand the changes from the FileAssets/liberal-arts/ivy league schools are overrated.
student’s experiences. send your kids elsewhere.pdf.
Etzioni, O.; Cafarella, M.; Downey, D.; Popescu, A.-M.;
References Shaked, T.; Soderland, S.; Weld, D. S.; and Yates, A. 2005.
2020. Rate My Professors About Page. URL https://www. Unsupervised Named-Entity Extraction from the Web: An
ratemyprofessors.com/About.jsp. Experimental Study. Artif. Intell. 165(1): 91–134. ISSN
Abulaish, M.; Jahiruddin; Doja, M. N.; and Ahmad, T. 2009. 0004-3702.
Feature and Opinion Mining for Customer Review Summa- Hu, M.; and Liu, B. 2004. Mining and Summarizing Cus-
rization. In Chaudhury, S.; Mitra, S.; Murthy, C. A.; Sastry, tomer Reviews. KDD ’04, 168–177. New York, NY, USA:
P. S.; and Pal, S. K., eds., Pattern Recognition and Machine Association for Computing Machinery. ISBN 1581138881.
Intelligence, 219–224. Berlin, Heidelberg: Springer Berlin
Miller, G. A.; Beckwith, R.; Fellbaum, C.; Gross, D.; and
Heidelberg. ISBN 978-3-642-11164-8.
Miller, K. J. 1990. Introduction to WordNet: An On-line
Arbaugh, J. 2001. How Instructor Immediacy Behaviors Lexical Database*. International Journal of Lexicography
Affect Student Satisfaction and Learning in Web-Based 3(4): 235–244. ISSN 0950-3846.
Courses. Business Communication Quarterly 64(4): 42–54.
Monks, J.; and Ehrenberg, R. G. 1999. The Impact of US
Blei, D.; Ng, A.; and Jordan, M. 2003. Latent Dirichlet Allo- News and World Report College Rankings on Admission
cation. Journal of Machine Learning Research 3: 993–1022. Outcomes and Pricing Decisions at Selective Private Insti-
Blei, D. M.; and Lafferty, J. D. 2006. Dynamic Topic tutions. Working Paper 7227, National Bureau of Economic
Models. In Proceedings of the 23rd International Confer- Research.Figure 13: LIWC results of two comparison groups. Group A: professors with average ratings above 4.0 vs. professors with average ratings below 2.0. Group B: Ivy League vs. Big Ten vs. community colleges. Grand Mean is the unweighted mean of the six genres, and Mean SD refers to the unweighted mean of the standard deviations across the six genre categories. Morse, R.; and Brooks, E. 2020. How U.S. Silva, K. M.; Silva, F. J.; Quinn, M. A.; Draper, J. N.; Cover, News Calculated the 2021 Best Colleges Rank- K. R.; and Munoff, A. A. 2008. Rate My Professor: Online ings. URL https://www.usnews.com/education/best- Evaluations of Psychology Instructors. Teaching of Psychol- colleges/articles/how-us-news-calculated-the-rankings. ogy 35(2): 71–80. Newman, D.; Asuncion, A.; Smyth, P.; and Welling, M. Titov, I.; and McDonald, R. 2008. Modeling Online Reviews 2009. Distributed Algorithms for Topic Models. J. Mach. with Multi-grain Topic Models. Learn. Res. 10: 1801–1828. ISSN 1532-4435. Otto, J.; Jr, D. A. S.; and Ross, D. N. 2008. Does ratemypro- fessor.com really rate my professor? Assessment & Evalua- tion in Higher Education 33(4): 355–368. Otto, J.; Sanford, D.; and Wagner, W. 2011. Analysis Of Online Student Ratings Of University Faculty. Journal of College Teaching & Learning (TLC) 2: 25–30. Pennebaker, J.; Boyd, R.; Jordan, K.; and Blackburn, K. 2015. The Development and Psychometric Properties of LIWC2015. University of Texas Libraries URL http://hdl. handle.net/2152/31333.
You can also read