AS Statistics Bridging Material 2020 - Oldham Sixth Form College - Oldham Sixth Form ...
←
→
Page content transcription
If your browser does not render page correctly, please read the page content below
AS Statistics
Bridging Material 2020
Oldham Sixth Form College
    Name: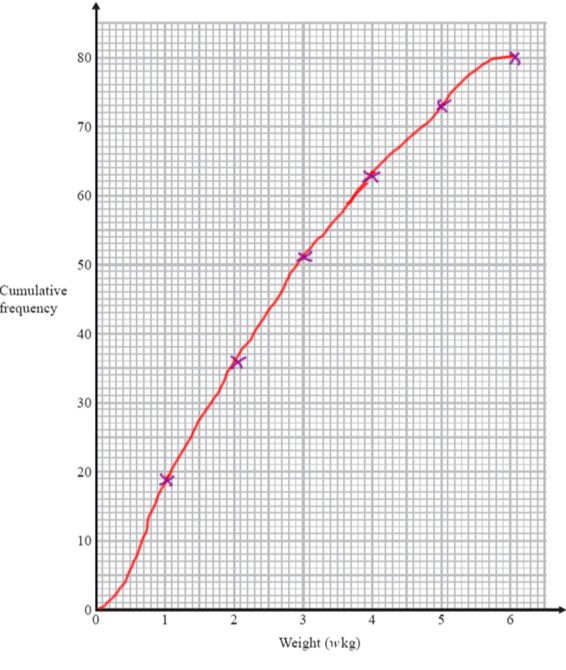
A Level Statistics – Preparation Pack
You should be confident at answering these questions before studying the Statistics A
Level. It is your responsibility to complete this workbook and submit your answers at the
start of the year.

You must show all of your method clearly.
If you type something into a calculator, write it down.
It should take about 1 mark per minute, so spend at least 90 minutes, spread out over the
two weeks before college starts.

Use the solutions at the end of the booklet to mark all your work.

If there are topics that you are not confident with it is your responsibility to revise and
relearn them in preparation. You may find the following website useful in helping you with
the topics you find tricky.

https://www.revisionmaths.com/gcse-maths-revision/statistics-handling-data

Topics

1) Finding the mean, median and mode from a list of discrete data
2) Comparing two groups from averages and range
3) Calculating the mean and median from a frequency table
4) Calculating the mean from a grouped frequency table
5) Drawing a cumulative frequency graph
6) Drawing and reading a cumulative frequency graph
7) Drawing a box plot from a list of data
8) Interpreting a box plot (min, max, median, LQ, UQ) and comparing
9) Drawing a histogram
10) Reading a histogram
11) Drawing a stem and leaf diagram
12) Finding min, max, median, LQ, UQ and IQR from a stem and leaf.
13) Finding probability from a two way table
14) Using a sample space diagram
15) Using set notation
16) Listing permutations
17) Drawing probability trees with independent probability
18) Drawing probability trees with conditional probabilities.
19) Drawing probability trees without replacement.

Questions
Q1.

Here is a list of 12 numbers.
 12       15        18          12   15   12   16   13            17            15             12            17

(a) Write down the mode.

                                                         ...........................................................
                                                                                                               (1)

(b) Work out the range.

                                                         ...........................................................
                                                                                                               (2)

(c) Work out the median.

                                                         ...........................................................
                                                                                                               (2)

(d) Work out the mean.

                                                         ...........................................................
                                                                                                               (2)
(Total for question = 7 marks)

Q2.

Mrs Smith asked each student in her class to record the numbers of times they used their mobile phone last
Saturday.
Here are the results for the boys.
   Boys              8         10         8         9      7        9             8               13               14
(a) Work out the median.

                                                                    ...........................................................
                                                                                                                          (2)

Here are the results for the girls.
   Girls            6          8      9         9        10         14              14
*(b) Compare the numbers of times the boys used their mobile phones with the numbers of times the girls
used their mobile phones.

                                                                                                                          (4)

                                                                            (Total for question = 6 marks)
Q3.

The table gives information about the numbers of badges gained by the younger girls in a Guide group.

(a) Write down the mode.

                                                                   ...........................................................
                                                                                                                         (1)

(b) Work out the mean number of badges gained by these girls.

                                                                   ...........................................................
                                                                                                                         (3)
There are 15 older girls in the Guide group.
The mean number of badges gained by these 15 older girls is 4.4
(c) Work out the mean number of badges gained by all the girls in the Guide group.

                                                                   ...........................................................
                                                                                                                         (3)
(Total for question = 7 marks)

Q4.

The table shows some information about the times, in minutes, 60 people took to get to work.

(a) Calculate an estimate for the mean.

                                                                                ..........................minutes
                                                                                                              (4)
(b) Complete the cumulative frequency table.

                                                                                                             (1)
(c) On the grid draw a cumulative frequency graph for your table.
(2)
(d) Find an estimate for the number of people who took more than 1 hour to travel to work.

                                                                                         ..........................
                                                                                                               (2)

                                                                        (Total for Question is 9 marks)
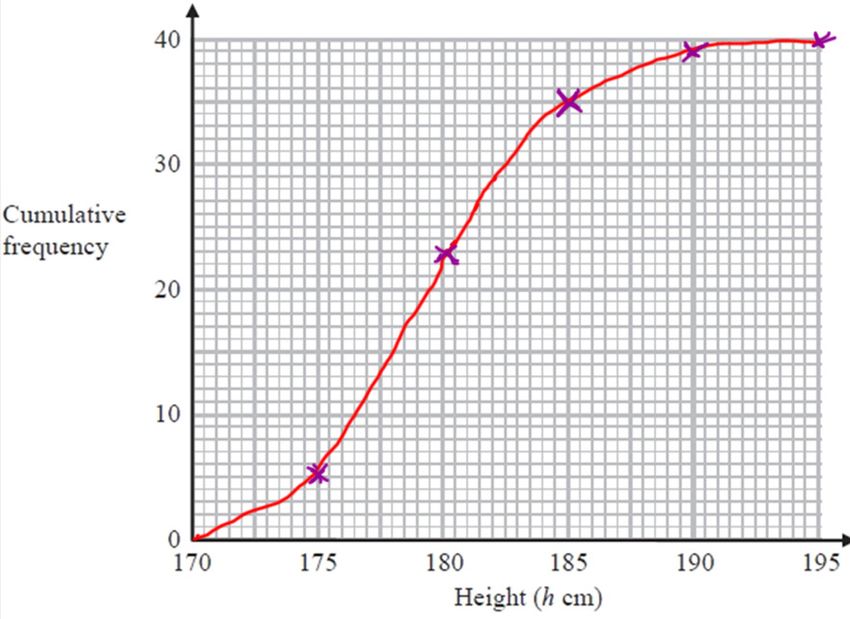
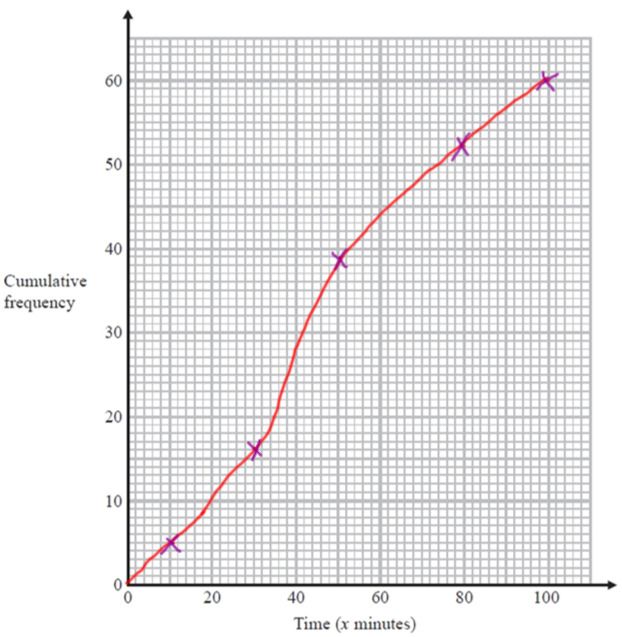
Q5.

The table shows information about the heights of 40 plants.

(a) Complete the cumulative frequency table.

                                                                     (1)

(b) On the grid, draw a cumulative frequency graph for your table.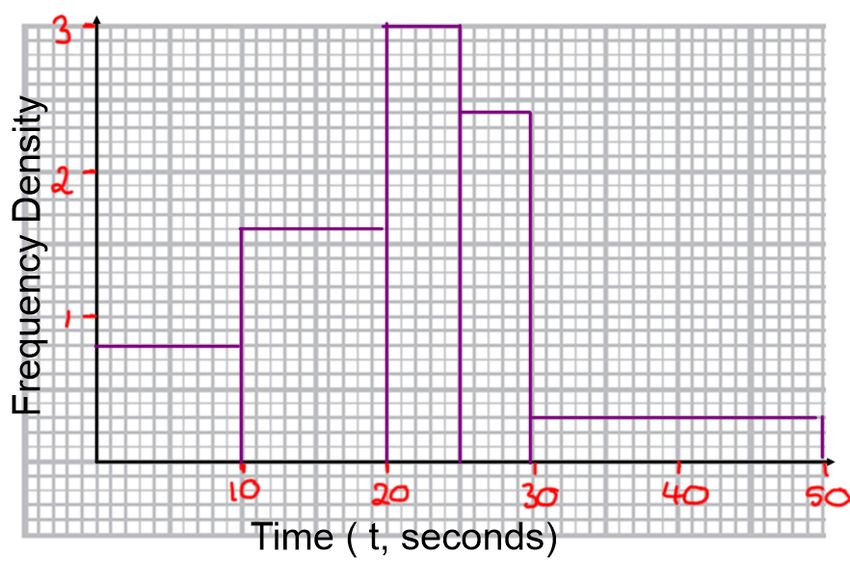
(2)

(c) Find an estimate for the number of plants with a height greater than 187 cm.

                                                                    ...........................................................
                                                                                                                          (2)

                                                                            (Total for question = 5 marks)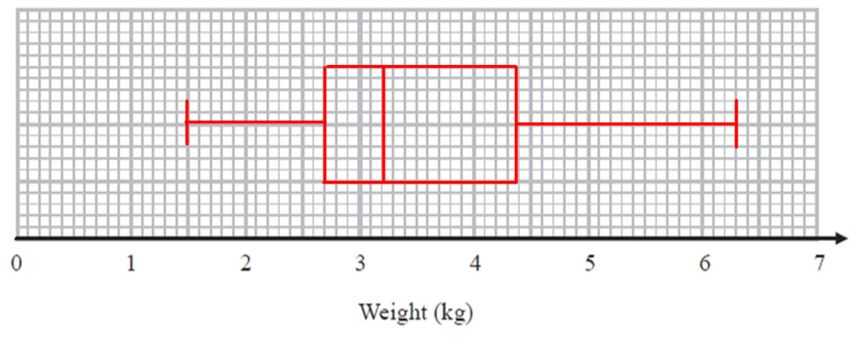
Q6.

Sue works for a company that delivers parcels.
One day the company delivered 80 parcels.
The table shows information about the weights, in kg, of these parcels.

(a) Complete the cumulative frequency table.

                                                                          (1)
(b) On the grid, draw a cumulative frequency graph for your table.
                                                                          (2)
Sue says,
"75 % of the parcels weigh less than 3.4 kg."
*(c) Is Sue correct?
You must show how you get your answer.
(3)
(Total for question = 6 marks)Q7.
The table gives information about the weights of 60 parcels.
Draw a box plot for this information.
(Total for question = 3 marks)
Q8.
The box plot shows information about the number of countries competing in each Winter
Olympic Games since 1948
(a) Write down the median.
...........................................................
(1)(b) Work out the interquartile range.
...........................................................
(2)
The table below shows information about the number of countries competing in each Summer Olympic
Games since 1948
*(c) Compare the two distributions.
.............................................................................................................................................
.............................................................................................................................................
.............................................................................................................................................
.............................................................................................................................................
(2)
(Total for question = 5 marks)
Q9.
The table shows some information about the length of time some birds were on a bird table.
Draw a histogram for the information in the table.(Total for question = 3 marks)
Q10.

The histogram shows information about the areas of some farms.

90 of the farms have an area of 10 hectares or less.
60% of the farms with an area of 100 hectares or less are arable farms.

   of the farms with an area of more than 100 hectares are arable farms.
Work out an estimate for the total number of arable farms.

                                                                    ...........................................................

                                                                            (Total for question = 5 marks)
Q11.
Here are the heights in centimetres of 20 men.
(a) Show this information in an ordered stem and leaf diagram.
(3)
(b) Work out the percentage of these men with a height greater than 184cm.
...........................................................%
(2)
(Total for question = 5 marks)Q12.
The stem and leaf diagram gives information about the speeds of 27 cars.
(a) Find the median speed.
........................................................... miles per hour
(1)
(b) Work out the range.
........................................................... miles per hour
(1)
One of the cars is chosen at random.
Jack says,
"The probability that the speed of this car is more than 60 miles per hour is "
(c) Jack is wrong.
Explain why.
.............................................................................................................................................
.............................................................................................................................................
(2)
(Total for question = 4 marks)Q13.
Some students went on an activity course.
Each student had to choose one activity from art or drama or music.
There were 41 students.
15 of the students chose music.
30 of the students were girls.
8 of the girls chose art.
No boys chose art.
Equal numbers of boys and girls chose drama.
Complete the two-way table.
(Total for question = 3 marks)Q14.
Josh plays a game with two sets of cards.
Josh takes at random one card from each set.
He adds the numbers on the two cards to get the total score.
(a) Complete the table to show all the possible total scores.
(1)
(b) What is the probability that Josh's total score will be greater than 12?
...........................................................
(2)
Josh's year group are raising money for a sponsored skydive.
60 students are each going to play Josh's card game once.
Each student pays 50p to play the game.
Josh pays £1.50 to any player getting a total of 8
(c) Show that Josh can expect to make a profit of £21 from his game.
(4)
(Total for Question is 7 marks)Q15.
Draw a Venn diagram for this information.
(Total for question is 4 marks)
Q16.
Jessica goes to an activity centre.
She can choose to do one of the three morning activities and one of the three afternoon activities.
Morning activities Afternoon activities
Cookery (C) Painting (P) Football (F) Hockey (H) Acting (A) Swimming (S)
List all the possible combinations of activities she can choose to do.
The first combination has been done for you.
..............................................................................................................................................
..............................................................................................................................................
(Total for Question is 2 marks)Q17.
*Shabeen has a biased coin.
The probability that the coin will land on heads is 0.6
Shabeen is going to throw the coin 3 times.
She says the probability that the coin will land on tails 3 times is less than 0.1
Is Shabeen correct?
You must show all your working.
(Total for Question is 3 marks)Q18.
In a supermarket, the probability that John buys fruit is 0.7
In the same supermarket, the probability that John independently buys vegetables is 0.4
Work out the probability that John buys fruit or buys vegetables or buys both.
...........................................................
(Total for Question is 3 marks)Q19.
There are 10 cakes on a plate.
1 fruit slice
6 doughnuts
3 iced buns
Barry takes a cake at random and eats it.
He then takes at random a second cake.
Work out the probability that Barry takes two different types of cake.
...........................................................
(Total for Question is 4 marks)Mark Scheme Q1. a) 12 b) 6 c) 15 d) 14.5 Q2. a) 9 b) Correct comparison of median (9(G),9(B)), Mean(10(G),9.56(B)), Range(8(G),7(B)). Q3. a) 1 b) 2.4 c) 3.15 Q4. a) 45.5 b) 5, 16, 39, 52, 60 c) d) Value between 15-17 Q5. a) 5, 23, 35, 39, 40 b) c) 3
Q6.
a) 19, 36, 51, 63, 73, 80
b)

c) Comparing values (EITHER compare 3.4 with UQ value of between 3.6-3.8 OR compare 60 with value
between 55-57)

Q7.

Q8.
a) 37
b) 36
c) Correct comparison of median (37 and 121) and interquartile range (36 and 116)

Q9.

 Q10.
345
Q11.
a)

b) 15
Q12.
a) 56
b) 32
଼ ଽ
c) Comparison of ଶ
and ଶ
Q13.
Q14.
a)
ଷ
b) ଶ or or 0.3
ଵ
c) £21
Q15.
Q16.
C,H C,A C,S
P,H P,A P,S
F,H F,A F,S
Q17.
Comparison of 0.064 and 0.1
Q18.
0.82
Q19.
ଷ
ହYou can also read