ARDMORE SHIPPING CORPORATION - Investor Presentation December 2018 - Ardmore Shipping ...
←
→
Page content transcription
If your browser does not render page correctly, please read the page content below
ARDMORE SHIPPING CORPORATION
Investor Presentation
December 2018
Disclaimer                                                                                                                        2

This presentation contains certain statements that are deemed to be “forward-looking statements” within the meaning of
applicable U.S. federal securities laws. All statements, other than statements of historical facts, that address activities, events
or developments that Ardmore Shipping Corporation (“Ardmore,” “ASC,” or the “Company”) “expects,” “projects,” “believes,” or
“anticipates” will, or may occur in the future are forward looking statements, including, without limitation, statements about:
future operating or financial results; global and regional economic conditions and trends; tanker market fundamentals,
including the balance of supply and demand in the tanker market, the estimated growth in the world tanker fleet, the amount of
tanker deliveries and scrapping, estimated growth in global oil and refined products demand and supply, tanker demand and
future charter rates; improvements in the tanker market; the effect of the IMO 2020 regulations on tanker demand and rates;
the Company’s business strategy and capital spending or operating expenses; fuel efficiency savings; competition in the tanker
industry; and the Company’s financial condition and liquidity. The following factors are among those that could cause actual
results to differ materially from the forward-looking statements, which involve risks and uncertainties, and that should be
considered in evaluating any such statement: changes in the production of, or demand for, oil or refined products; changes in
trading patterns significantly affecting overall vessel tonnage requirements; greater, or less than anticipated levels of tanker
newbuilding orders and deliveries and greater, or less than anticipated rates of tanker scrapping; changes in global oil prices;
changes in applicable industry laws and regulations and the timing of implementation of new laws and regulations, and the
actual effect of the IMO 2020 regulations; increased costs; increased vessel off-hire; the amount of future cash flows and
earnings of the Company; and other factors discussed in the Company’s filings from time to time with the United States
Securities and Exchange Commission, including its Report on Form 20-F for the fiscal year ended December 31, 2017. The
Company expressly disclaims any obligation or undertaking to release publicly any updates or revisions to any forward-looking
statements contained herein to reflect any change in the Company’s expectations with respect thereto or any change in
events, conditions or circumstances on which any such statement is based.
For more complete information about the Company, the information in this presentation should be read together with the
Company’s filings with the SEC which may be accessed on the SEC website at www.sec.gov .

2
Our Company                                                               3

▪ Ardmore Shipping Corporation (“ASC”) is a leading public tanker
  company focused on medium-size (“MR”) product tankers which
  have an attractive supply/demand outlook

▪ Owns and operates a high-quality fleet of 28 “Eco” MR product and
  chemical tankers. MRs are the workhorses of the global refined
  product trade

     o Modern fuel-efficient fleet with an average age of 6.5 years

     o Built at high-quality yards in Korea and Japan

▪ Strategy focused on achieving superior performance through
  service excellence, operating efficiency and market timing

▪ Low-cost operating platform with strong balance sheet and liquidity
  position

     o Overhead and operating expenses among lowest of peers

     o Balance sheet enables disciplined and opportunistic acquisitions

▪ Top tier corporate governance and business philosophy centered
  on building and capturing value for investors

3
Fleet Profile                                                                                                                                    4

                                                Vessel Name                Type          Dwt Tonnes   IMO     Built    Country   Flag Specification
          High Quality Vessels
                                                Ardmore Seavaliant    Product/Chemical      49,998     2/3   Feb-13     Korea     MI   Eco-design
                                                Ardmore Seaventure    Product/Chemical      49,998     2/3   Jun-13     Korea     MI   Eco-design
                                                Ardmore Seavantage    Product/Chemical      49,997     2/3   Jan-14     Korea     MI   Eco-design
    ✓ Modern, fuel-efficient fleet of
                                                Ardmore Seavanguard   Product/Chemical      49,998     2/3   Feb-14     Korea     MI   Eco-design
      MRs
                                                Ardmore Sealion       Product/Chemical      49,999     2/3   May-15     Korea     MI   Eco-design
                                                Ardmore Seafox        Product/Chemical      49,999     2/3   Jun-15     Korea     MI   Eco-design
    ✓ Average age of 6.5 years(1)               Ardmore Seawolf       Product/Chemical      49,999     2/3   Aug-15     Korea     MI   Eco-design
                                                Ardmore Seahawk       Product/Chemical      49,999     2/3   Nov-15     Korea     MI   Eco-design
                                                Ardmore Endeavour     Product/Chemical      49,997     2/3   Jul-13     Korea     MI   Eco-design
    ✓ Built at high-quality yards in            Ardmore Enterprise    Product/Chemical      49,453     2/3   Sep-13     Korea     MI   Eco-design
      Korea and Japan                           Ardmore Endurance     Product/Chemical      49,466     2/3   Dec-13     Korea     MI   Eco-design
                                                Ardmore Explorer      Product/Chemical      49,494     2/3   Jan-14     Korea     MI   Eco-design
                                                Ardmore Encounter     Product/Chemical      49,478     2/3   Jan-14     Korea     MI   Eco-design
    ✓ Quality fleet = lower                     Ardmore Exporter      Product/Chemical      49,466     2/3   Feb-14     Korea     MI   Eco-design
      operating cost, higher                    Ardmore Engineer      Product/Chemical      49,420     2/3   Mar-14     Korea     MI   Eco-design
      utilization and maximum                   Ardmore Seafarer      Product/Chemical      45,744      3    Aug-04     Japan     MI    Eco-mod
      value appreciation                        Ardmore Seatrader         Product           47,141     —     Dec-02     Japan     MI    Eco-mod
                                                Ardmore Seamaster     Product/Chemical      45,840      3    Sep-04     Japan     MI    Eco-mod
                                                Ardmore Seamariner    Product/Chemical      45,726      3    Oct-06     Japan     MI    Eco-mod
    ✓ Complementary fleet                       Ardmore Sealancer         Product           47,451     —     Jun-08     Japan     MI    Eco-mod
                                                Ardmore Sealeader         Product           47,463     —     Aug-08     Japan     MI    Eco-mod
                                                Ardmore Sealifter         Product           47,472     —     Jul-08     Japan     MI    Eco-mod
    ✓ Increased scale improves                  Ardmore Dauntless     Product/Chemical      37,764      2    Feb-15     Korea     MI   Eco-design
      commercial flexibility                    Ardmore Defender      Product/Chemical      37,791      2    Feb-15     Korea     MI   Eco-design
                                                Ardmore Cherokee      Product/Chemical      25,215      2    Jan-15     Japan     MI   Eco-design
                                                Ardmore Cheyenne      Product/Chemical      25,217      2    Mar-15     Japan     MI   Eco-design
                                                Ardmore Chinook       Product/Chemical      25,217      2    Jul-15     Japan     MI   Eco-design
                                                Ardmore Chippewa      Product/Chemical      25,217      2    Nov-15     Japan     MI   Eco-design
                                                Total                        28           1,250,019           6.5(1)

     1.   Average age as at December 31, 2018

4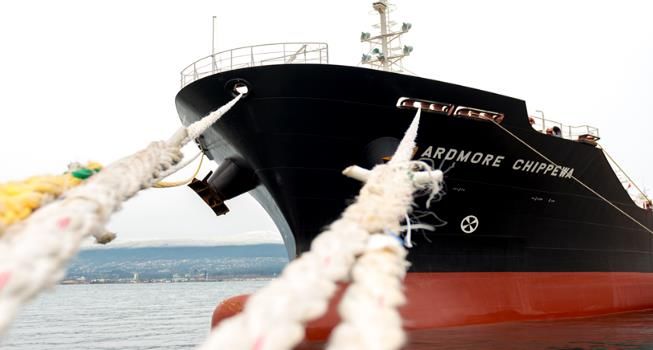
Ardmore Strategy                                                                                                                                                                                       5

                                                      A Disciplined, Value-Oriented Approach to MR Tankers

    Financial Strength and Cost efficiency                                            Improvements to ROIC                                              Disciplined Capital Allocation

    ▪ Maintaining low leverage of 56.6% plus                             ▪ Intensive focus on operating                                          ▪ Most recent acquisitions demonstrate
      strong liquidity position; cash of $66                               performance enhancements from                                           effective market timing:
      million(1)                                                           chartering and commercial operations
                                                                                                                                                   o     June 2016 acquisition of 6 x eco-design
                                                                                                                                                         MRs (avg. per vessel price of $28.75mln
    ▪ Recently completed attractively priced                             ▪ Continued focus on reducing overhead                                          setting market low)
      and flexible lease financings with top                               costs; among lowest in ASC’s peer
      tier Asian and European financiers                                   group                                                                   o     Oct 2017 acquisition of eco-mod MR
                                                                                                                                                         priced at 30% discount to new-build
                                                                                                                                                         equivalent
    ▪ Maintaining low break-even rates and                               ▪ Potential to create significant value and
      cost of capital                                                      cashflow

                                                                          Focused on Maximizing ROIC

     1.   Leverage calculation based on pro forma US GAAP leverage as at Sept 30, 2018 giving account to refinancings completed in October and December 2018. Cash is based on closing balance as at
          Sept 30, 2018 of $33.3mln plus net cash release of $19.7mln from refinancing of four vessels completed in October 2018 and $13mln from refinancing of three vessels in December 2018

5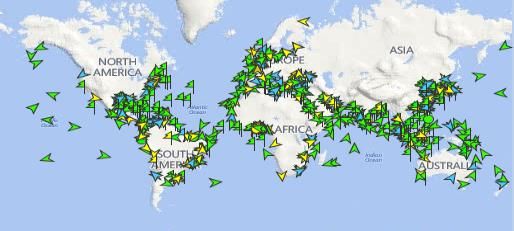
Senior Management Team                                                                                                                  6

                        Experience
     Name                                                                         Past Positions
                          (Years)

     Anthony Gurnee        37        ▪   CEO of Industrial Shipping Enterprises, COO of MTM Group and CFO of Teekay Shipping
     CEO                                 Corporation
                                     ▪   Shipping financier with Citicorp and U.S. Naval Officer
                                     ▪   MBA, CFA, Fellow of the Institute of Chartered Shipbrokers

                                     ▪   VP of Strategy and Planning at Teekay Marine Services
     Mark Cameron          35
                                     ▪   Fleet Manager at AP Møller-Maersk
     COO
                                     ▪   Chief Engineer at Safmarine
                                     ▪   Chairman of International Parcel Tankers Association (IPTA) and Director of West of England P&I

                                     ▪   Formerly at Ernst & Young, Financial Services Advisory
     Paul Tivnan           17        ▪   Fellow of the Institute of Chartered Accountants of Ireland and the Irish Taxation Institute
     CFO                             ▪   Member of the Institute of Chartered Shipbrokers
                                     ▪   Graduate of London Business School and INSEAD; Executive Leadership Programme

                                     ▪   Tanker broker at Poten & Partners
     Gernot Ruppelt        17        ▪   Chartering Manager Maersk Broker / AP Møller-Maersk (Copenhagen, Singapore, Germany)
     CCO                             ▪   Graduate of Hamburg Shipping School and Member of the Institute of Chartered Shipbrokers
                                     ▪   Chairman of INTERTANKO’s Worldscale & Markets Committee

                      Decades of Experience with Industry Leading Companies

6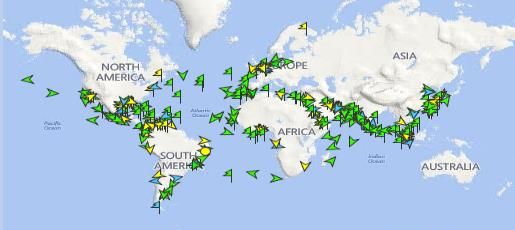
Industry Leading Corporate Governance 7
Commentary Shipping Corporate Governance Ranking (1)
Quartile Company Ticker
Quartile 1 Eagle Bulk Shipping EGLE
▪ Corporate governance and transparency remain key to the International Seaways INSW
Overseas Shipholding Group OSG
company and our investors Triton
Matson
TRTN
MATX
Navigator Gas NVGS
Ardmore Shipping Corporation ASC
Euronav EURN
▪ ASC ranked in the top tier of public shipping companies(1) Gaslog GLOG
Double Hull Tankers DHT
Kirby Corporation KEX
Textainer Group Holdings TGH
▪ Majority independent board of directors; decades of experience in World Fuel Services
Genco Shipping and Trading
INT
GNK
Quartile 2 Avance Gas AVANCE
shipping and finance Star Bulk SBLK
Teekay Tankers TNK
Ship Finance International SFL
Golar GLNG
▪ No related party and affiliated transactions Seacor Holdings
Golden Ocean Group
CKH
GOGL
CAI International CAI
Nordic American Tankers NAT
Gaslog Partners LP GLOP
Teekay Offshore TOO
BW LPG BWLPG
Global Ship Lease GSL
Quartile 3 Frontline FRO
Golar LNG Partners GMLP
Seaspan SSW
Torm TRMD
Hoegh LNG Partners HMLP
Dorian LPG
Teekay LNG Partners TGP
Seadrill Partners SDLP
Navios Maritime Holdings NM
Navios Maritime Midstream Partners NAP
Seanergy Maritime Holdings Ship
Navios Maritime Partners NMM
Nordic American Offshore NAO
Gener8 Maritime GNRT
Quartile 4 Navios Maritime Acquisition Corp. NNA
Scorpio Bulkers SALT
Knot Offshore Partners LP KNOP
Scorpio Tankers STNG
Costamare CMRE
Capital Product Partners CPLP
Aegean Marine Petroleum Network ANW
Dynagas DLNG
Diana Shipping Inc. DSX
Star Bulk Carriers Corp. SBLK
Tsakos Energy Navigation TNP
Danaos Corporation DAC
Stealth Gas Inc. GASS
Dry Ships DRYS
1. Wells Fargo Corporate Governance Scorecard Volume V issued May 23, 2018
7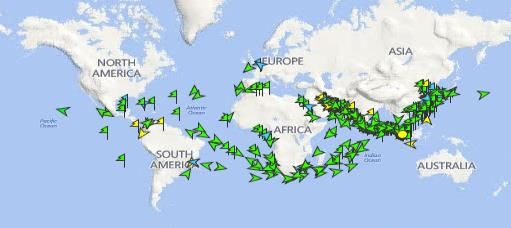
Our Focus: MRs in Perspective                                                                                                                                                                                                         8

                                                                                                                                               World Tanker Fleet(1)
                                                                                                                                                           6,530 Vessels

                                                 Crude Tankers                                                                                  Product / Chemical Tankers
                                                                                                                                                                                                          Short Range / Stainless
                                                        (Uncoated)                                                                            (Coated: 25,000 Dwt to 199,999 Dwt )

                  UL / VLCC                      SUEZ                     AFRA                     PAN                  LR3            LR2                 LR1                   MR                         SR               Stainless

                       736                        549                         653                  81                   18             345                 363                  2,134                      955                  696

                           Product Share of Oil Seaborne Trade Increasing(2)                                                                                                         Growing Share of World Tanker Fleet

                 3,500
                                                         Crude Seaborne Trade                             Product Seaborne Trade                                           ▪   MR tankers comprise ~33% of the world tanker fleet
                 3,000                                                                                                                                                         by number of ships(1)
                                                                                                                                                    35%
                 2,500                                                                                                                                                     ▪   Seaborne oil transport is gradually shifting away from
Million Tonnes

                                                                                                                                                                               crude and toward refined products, driven by long-
                 2,000                   25%
                                                                                                                                                                               term refinery dislocation
                 1,500
                                                                                                                                                    65%                    ▪   This is the main growth driver for MRs
                 1,000
                                     75%
                  500

                       0
                                                                                                                                                           2018E
                                                                                                                                                                   2019E
                                                                                                                        2013
                           2000
                                  2001
                                          2002
                                                 2003
                                                         2004
                                                                2005
                                                                       2006
                                                                              2007
                                                                                     2008
                                                                                            2009
                                                                                                   2010
                                                                                                          2011
                                                                                                                 2012

                                                                                                                               2014
                                                                                                                                      2015
                                                                                                                                             2016
                                                                                                                                                    2017

                  1.       Fleet data as at March 2018 per Drewry as per Ardmore Shipping Corporation Annual Report or Form 20-F for the year ended December, 2017 pg. 35
                  2.       Clarksons Shipping Intelligence Network, November 8, 2018

    8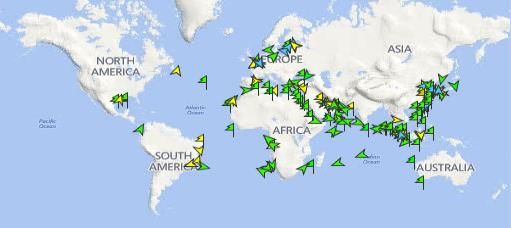
MRs are the “Yellow Cabs” of the World Tanker Fleet(1)                                              9

                                            MR                             VLCC

                                            LR1                             LR2

         MRs Trade Everywhere And Are The Ship Of Choice For Oil Traders Due To Their Versatility

    1.   Vessels Value AIS Data, November 9, 2018

9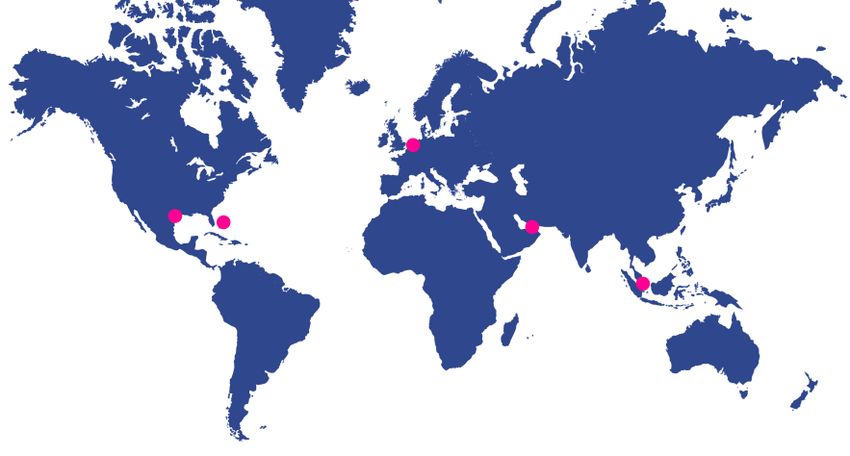
Attractive Market Outlook   10

     .

10
MR Rates Rebounding 11
MR Rates Rebounding(1)(2)
▪ MR rates are increasing:
$25 MR rates on a global MR Rates
MR TCE (Thousand USD / day)
basis hit a low in Sep rebounded in
o Crude tanker rates have rebounded and anticipated to November
$20
lead a general tanker market recovery
$15
o Product tanker rates now also increasing
$10
o Atlantic Basin trading activity has returned to more normal $5
levels and winter market conditions are starting to emerge
$0
Jan-18 Mar-18 May-18 Jul-18 Sep-18 Nov-18
o ASC fleet deployment weighted toward Atlantic Basin for
4Q18; well positioned for winter market rebound TC2/TC14 (Atlantic Basin) MR Global Average
Tanker Rates Starting To Improve(1)
▪ Near-term market outlook is positive: $40 Product Tankers Crude Tankers MR Only
$35 Rebound in crude tanker
TCE (Thousand USD / day)
o Global refinery throughput expected to reach a record rates expected to lead the
high of 84.1 mbd in December 2018(3) $30 recovery for product
tankers
$25
o Impact of IMO 2020 expected to be felt beginning in mid- $20
2019
$15
$10
$5
Jan-18 Mar-18 May-18 Jul-18 Sep-18 Nov-18
1. Data provided by Howe Robinson, as at November 30, 2018
2. Clarksons Shipping Intelligence Network, as at November 30, 2018
3. IEA Oil Market Report, November 14, 2018
11Demand: Oil Consumption and Refinery Capacity Growing 12
Expected Global Oil Demand Growth(1) Expected Global Refinery Capacity Additions(2)(3)
110 Avg. +1.2 million bpd annually (2017 – 2022) 110 Avg. +1.3 million bpd annually (2017 – 2022)
Oil demand >100 million bpd in 2019
105.5
105 103.7 105 104.4
102.6 102.6
102.0
Million Barrels / Day
101.5
Million Barrels / Day
+27% 100.5
99.2 100.0
100 YoY 100
97.9 98.7
95 95
90 90
85 85
2017 2018E 2019E 2020E 2021E 2022E 2017 2018E 2019E 2020E 2021E 2022E
▪ Oil consumption forecast to continue to grow at an average of 1.2 million bpd (1.3 million bpd in 2018, 1.4 million bpd in
2019(3)) for next five years
o Matched by forecasted refinery capacity additions in trading-oriented locations
1. IEA, “Market Series Report: Oil 2018” p123. Summary of Global Oil Demand
2. IEA, “Market Series Report: Oil 2018” p130. Gross capacity additions, excludes impact of closures
3. IEA, Oil Market Report, October 12, 2018
12Demand: Tonne-Mile Demand CAGR of 4% 13
Seaborne Product Trade Balances 2017(1) Seaborne Volume of Oil Products Traded(2)
Import Export Net 30
CAGR +4%(3)
Middle East 1.4 3.2 1.8
25
North America 1.8 3.4 1.6
Million Barrels / Day
China 0.6 0.8 0.2 20
Asia (ex China) 7.8 6.0 -1.8
Europe 7.1 6.1 -1.0 15
Latin America 2.9 0.7 -2.2
10
Africa 1.2 0.5 -0.7
FSU n/a 2.7 n/a 5
Other 0.8 0.3 -0.5
0
2003
2004
2005
2006
2007
2008
2009
2010
2011
2012
2013
2014
2015
2016
2017
2018E
Total Trade mbd 23.6 23.6
▪ Seaborne volume of oil products growing; refinery development away from the points of consumption and growing
regional imbalances resulting in increased voyage distances
▪ Product tanker tonne-mile demand has been growing at approximately 4.3% annually between 2003 and 2017 (3)
1. Clarksons “Oil and Tanker Trades Outlook” June, 2018
2. Clarksons Shipping Intelligence Network, forecast for 2018 according to Clarkson’s data, as at November 8, 2018
3. Clarksons Shipping Intelligence Network, October 2018
13Supply: Orderbook at Historical Lows 14
Global MR Product Tanker Orderbook and Fleet Development(1)
100 Fleet (Million DWT) OB as % of Fleet 50%
90 45%
Orderbook 4.7% of Fleet
80 40%
70 35%
OB as % Fleet
60 30%
Million DWT
50 25%
40 20%
30 15%
20 10%
10 5%
0 0%
1997 1998 1999 2000 2001 2002 2003 2004 2005 2006 2007 2008 2009 2010 2011 2012 2013 2014 2015 2016 2017 2018
▪ Orderbook at historical low of 4.7% of the current MR fleet; very limited new ordering
1. Clarksons Shipping Intelligence Network and Management’s estimates as at October 2018
14Supply: Scrapping Set to Continue 15
MR Tanker Profile(1)
▪ 38 Vessels Scrapped YTD(2)
200
▪ 27 Vessels Scrapped 2017
…increasing regulations could accelerate
180 vessel scrapping
160
+37%
140 +20% YoY
>20 years old: 156 MRs (7.3%
+27% YoY Fleet)
YoY
Number of Vessels
120
100
80
60
40
20
0
1983
1985
2014
2016
1982
1984
1986
1987
1988
1989
1990
1991
1992
1993
1994
1995
1996
1997
1998
1999
2000
2001
2002
2003
2004
2005
2006
2007
2008
2009
2010
2011
2012
2013
2015
2017
2018
1977-1981
* An MR is typically scrapped when it reaches 25 years old. Management estimates 25 - 30 ships will scrap annually based on prior years, future estimates increased in 2018 and 2019
due to high scrapping rate year-to-date and IMO 2020 impact
15 1. Clarksons World Fleet Register (MR Product Tanker Fleet 25,000 – 54,999 DWT), as at November 8, 2018
2. Clarksons Shipping Intelligence Network, October, 2018Supply: MR Fleet Growth Continues to Decelerate 16
MR Product Tanker Fleet Development(1)
Year Deliveries Scrapping(1) Net Growth
140 Supply growth set to be at historical lows 5.00%
2015 121 25 96
2016 105 21 84
2017 63 27 36 4.50%
120 2018E 49 40 9
2019E 54 40 14 4.00%
100 3.50%
Number of Ships
3.00%
80
2.50%
60
2.00%
40 1.50%
1.00%
20
0.50%
0 0.00%
2014 2015 2016 2017 2018E 2019E
Deliveries Net Fleet Growth Net Fleet Growth % Scrap
▪ Net MR fleet growth for 2018 is estimated to be well below 1% (9 net vessels additions) (2)
1. Clarksons World Fleet Register; forecast based on Management’s estimates. Assumes no new orders placed. Scrapping assumption increased in 2018 and 2019 based on YTD scrap rate and
build up to IMO 2020 deadline
2. Estimated net fleet growth of 9 MRs (representing >1% of current MR fleet) includes estimate for vessel delays. Assumes no new orders placed
1617
IMO 2020
.
17IMO 2020: Backdrop 18
Demand for MGO and VLSFO Set to Increase(2)
▪ Implementation on January 1, 2020 firmly fixed; expected to result in
significant increase in demand for compliant fuels: 5
4.5
MGO MGO /
o HSFO market for bunker fuels currently 3.5 – 4 mbd; approx. 2 mbd 4
Demand Million Barrels / day
VLSFO
to be replaced by MGO or VLSFO(1) 3.5
3
▪ Market transition expected to commence mid-2019: 2.5
2
o Refineries expected to increase output and shift product slate away 1.5
from fuel oil and toward middle distillate as well as find ways to make
1
VLSFO HSFO HSFO
0.5
0
o Bunker providers need to prepare logistics infrastructure and manage
2018 2020
down inventories of HSFO
VLSFO Limited to Main Bunkering Hubs(3)
o Shipowners either installing scrubbers or preparing to use compliant
fuels
▪ Limited initial availability of VLSFO, combined with slow scrubber
installation pace, expected to boost demand for MGO and to create up
to two years of market disruption before equilibrium is reached:
o VLSFO initially limited to main bunker ports; MGO expected to be in
high demand worldwide as market transitions
o Scrubber uptake may be restricted by installation complexity and rigid
docking schedules; less than 4% of global fleet (approx. 15% of
bunker fuel demand) expected to be fitted by implementation date(3)
1. High Sulphur Fuel Oil (“HSFO”) has a max. sulphur content of 3.5%. Very Low Sulphur Fuel Oil (“VLSFO”) has a max. sulphur content of 0.5%. Marine Gas Oil (“MGO”) has a max. sulphur content of 0.1%
2. Source: IEA; SEB IMO 2020 Report March 14, 2020; Evercore ISI R&M: IMO 2020 – Back to the Future, April 18, 2018
3. Management’s estimates
18IMO 2020: Impact on Tanker Demand 19
Demand for MGO and VLSFO Set to Spike(1)
▪ Transition of 2 mbd HSFO to compliant fuels expected to have a
significant impact on tanker market from mid-2019: 2.5x increase in expected demand for MGO in 2020
100%
o Higher seaborne volumes of MGO as demand increases by 1 – 1.5
mbd in 2020(1) 80%
60%
o Surplus HSFO will have to be redirected from current consuming
regions for further processing, or alternative use, boosting demand for
40%
crude tankers
20%
o Redirection of crude flows as refineries look to respond to new market
conditions, with high complexity refineries sourcing cheaper heavy sour 0%
crude and simpler refineries searching for light sweet grades 2017 2018E 2019E 2020E 2021E 2022E 2023E
HSFO MGO VLSFO
▪ Demand for product tankers expected to increase: Bunker Demand 2018; Expect Significant Imbalances(2)
o Increased consumption and regional imbalances of MGO leading to In Europe alone ~700,000 bpd of HSFO expected
Demand Million barrels / day
tonne-mile demand boost; e.g. Europe expected to substitute 700 kbd 2.0 to be replaced by MGO/VLSFO in 2020
of HSFO with compliant fuels(2)
1.5
o Imbalances create oil price volatility, increasing arbitrage opportunities
and oil trading activity 1.0
o US Gulf, Middle East and Asia expected to be significant exporters of 0.5
compliant fuels to Europe and other regions, increasing average
voyage lengths 0.0
North Am. Latin Am. Europe Africa FSU Middle Asia Pacific
High Sulphur Fuels Low Sulphur Fuels East
1. Source: IEA; SEB IMO 2020 Report March 14, 2020; Evercore ISI R&M: IMO 2020 – Back to the Future, April 18th 2018; Wells Fargo Securities, IMO 2020 Min-Conference, June 4, 2018
2. McKinsey Energy Insights “MARPOL implications on refining and shipping markets”, December 2017
19Financial 20
.
20Cost Efficient Platform 21
Average MR OPEX ($ / day)(1) Overhead ($ / day)(2)
$6,435 $1,594
$1,443
$6,337 $1,348
$6,298
$1,216
+20%
+27% YoY
YoY
Ardmore Co. A Co. B Ardmore Co. A Co. B Co. C
▪ Among lowest operating expenses and overhead of our peers
▪ Achieve lower cost through a high-quality fleet, strict cost management and budgetary process
▪ Focus on maintaining low cash break-even to ensure financial durability and flexibility
1. Data sourced from most recent public filings for the full year 2017. OPEX / day on an MR basis only. Co. C does not provide detail on MR OPEX
2. Peer data sourced from most recent public filings for the full year 2017. Ardmore’s overhead per day calculated based on 2017 corporate overhead only and fleet of 28 vessels
21Strong Balance Sheet and Liquidity Position 22
$66.1 Conservative capital
$20.3 structure and strong
liquidity position; corporate
leverage ~56.6%(1)
$468.5 $10.0 $10.7 $10.7 $10.8 $10.8 $43.1
$752.1 $3.6(3)
$326.9
$42.0
Pro Forma Pro Forma Gross 4Q18 1Q19 2Q19 3Q19 4Q19 2020 2021 Est. Debt
Vessels, Cash & Debt 3Q18 Dec, 2021
Net Working
Capital 3Q18
Vessel Assets Net Working Capital Pro-Forma Cash 3Q18 Repayments Balloon Repayments
▪ Cash at end of September 2018 of $66 million(1) on a pro forma basis
▪ All current debt (including capital leases) is amortizing at approximately $43 million per year
▪ No near term debt maturities; next significant maturity in 2022(3)
1. Leverage calculation based on pro forma US GAAP leverage as at September 30, 2018 giving effect to refinancings completed in October and December 2018. Cash is based on
closing balance as at September 30, 2018 of $33.3mln plus net cash release of $19.7mln from refinancing of four vessels completed in October 2018 and $13mln from refinancing of
three vessels completed in December 2018
22 2. Pro forma gross debt balance at September 30, 2018; (i) excludes deduction of deferred finance fees, (ii) net of sellers’ credit $2.9mln in respect to sale and leaseback of Ardmore
Sealeader and Ardmore Sealifter in 2Q17 (iii) includes additional leases of $19.7mln completed in October, 2018 (iv) includes additional leases $13.0mln completed in December, 2018
3. One loan matures in 2021 in respect to an Eco-Mod MR. Balloon is $3.6 million due in September, 2021. Balloons due in 2022 amount to approx. $164mlnTop Tier Investor Base 23
Top 20 Shareholders(1) Commentary
No Holder Position Percent ▪ Approximately 80% of shares held by top
1 Donald Smith & Co Inc 2,969,095 8.97% 20 shareholders
2 Frank Russell Co 2,841,329 8.58%
3 Royce & Associates LP 2,207,041 6.67%
▪ Long only investors, many of whom have
4 FMR LLC 1,659,522 5.01%
been with us since the IPO
5 Cross River Management LLC 1,623,913 4.91%
6 BlackRock Inc 1,584,561 4.79%
7 Bank of New York Mellon 1,572,352 4.75%
8 Boston Partners Global Investors I 1,468,415 4.44%
9 Aristotle Capital Management LLC 1,287,505 3.89%
10 Dimensional Fund Advisors LP 1,247,039 3.77%
11 Eagle Boston Investment Management 1,147,376 3.47%
12 Van Den Berg Management I Inc 959,586 2.90%
13 Northern Trust Corp 891,430 2.69%
14 American Century Cos Inc 858,730 2.59%
15 Silver Rock Financial LLC 816,310 2.47%
16 Schneider Capital Management Corp 776,809 2.35%
17 Private Management Group Inc 622,925 1.88%
18 Tocqueville Asset Management LP 552,553 1.67%
19 Carlson Capital LP 500,000 1.51%
20 State Street Corp 496,325 1.50%
1. Bloomberg as at November 6, 2018
23Significant Earnings Power Across Fleet(1) 24
Significant Potential Earnings Power with 28 x Ship Fleet (1)
Vessel Type TCE per day TCE per day TCE per day
MR Product (50k Dwt) $17,761 $21,500 $25,000
MR Chem (25-37k Dwt) $15,000 $17,500 $18,000
$2.61
$1.73
Earnings Per
Share(1) $0.67
Base Rates Rates FY2015 Upside Rates - 3Q15
Every $1,000 / day increase in rates ≈ $0.31 / share in EPS
1. Management’s estimates based on (i) 28 vessels, (ii) 33,097,831 shares as at September 30, 2018 (iii) 363 revenue days / vessel, (iv) expenses as per 2017 financial statements. Accretion assumes
positive earnings. Actual EPS estimates may differ materially from the estimated EPS. MR rate of $17,761 / day and chemical tanker rates of $15,000 / day are based on Analyst’s estimates for
2019. MR and chemical tanker rates for FY2015 based on ASC rates reported for full year 2015 and rates for 3Q15 are based on ASC rates reported in 3Q15. The rates reported in 3Q15 were the
24 highest rates achieved by ASC in the past five years but are not representative of cyclical highs achieved by the industry overallSummary 25
.
25Why Invest In Ardmore? 26
Company Highlights:
✓ A leading product tanker company listed on the NYSE
✓ High-quality fleet of 28 “Eco” MRs built in Korea and Japan, with average
age of 6.5 years
✓ Strategy focused on maximizing ROIC through operating performance,
cost efficiency and market timing
✓ Conservative capital structure; low leverage and strong liquidity position
✓ Strong track record of transparency; corporate governance ranked in top
tier of marine transportation sector(1)
Market Summary:
✓ Charter rates have increased; strong rebound in crude tanker rates
expected to lead a general tanker market recovery
✓ MR tonne-mile demand growth is robust, oil consumption growth
matched by refinery capacity additions in trading-oriented locations(2)
✓ The MR orderbook remains at a record-low of 4.7%; net fleet growth
expected to be close to zero in 2018 and around 1% in 2019(3)(4)
✓ IMO 2020 expected to be a game changer for tankers(5); increased
seaborne volumes of compliant bunker fuels, greater arbitrage
opportunities and oil trading activity, all contributing to an expected boost
to tonne-mile demand
1. Wells Fargo Corporate Governance Scorecard Volume V issued May 23, 2018
2. IEA Oil Market Report, October 12, 2018
3. Clarksons Shipping Intelligence Network, October 2018
26 4. Clarksons Shipping Intelligence Network, and Management’s estimates. Note these numbers include slippage. Management’s estimates based on 50% of 4Q18 scheduled
deliveries slipping into 2019
5. Deutsche Bank: IMO2020 Game changer on horizon, June 2018You can also read