Textainer Group Holdings Ltd - Investor Presentation February 2021 - Textainer Group ...

Page created by Dana Daniel
 
CONTINUE READING
Textainer Group Holdings Ltd - Investor Presentation February 2021 - Textainer Group ...
Textainer Group Holdings Ltd.
Investor Presentation
February 2021
Textainer Group Holdings Ltd - Investor Presentation February 2021 - Textainer Group ...
Forward Looking Statements

Certain information included in this presentation and other statements or materials published or to be published by the Company are
not historical facts but are forward‐looking statements relating to such matters as anticipated financial performance, business
prospects, technological developments, new and existing products, expectations for market segment and growth, and similar matters.
In connection with the “safe harbor” provisions of the Private Securities Litigation Reform Act of 1995, the Company provides the
following cautionary remarks regarding important factors which, among others, could cause the Company’s actual results and
experience to differ materially from the anticipated results or other expectations expressed in the Company’s forward‐looking
statements. The risks and uncertainties that may affect the operations, performance, development, results of the Company’s business,
and the other matters referred to above include, but are not limited to: (i) changes in the business environment in which the Company
operates, including global GDP changes, the level of international trade, inflation and interest rates; (ii) changes in taxes, governmental
laws, and regulations; (iii) competitive product and pricing activity; (iv) difficulties of managing growth profitably; and (v) the loss of
one or more members of the Company’s management team.

 As required by SEC rules, we have provided a reconciliation of the non‐GAAP financial measures included in this presentation to the
 most directly comparable GAAP measures in materials on our website at www.textainer.com.

                                                                                                                                              2
Textainer Group Holdings Ltd - Investor Presentation February 2021 - Textainer Group ...
Company Overview
Textainer Group Holdings Ltd - Investor Presentation February 2021 - Textainer Group ...
Company Background
           Textainer has operated since 1979 and is one of the world’s largest lessor of intermodal containers with a container
            fleet of 3.8 million TEU

           Textainer leases containers to over 250 customers, including all of the world’s leading international shipping lines

           Textainer is also one of the largest sellers of new and used containers with average annual sales of 150,000 units

           Textainer manages a diversified container fleet that consists of standard dry freight, dry freight specials, tanks, and
            refrigerated intermodal containers, mirroring the composition of the worldwide fleet

             Overview                                                                                                Summary performance
                    Headquartered in Bermuda                                                                               Last twelve‐month (“LTM”) lease rental income of
                    Scalable network of 14 offices and over 400 depots                                                      $601 million
                    Workforce of over 170 employees                                                                        LTM Adjusted Net Income1 of $87 million
                    Publicly traded in both the New York (Ticker “TGH”)                                                    LTM Adjusted EBITDA1 of $476 million
                     and Johannesburg (Ticker “TXT”) stock exchanges                                                        Average fleet age of 5 years (NBV weighted)

Note: TEU refers to Twenty‐Foot Equivalent Unit, a unit of measurement based on the length of a container relative to a standard 20’ dry freight container. CEU refers to a Cost
Equivalent Unit, a unit of measurement based on the approximate cost of a container relative to the cost of a standard 20’ dry freight container
(1) Adjustments include items such as unrealized gains/losses on derivative instruments. See reconciliation in Appendix                                                            4
Textainer Group Holdings Ltd - Investor Presentation February 2021 - Textainer Group ...
Textainer Advantages
 Fleet size                                                 Diversified revenue
  Our large fleet size is a competitive advantage,          Equipment type diversification provides exposure to
   particularly in light of recent supplier and customer      industries with decoupled economic cycles
   consolidation                                             Our dedicated international resale team is a leader
  A large fleet size affords us meaningful economies of      in the field as one of the largest sellers of containers
   scale with one of the industry’s lowest cost structure     in the world, focused on maximizing resale proceeds
  Our size allows us to hold sufficient idle inventory      We also purchase and resell containers from
   around the world to immediately meet any urgent            shipping lines, container traders and other sellers
   demand requirements from our customers                    We manage containers on behalf of 3rd party
                                                              owners, earning a steady stream of low‐risk fee
                                                              income using our existing platform

 Infrastructure                                             Capital structure
  Experienced management team providing best‐in‐            We maintain low‐cost debt financing from diversified
   class service to our business partners                     funding sources and with staggered maturities
  Over 40yrs of know‐how to procure, inspect, market,       Most of our debt is fixed‐rate, helping mitigate
   repair, and resell containers, maximizing returns over     interest rate risk
   the container’s entire economic life‐cycle                Active share buyback program to improve
  Highly scalable and efficient IT infrastructure            shareholder value
  Expansive global footprint to service customers in all
   demand locations

                                                                                                                         5
Textainer Group Holdings Ltd - Investor Presentation February 2021 - Textainer Group ...
Textainer Fleet Overview
                     Fleet size1 (TEU)                                                                 Lease portfolio (TEU)                                                                   Equipment types (CEU)

                                          Triton
                                           26%
                                                                                                                                                                                                              40ft Dry
                                                                                                                    Short‐term lease
             Textainer                                                                                                                                                                                          52%
                                                                                                                          13%
               17%
                                                           Other
                                                                                                                        Finance lease
                                                            10%
                                                                                                                            17%                                                                                                              Specials
                                                                                                Long‐term lease                                                                                                                                4%
                                                    SeaCube                                           70%                                                                                                                      Reefers
              Florens                                 5%                                                                                                                                               20ft Dry                 19%
                17%                                 CAI                                                                                                                                                  25%
                                                    7%
                                           Beacon
                           Seaco
                                             8%
                            10%
                                                             Second largest lessors in the                                         We manage 12% of our fleet for 3rd
                                                           world, we generate stable cash‐                                         party owners; providing additional,
                                                            flows from a mix of 87% long‐                                           low‐risk fee revenue, and future
                                                                     term leases                                                      fleet purchase opportunities

      TEUs                                Fleet size growth                                                             TEUs                            Fleet by manufacturing year2                                                                    Rate/CEU

     4,000,000                                                                                                         600,000                                                                                                                           160%
     3,500,000                                                                                  12%                                                                                                                                                      140%
                                                                                                                       500,000
                                                                                         15%
     3,000,000                                                                    21%           88%                                                                                                                                                      120%
                                                    21%      20%    19%    21%
                                            24%                                          85%                           400,000
     2,500,000                                                                                                                                                                                                                                           100%
                                  27%                                             79%
                                                    79%      80%    81%    79%                                         300,000                                                                                                                           80%
     2,000,000             41%              76%
                   49%            73%                                                                                                                                                                                                                    60%
     1,500,000                                                                                                         200,000
     1,000,000             59%                                                                                                                                                                                                                           40%
                   51%                                                                                                 100,000
                                                                                                                                                                                                                                                         20%
      500,000
                                                                                                                               ‐                                                                                                                         0%
             ‐
                                                                                                                                              2006
                                                                                                                                                     2007
                                                                                                                                                            2008
                                                                                                                                                                   2009
                                                                                                                                                                          2010
                                                                                                                                                                                 2011
                                                                                                                                                                                        2012
                                                                                                                                                                                                2013
                                                                                                                                                                                                       2014
                                                                                                                                                                                                              2015
                                                                                                                                                                                                                     2016
                                                                                                                                                                                                                            2017
                                                                                                                                                                                                                                   2018
                                                                                                                                                                                                                                          2019
                                                                                                                                                                                                                                                 2020
                                                                                                                                     < 2005
                    2010

                           2011

                                   2012

                                             2013

                                                    2014

                                                             2015

                                                                    2016

                                                                           2017

                                                                                  2018

                                                                                         2019

                                                                                                2020

                                              Owned         Managed                                                                                   Container TEU                                       Rental rate vs. fleet avg
1)      Peer fleet size data sourced from Harrison Consulting and public filings
2)      Rental rate per CEU calculated of operating long‐term leases and is indexed to the fleetwide average
                                                                                                                                                                                                                                                                   6
Textainer Group Holdings Ltd - Investor Presentation February 2021 - Textainer Group ...
Textainer Container Inventory
               Uncommitted new production inventory                                                 TEUs       Container lease‐out and turn‐in activity
  TEUs              (China factory inventory)                                                     450,000
100,000
                                                                                                  350,000
 80,000
                                                                                                  250,000
 60,000                                                                                           150,000
 40,000                                                                                             50,000
 20,000                                                                                            (50,000)

         ‐                                                                                        (150,000)

                                                                                                              1Q18

                                                                                                                     2Q18

                                                                                                                            3Q18

                                                                                                                                      4Q18

                                                                                                                                             1Q19

                                                                                                                                                    2Q19

                                                                                                                                                           3Q19

                                                                                                                                                                  4Q19

                                                                                                                                                                         1Q20

                                                                                                                                                                                2Q20

                                                                                                                                                                                       3Q20

                                                                                                                                                                                              4Q20
              1Q18

                     2Q18

                            3Q18

                                   4Q18

                                          1Q19

                                                 2Q19

                                                        3Q19

                                                               4Q19

                                                                      1Q20

                                                                             2Q20

                                                                                    3Q20

                                                                                           4Q20
                                                                                                                                   On‐hire           Off‐hire            Net

             Available depot inventory (non‐factory inventory)

                                                                                                                                All new production
                                                                                                                            inventory at 12/31/20 was
                                                                                                                             pre‐committed to a lease
                                                                                                                            and on‐hired within weeks
                                                                                                                                    of year‐end

                                                                                                                             We experienced extremely
                                                                                                                            high lease‐outs and low turn‐
                                                                                                                               ins during 2H20, driving
                                     Minimal idle inventory at depot                                                          utilization above 99% by
                                          (less than 15K TEU)                                                                          year‐end

                                                                                                                                                                                                     7
Textainer Group Holdings Ltd - Investor Presentation February 2021 - Textainer Group ...
Textainer Lease Expiration

        CEUs
                                   Operating Leases (all equipment types)1                                           Rate/CEU

         900,000                                                                                                    120%
         800,000                                                                                                                                     “Sales Age” containers have
                                                                                                                    110%
         700,000                                                                                                                                     exceeded their useful life at
         600,000                                                                                                    100%                             lease expiry and thus likely
         500,000                                                                                                                                     to be sold upon redelivery
                                                                                                                    90%
         400,000
         300,000                                                                                                    80%
         200,000
                                                                                                                    70%
         100,000                                                                                                                                     Customers generally have a
                0                                                                                                   60%
                                                                                                                                                     6‐ to 12‐month build‐down
                                                                                                                                                     period to return containers
                                       2021

                                                   2022

                                                               2023

                                                                                  2024

                                                                                          2025

                                                                                                       Thereafter
                         Expired

                                                                                                                                                          upon lease expiry

                     Long term                Spot/MLA                Sales age          Rental rate vs. fleet avg

               Our operating leases have an average remaining lease term                                                                           On average, we successfully
                                                                                                                                                      renew and extend about
                of 3.2 years (NBV weighted, excluding finance leases and
                                                                                                                                                    two thirds of expiring leases
                sales age containers)
               During 4Q, we successfully renewed leases totaling over
                280k CEU, mostly as life‐cycle‐leases, with favorable rates
                which helped boost our quarterly revenue

1) Consists only of containers on operating leases (excludes finance leases, factory and depot). The average rental rate per CEU is indexed to the fleetwide average for all operating leases

                                                                                                                                                                                                8
Textainer Group Holdings Ltd - Investor Presentation February 2021 - Textainer Group ...
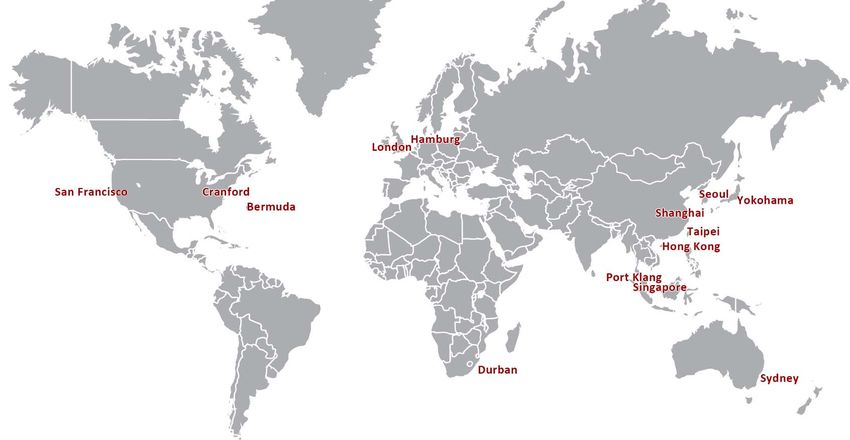
Textainer Capex and Resale
                            Container investments (new and used)1                            Total CEU
                                                                                                                              Container investments of $1,080M delivered
        Per CEU
        $2,400                                                                                600,000
                                                                                                                               during 2020 ($470M in 4Q20). Our total fleet
        $2,200                                                                                                                 surpassed 4M CEU at year‐end
                                                                                              500,000
        $2,000
                                                                                                                              We remain focused on capex with double‐digit
        $1,800
        $1,600
                                                                                              400,000                          returns and accretive to our financial
        $1,400                                                                                300,000                          performance
        $1,200
                                                                                              200,000
                                                                                                                              Container prices increased significantly since
        $1,000
                                                                                                                               3Q20, driven by the surge in demand and limited
          $800
                                                                                              100,000                          supply
          $600
          $400                                                                                ‐
                     2013

                               2014

                                        2015

                                                 2016

                                                          2017

                                                                   2018

                                                                            2019

                                                                                     2020
                                                                                                               Per CEU                              Container resale2                                     Total CEU
                                      Total CEU
                                      Avg cost per CEU                                                         $2,200                                                                                     300,000
                                      Avg cost per CEU (all periods presented)                                 $2,000
                                                                                                                                                                                                          250,000
                                                                                                               $1,800
                                                                                                               $1,600                                                                                     200,000
                                                                                                               $1,400
                                                                                                                                                                                                          150,000
                                         Resale proceeds                                                       $1,200
                                       represent over 50%                                                      $1,000                                                                                     100,000
                                         of the container                                                        $800
                                                                                                                                                                                                          50,000
                                         acquisition cost                                                        $600
                                       (eight‐year average)                                                      $400                                                                                     ‐
                                                                                                                             2013

                                                                                                                                       2014

                                                                                                                                                 2015

                                                                                                                                                          2016

                                                                                                                                                                   2017

                                                                                                                                                                            2018

                                                                                                                                                                                      2019

                                                                                                                                                                                               2020
                                                                                                                                              Total disposals
                                                                                                                                              Avg proceeds per CEU
                                                                                                                                              Avg proceeds per CEU (all periods presented)

1)   Total container purchases for both the owned and managed fleet, based on date added to the fleet (delivery date). Does not reflect fleet ownership changes between owned and managed
2)   Resale of off‐hired operating containers (i.e. held for sale depot containers). Does not include container trading activity (i.e. sale of new or old containers acquired exclusively for immediate
     resale). The average proceeds per CEU reflect total proceeds received
                                                                                                                                                                                                                      9
Textainer Group Holdings Ltd - Investor Presentation February 2021 - Textainer Group ...
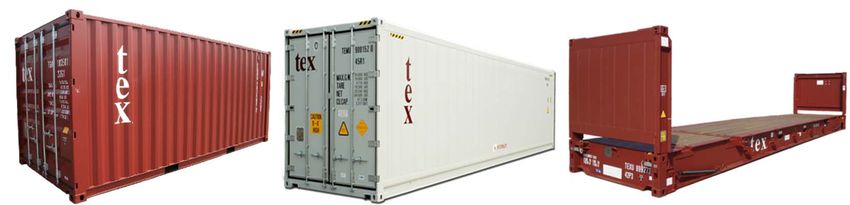
Textainer Cost Management
                                    Average fleet utilization                   99.5% as of
                                                                               early February
       100%

        99%
                                                                                                                       Utilization averaged 98.5% during 4Q20 and
        98%
                                                                                                                        currently stands at 99.5%
        97%

        96%                                                                                                            Our economies of scale and cost control
        95%                                                                                                             initiatives have resulted in low normalized
        94%                                                                                                             operating costs
        93%
               2Q15
               3Q15
               4Q15
               1Q16
               2Q16
               3Q16
               4Q16
               1Q17
               2Q17
               3Q17
               4Q17
               1Q18
               2Q18
               3Q18
               4Q18
               1Q19
               2Q19
               3Q19
               4Q19
               1Q20
               2Q20
               3Q20
               4Q20
               1Q21
                                    Quarterly          Six‐year average

                 Direct container costs as % of rental income                                                               SG&A as % of total revenues1
        20%                                                                                                  8%
        18%              Hanjin
                        default                                                                              7%
        16%
        14%                                                                                                  6%
        12%
        10%                                                                                                  5%

          8%
                                                                                                             4%
          6%
          4%                                                                                                 3%
                2Q15
                3Q15
                4Q15
                1Q16
                2Q16
                3Q16
                4Q16
                1Q17
                2Q17
                3Q17
                4Q17
                1Q18
                2Q18
                3Q18
                4Q18
                1Q19
                2Q19
                3Q19
                4Q19
                1Q20
                2Q20
                3Q20
                4Q20

                                                                                                                      2Q15
                                                                                                                      3Q15
                                                                                                                      4Q15
                                                                                                                      1Q16
                                                                                                                      2Q16
                                                                                                                      3Q16
                                                                                                                      4Q16
                                                                                                                      1Q17
                                                                                                                      2Q17
                                                                                                                      3Q17
                                                                                                                      4Q17
                                                                                                                      1Q18
                                                                                                                      2Q18
                                                                                                                      3Q18
                                                                                                                      4Q18
                                                                                                                      1Q19
                                                                                                                      2Q19
                                                                                                                      3Q19
                                                                                                                      4Q19
                                                                                                                      1Q20
                                                                                                                      2Q20
                                                                                                                      3Q20
                                                                                                                      4Q20
1)   Total revenues consist of lease rental income, gain on sale, trading container margin, and management fee income
                                                                                                                                                                      10
Textainer Debt Financing
                 Outstanding borrowings by source                                                                                        Avg. effective interest rate per quarter
                                                                                                                             4.40%
                                                                                                                             4.20%
                                                                                                                             4.00%
              ABS Notes                                            37%
                                       $1,547M                                                                               3.80%
                                                                                                                             3.60%
             Term Loans                 $375M                      9%                                                        3.40%
                                                                                                                             3.20%                                    Represents the average rate for
                                        $650M                      16%
     Secured Warehouse                                                                                                                                               the quarter, inclusive of non‐cash
                                                                                                                             3.00%                                    amortization of debt issue fees
                                                                                                                             2.80%
              Revolving
         Credit Facilities             $1,571M                     38%                                                       2.60%

                                                                                                                                        2Q15

                                                                                                                                               4Q15

                                                                                                                                                      2Q16

                                                                                                                                                             4Q16

                                                                                                                                                                     2Q17

                                                                                                                                                                            4Q17

                                                                                                                                                                                   2Q18

                                                                                                                                                                                           4Q18

                                                                                                                                                                                                  2Q19

                                                                                                                                                                                                         4Q19

                                                                                                                                                                                                                 2Q20

                                                                                                                                                                                                                        4Q20
                                      $4,142M
                                                                Effective interest rate                                Properly hedged debt
                                                                (inclusive of non‐cash                               from diversified sources
                                                               amortization) lowered to                                 and with staggered
                                                                  3.1% during 4Q20                                          maturities

                       Future debt repayments1                                                                                                               % of total Remaining
       $2,000M                                                                                                                                               at period     term                          Avg rate for Spot rate at
                                                                                                   Floating vs. Fixed rate debt                                 end      (months)                        the quarter period end
       $1,500M                                                                                     Fixed rate debt                                                  46%                   51                    3.05%          3.05%
                                                                                                   Hedged floating rate debt (swaps)                                31%                   29                    3.11%          3.17%
       $1,000M
                                                                                                   Total fixed rate and hedged debt                                 77%                   42                    3.07%          3.10%
        $500M                                                                                      Unhedged floating rate debt                                      23%                                         1.89%          1.90%
                                                                                                   Total debt                                                       100%                                        2.91%          2.83%
          $0M
                                                   2                                                 Non‐cash amortization of debt issue fees                                                                   0.22%          0.23%
                     2021       2022         2023          2024      2025
                         Revolving credit faciliy up for renewal                                     Effective interest rate (all‐in)                                                                           3.13%          3.06%

1)   Reflects contractual amortization of our notes, estimated repayments to maintain the maximum loan‐to‐value in our revolving facilities (based on the current existing fleet absent any future capex),
     and the contractual maturity of our existing revolving facilities (assuming no refinance/renewal)
2)   Includes revolving credit facility debt maturing on 3Q23 which will be renewed and extended prior to maturity                                                                                                                     11
Company Footprint

   Textainer operates through a network of 14 offices and 400 depots covering all time zones and major
    trading centers over the world. Our four regional offices form the backbone of our worldwide leasing,
    resale, and operations activities.

                                                                                                            12
Container Life Cycle Management

           Initial Lease                                                                 Mid‐Life                                                                Disposition

                                                                                 Lease renewal or re‐lease to                                              Sale generally for static storage
          Lease term generally five                                                                                                                         or one‐way cargo
                                                                                  different customers
           to seven years
                                                                                 May be re‐leased several                                                  Resale market enjoys a
          We place a significant                                                                                                                            different customer base
                                                                                  times over useful life
           focus on the off‐hire
           provisions                                                            We leverage our global                                                    Container residual values
                                                                                  infrastructure and                                                         generally ~50% of current asset
                                                                                  operational expertise                                                      cost

             45% of total                                                              30% of total                                                                25% of total
           expected returns                                                          expected returns                                                            expected returns

             With over 40 years of experience, Textainer maximizes returns throughout the entire container life cycle

Note: Expected returns are based on discounted estimated cash inflows of a container over its container useful life. Actual cash flows may vary from estimates
                                                                                                                                                                                                 13
Management Team
                             Olivier Ghesquiere                                                                     Michael Chan
                             President & Chief Executive Officer                                                    Executive VP & Chief Financial Officer
                             25 years of international asset management                                             30 years of accounting and finance and 24 of
                             experience including work at Ermewa Group                                              international asset management experience
                             as Chief Operating Officer and CEO,                                                    including work at Ygrene Energy Fund as CFO,
                             Eurotainer as Managing Director and                                                    Cronos Container Group as Sr. Director of
                             Chairman, and Brambles Group under                                                     Treasury, Chartres Lodging Group as CFO, and
                             various management positions.                                                          Price Waterhouse Coopers as audit manager.
                             • Joined in 2016                                                                       • Joined 1994 to 2006 and in 2017

Philippe Wendling            15 years of transportation leasing and marketing          Gregory Coan                 34 years of Information Technology and 27 years of
Senior VP, Marketing         experience                                                Senior VP, CIO               intermodal industry experience
                             Joined in 2019                                                                         Joined in 1992

Vincent Mak                  43 years of intermodal and shipping industry experience   Daniel Cohen                 23 years of corporate, finance, and securities legal
Regional VP, South Asia      Joined in 1996                                            VP, General Counsel          experience with international law firms and in‐house
                                                                                                                    Joined in 2011

Charles Li                   32 years of container leasing marketing experience        Jack Figueira                35 years of intermodal and shipping industry experience
Regional VP, PRC and Korea   Joined in 1994                                            VP, Ops and Procurement      experience
                                                                                                                    Joined in 1990

Michael Samsel               28 years of container leasing marketing experience        Giancarlo Gennaro            16 years of accounting and finance and 8 years of
Regional VP, EMEA            Joined in 1998                                            VP, Finance                  intermodal industry experience
                                                                                                                    Joined in 2017

John Simmons                 30 years of intermodal industry experience                Cannia Lo                    20 years of accounting and finance experience in the
Regional VP, Americas        Joined in 2011                                            VP, External Reporting and   intermodal industry
                                                                                       Consolidation                Joined in 2001

Alvin Chong                  25 years of resale and 30 years of intermodal industry
Global VP, Resale            experience
                             Joined in 1995

                                                                                                                                                                              14
Industry Overview
Container Types
           Containers are large steel boxes built to International Standardization Organization (“ISO”) norms and used for intermodal
            freight transportation. They are divided into four main categories

                                                                       Worldwide fleet by equipment type1
                                                Dry standard

                                                      Reefer                                                                    TEU%

                                                     Specials                                                                   CEU%

                                                       Tanks

                                                                0%       20%          40%      60%         80%         100%

              Dry standard                           Refrigerated (“Reefer”)                                     Specials                                       Tanks
Fitted with steel roof, end and side panels,   Steel cladding fitted with insulation and an    Similar to Dry standard, but designed         Stainless steel cylinder set within an ISO
wooden floors and steel doors.                 externally mounted temperature‐control          specifically for the transportation of non‐   steel frame.
                                               unit to control internal temperature.           conforming cargoes.
Used to carry a wide range of semi‐finished                                                                                                  Used mostly to carry industrial chemicals in
and finished manufactured goods, raw           Used to carry frozen and temperature‐           Used to carry non‐standard items such as      liquid form and potable liquids such as fruit
materials and agricultural produce             sensitive goods such as meat, fish, fruit and   sheet glass, large machinery, and vehicles    juices and wines
                                               vegetables

 1)   Source: Harrison Consulting
                                                                                                                                                                                          16
Container Production
                      Container TEU production by manufacturer
                                                                                                                              Containers are manufactured in China, a highly
            CIMC                                                                                                               desirable on‐hire location for our customers

             DFIC
                                                                                                                              Lead times can be as short as 3 weeks (longer
                                                                                                                               during high‐demand periods), allowing near
             CXIC                                                                                                              “just‐in‐time” ordering, quickly adjusting to
                                                                                                                               changes in market demand and reducing
      Singamas                                                                                                                 inventory risk

          Others
                                                                                                                              Leased containers have a long economic life of
                    0%      5%      10%     15%     20%     25%     30%      35%     40%     45%     50%                       15+ years and little technological obsolescence
                                                   2020     2019

                                                                                                                              At the end of their economic life, containers are
                                                                                                                               sold on a secondary market to a different
                                 After recent consolidation in                                                                 customer base for other uses such as static
                                  20191, CIMC and DFIC have                                                                    storage or one‐way cargo moves
                                   emerged as the dominant
                               suppliers in terms of production
                                  capacity and market share

Note: In 2019, Singamas (a subsidiary of PIL) sold three of its manufacturing facilities to DFIC (a subsidiary of COSCO)
1) Figures based on management estimates using industry sources
                                                                                                                                                                                   17
Container Leasing
                                                                          Benefits                                                            Benefits
                                                                             to               Flexibility to on‐hire / off‐                       to                Leases are non‐cancellable,
                 Leasing customers are                                                        hire1 containers to optimize                                          with terms typically ranging
                                                                          lessees                                                              lessors              5‐7yrs (initial lease) and 1‐
                    primarily shipping                                                        capacity to meet fluctuating
                                                                                              demand requirements                                                   3yrs (renewals)
                  lines which generally
                                                                                                                                                                    Long‐term nature of leases
                lease a large portion of                                                      Flexibility to on‐hire / off‐                                         offers stable and predictable
                                                                                              hire1 containers at locations
                   their container fleet                                                      around the globe to
                                                                                                                                                                    cash flows with protection
                                                                                                                                                                    during economic down
                                                                                              alleviate trade imbalances                                            cycles
                                                                                              Conserves capital for                                                 Leases are “triple‐net”
                                                                                              significant cash                                                      requiring the lessee to pay
                      Given recent                                                            requirements such as                                                  for all repairs in excess of
                 consolidation, the top                                                       vessels, terminals, and fuel                                          normal wear and tear
                                                                                              costs
                   10 shipping lines
                                                                                                                                                                    Lessees are incentivized to
                    represent +80%                                                            Provides an alternate source
                                                                                                                                                                    renew expiring leases to
                                                                                              of financing in a capital
                     market share                                                             intensive business
                                                                                                                                                                    avoid repair costs and the
                                                                                                                                                                    logistical cost of the return

               Container vessels slots by shipping line2                                                                          Container fleet ownership2
                                              COSCO
                                MSC
                                               13%
                                16%
                                                                                                                                                      Other lessors
                                                           CMA                                                                                            41%
                                                           12%                                                                       Textainer
                       Maersk                                                        24M TEU vessel slots                               8%
                        17%                        Hapag‐Lloyd                       serviced by 45M TEU
                                                       7%                                 containers
                                                                                                                                                   Shipping lines
                             All others         Top 6‐10                                                                                               51%
                                16%               19%

                      Worldwide total slots: 24M TEU                                                                            Worldwide total containers: 45M TEU

1)   Containers can only be off‐hired at the termination of the contractual lease term and are subject to provisions that limit the amount and location of returning containers
2)   Source: Harrison Consulting
                                                                                                                                                                                                    18
World Container Trade
                         Container trade vs. GDP growth1
         15%
                                                                                                                                    Container demand is inherently tied to trade.
         10%                                                                                                                         Growth of the container fleet is normally
          5%                                                                                                                         expected to be in line with global GDP growth
          0%

          ‐5%                                                                                                                       At the end of their economic life, containers are
         ‐10%
                                                                                                                                     sold on a secondary market to a different
                                                                                                                                     customer base for other uses such as static
         ‐15%
                                                                                                                                     storage or one‐way cargo moves
                 2008

                          2009

                                  2010

                                         2011

                                                  2012

                                                          2013

                                                                 2014

                                                                        2015

                                                                                2016

                                                                                       2017

                                                                                              2018

                                                                                                     2019

                                                                                                            2020

                                                                                                                   2021 (est.)
                                                Container trade                  Real GDP
                                                                                                                                    Quarantine measures in 1H 2020 caused a
                                                                                                                                     temporary decline in trade volumes, followed
                                 Trade flow by major trade route2                                                                    by a sharp recovery starting in 3Q20 as
                                                                                                                                     economies re‐opened and consumer spending
                Intra‐Asia                                                                                                           shifted from travel and entertainment into
            Transpacific
                                                                                                                                     physical goods

            Asia‐Europe

      Asia‐Middle East

           Intra‐Europe

           Transatlantic

                        Other

                                  0%        5%           10%      15%          20%     25%       30%        35%         40%

1)   Source: GDP figures published by the IMF. Container trade figures are based on management estimates using various industry sources
2)   Source: Harrison Consulting
                                                                                                                                                                                         19
Historical Container Market Data
     $/unit           New container price vs. steel cost2                                   TEUs
                                                                                                                             New production – Dry containers2                                                 Avg CoC
 $3,600                                                                                     1,600,000                                                                                                         14.00%
 $3,300                                                                                     1,400,000
 $3,000                                                                                                                                                                                                       12.00%
                                                                                            1,200,000
 $2,700
 $2,400                                                                                     1,000,000                                                                                                         10.00%
 $2,100                                                                                      800,000
 $1,800
                                                                                             600,000                                                                                                          8.00%
 $1,500
 $1,200                                                                                      400,000
  $900                                                                                                                                                                                                        6.00%
  $600                                                                                       200,000
  $300                                                                                             ‐                                                                                                          4.00%
              2Q15
              3Q15
              4Q15
              1Q16
              2Q16
              3Q16
              4Q16
              1Q17
              2Q17
              3Q17
              4Q17
              1Q18
              2Q18
              3Q18
              4Q18
              1Q19
              2Q19
              3Q19
              4Q19
              1Q20
              2Q20
              3Q20
              4Q20
              1Q21

                                                                                                          2Q15
                                                                                                          3Q15
                                                                                                          4Q15
                                                                                                          1Q16
                                                                                                          2Q16
                                                                                                          3Q16
                                                                                                          4Q16
                                                                                                          1Q17
                                                                                                          2Q17
                                                                                                          3Q17
                                                                                                          4Q17
                                                                                                          1Q18
                                                                                                          2Q18
                                                                                                          3Q18
                                                                                                          4Q18
                                                                                                          1Q19
                                                                                                          2Q19
                                                                                                          3Q19
                                                                                                          4Q19
                                                                                                          1Q20
                                                                                                          2Q20
                                                                                                          3Q20
                                                                                                          4Q20
                                                                                                          1Q21
                  20ft Dry (avg. quoted price)          Blended steel cost per container                        Lessors                      Shipping lines                       Market CoC Yield

     TEUs
                   Factory inventory ‐ Dry containers2                                      TEUs
                                                                                                                                     Worldwide fleet growth1
     1,300,000                                                                             50,000,000

     1,100,000                                                                             40,000,000
       900,000
                                                                                           30,000,000
       700,000
                                                                                           20,000,000
       500,000
                                                                                           10,000,000
       300,000

       100,000                                                                                     ‐
                                                                                                        2006

                                                                                                               2007

                                                                                                                      2008

                                                                                                                              2009

                                                                                                                                     2010

                                                                                                                                            2011

                                                                                                                                                   2012

                                                                                                                                                          2013

                                                                                                                                                                 2014

                                                                                                                                                                        2015

                                                                                                                                                                               2016

                                                                                                                                                                                      2017

                                                                                                                                                                                             2018

                                                                                                                                                                                                    2019

                                                                                                                                                                                                           2020
                 2Q15
                 3Q15
                 4Q15
                 1Q16
                 2Q16
                 3Q16
                 4Q16
                 1Q17
                 2Q17
                 3Q17
                 4Q17
                 1Q18
                 2Q18
                 3Q18
                 4Q18
                 1Q19
                 2Q19
                 3Q19
                 4Q19
                 1Q20
                 2Q20
                 3Q20
                 4Q20
                 1Q21

                                     Lessors     Shipping lines                                                                      Lessors       Shipping lines

1)     Source: Harrison Consulting
2)     Source: figures based on management estimates using industry sources
                                                                                                                                                                                                                        20
Quarterly Earnings
Overview of Quarterly Financial Results
                                                  4Q20 and % change from 3Q20                                                            Quarter Highlights
                                                                                                                             Significant improvement in performance. Improved
         Lease rental
                                                                 $161M (8%)                                                   lease rental income, EBITDA and net income, primarily
           income                                                                                                             due to fleet growth and higher utilization

                                                                                                                             Annualized ROE of 13%
        Income from                                                                                                          Leased out over 300K TEU of factory and depot
                                                                 $72M (33%)
         operations                                                                                                           containers. Extended over 280K TEU of maturing long‐
                                                                                                                              term leases (mostly as life‐cycle leases)

                                                                                                                             Utilization increased due to surge in container demand,
          Net income                                           $44M (161%)                                                    averaging 98.5% for the quarter and currently at 99.5%

                                                                                                                             Container deliveries of $470M, for a total of $1,080M
                                                                                                                              through FY2020; virtually all currently on lease
        Adjusted net                                                                                                         Repurchased 779K shares at an average price of $15.00
                                                                 $41M (90%)
          income1                                                                                                             per share. Remaining authority of $23M as at the end of
                                                                                                                              2020

                                                                                                                             Strong balance sheet with stable cash balance of $205M
             Adjusted
                                                               $137M (15%)                                                    and ample availability in our debt facilities
             EBITDA1

(1)   Adjustments include items such as unrealized gains/losses on derivative instruments. See reconciliation in Appendix

                                                                                                                                                                                      22
Current Market Environment and Outlook
  Favorable lease‐out market                      Increasing container prices                     Strong customer performance
 Continued surge in container demand due to     New container prices over $3500/CEU for        Shipping lines reporting strong financial
  a prolonged increase in trade volumes           orders placed today, compared to                results and a favorable 2021 outlook driven
 Surge in trade and the ensuing supply‐chain     $2500/CEU in November                           by record freight rates, improving volumes,
  inefficiencies (favorable to lessors) have     Pricing increase driven by high demand,         and lower operating costs
  combined to create container shortages in       production discipline by manufacturers and     Improved profitability has translated into
  Asia                                            shortages of certain components                 strong payment performance and has
 Lease‐out terms remain favorable, with         Resale prices improving in line with higher     allowed carriers to shore up their balance
  improved lease rates, longer tenors, and        new container prices and increased              sheets
  focused returns in Asia                         demand, however volumes are lower given        Shipping lines expected to continue to favor
                                                  high utilization rates                          leasing over container ownership. In 2020,
                                                 Very limited factory and depot inventory        lessors accounted for two‐thirds of
                                                                                                  container production

      Favorable market conditions                    We expect the reduced credit                   High utilization rates and
      are expected to remain                         risk of our customers to                       significant capex expected to
      through most of 2021                           continue in 2021. Carriers are                 drive further improvement to
                                                     also expected to continue to                   our revenues and
                                                     lease a significant portion of                 profitability in 1Q 2021
                                                     their containers

                                                                                                                                            23
Summary Financial and Business Highlights

            ($ in 000s, excluding per share amounts)                                          QTD                                                              Full-Year
                                                                      Q4 2020             Q3 2020                  Change                  2020                2019                  Change

            Lease rental income                                   $     161,491       $     149,130       $        12,361     8%       $    600,873        $    619,760        $     (18,887)   -3%
                                                 2
            Gain on sale and Trading margin                       $       9,198       $       8,910       $           288     3%       $      30,762       $     28,795        $       1,967     7%
            Income from operations                                $      71,816       $      54,109       $        17,707    33%       $    221,599        $    222,684        $      (1,085)    0%
            Net income to Textainer shareholders                  $      44,260       $      16,952       $        27,308 161%         $      72,822       $     56,724        $     16,098     28%
               per diluted share                                  $        0.87       $         0.32      $          0.54 169%         $        1.36       $        0.99       $        0.37    38%
            Adjusted net income                                   $      41,147       $      21,634       $        19,513    90%       $      87,277       $     55,375        $     31,902     58%
               per diluted share                                  $        0.81       $         0.41      $          0.40    98%       $        1.63       $        0.96       $        0.67    70%
            Adjusted EBITDA                                       $     136,834       $     118,960       $        17,874    15%       $    476,210        $    464,315        $     11,895      3%

            Cash, including restricted cash                       $     205,165       $     233,878       $        (28,713) -12%       $    205,165        $    277,905        $     (72,740) -26%
                                            3
            Total "lease" container fleet                         $ 5,368,880         $ 4,997,109         $    371,771        7%       $ 5,368,880         $ 4,723,112         $    645,768     14%
                                             4
            Total "resale" container fleet                        $      25,004       $      46,747       $        (21,743) -47%       $      25,004       $     53,214        $     (28,210) -53%
            Debt, net of deferred financing costs                 $ 4,115,344         $ 3,721,289         $    394,055       11%       $ 4,115,344         $ 3,797,729         $    317,615      8%
            Total equity                                          $ 1,286,718         $ 1,248,734         $        37,984     3%       $ 1,286,718         $ 1,285,645         $       1,073     0%

            Average fleet utilization 2                                   98.5%               96.0%                  2.5%     3%               96.6%               97.4%               -0.8%    -1%
            Total fleet size at end of period (TEU) 2                 3,774,053           3,599,889            174,164        5%           3,774,053           3,500,812            273,241      8%
                              1
            Container capex                                       $     470,000       $     420,000       $        50,000    12%           1,080,000            739,000        $    341,000     46%
            Shares repurchased                                          779,034           2,376,222                                        6,736,493            879,000

1)   Based on date added to the fleet (delivery date). Consists of all container purchases for both the       3)     Combined total of Containers, net, Net investment in finance leases, and Container leaseback
     owned and managed fleet. Does not reflect fleet moves between owned and managed                                 financing receivable
2)   Combined total of Gain on sale of owned fleet containers, net, and Trading container margin              4)     Combined total of Trading containers and Containers held for sale                              24
Financial Performance Trends
$ (in 000's)                                                                                           Total revenues                                                               TEUs

$200,000                                                                                                                                                                          4,500,000
$180,000                                                                                                                                                                          4,300,000
$160,000                                                                                                                                                                          4,100,000   Other (Gain on sale,
$140,000                                                                                                                                                                          3,900,000   trading margin and
                                                                                                                                                                                              management fees)
$120,000                                                                                                                                                                          3,700,000
                                                                                                                                                                                              Rental income ‐
$100,000                                                                                                                                                                          3,500,000   managed
 $80,000                                                                                                                                                                          3,300,000
 $60,000                                                                                                                                                                          3,100,000   Rental income ‐owned
 $40,000                                                                                                                                                                          2,900,000
 $20,000                                                                                                                                                                          2,700,000
                                                                                                                                                                                              Fleet Size in TEU
        $0                                                                                                                                                                        2,500,000
               2Q15

                      3Q15

                             4Q15

                                    1Q16

                                           2Q16

                                                  3Q16

                                                         4Q16

                                                                1Q17

                                                                       2Q17

                                                                              3Q17

                                                                                     4Q17

                                                                                             1Q18

                                                                                                     2Q18

                                                                                                            3Q18

                                                                                                                   4Q18

                                                                                                                          1Q19

                                                                                                                                 2Q19

                                                                                                                                        3Q19

                                                                                                                                               4Q19

                                                                                                                                                      1Q20

                                                                                                                                                             2Q20

                                                                                                                                                                    3Q20

                                                                                                                                                                           4Q20
$ (in 000s)                                                                                 Adjusted EBITDA and net income
$190,000                                                                                                                                                                          100%
                                                                                                                                                                                  90%
$140,000                                                                                                                                                                          80%
                                                                                                                                                                                  70%
                                                                                                                                                                                               Adj. EBITDA
 $90,000                                                                                                                                                                          60%
                                                                                                                                                                                  50%          Adj. Net income
 $40,000                                                                                                                                                                          40%
                                                                                                                                                                                  30%          Adj. EBITDA % Total
                                                                                                                                                                                               revenues
$(10,000)                                                                                                                                                                         20%
                              Hanjin
                             default                                                                                                                                              10%
$(60,000)                                                                                                                                                                         0%
               2Q15

                      3Q15

                             4Q15

                                    1Q16

                                           2Q16

                                                  3Q16

                                                         4Q16

                                                                1Q17

                                                                       2Q17

                                                                              3Q17

                                                                                     4Q17

                                                                                              1Q18

                                                                                                     2Q18

                                                                                                            3Q18

                                                                                                                   4Q18

                                                                                                                          1Q19

                                                                                                                                 2Q19

                                                                                                                                        3Q19

                                                                                                                                               4Q19

                                                                                                                                                      1Q20

                                                                                                                                                             2Q20

                                                                                                                                                                    3Q20

                                                                                                                                                                           4Q20

                                                                                                                                                                                                                     25
Conclusion
   Significantly improved financial performance and outlook,
    with improved revenues, EBITDA, and profits.
   Lease‐outs of 300KTEU in 4Q20 and high utilization rate
    over 99% will secure long‐term benefits and provide
    earnings momentum into 2021
   Continued commitment to a balanced capital allocation,
    with $1,080M of capex and $68M of share buybacks in
    2020
   Strong balance sheet with $205M in cash and ample
    available borrowing capacity in our facilities
   Favorable market environment expected to continue
    through most of 2021, driven by improved containerized
    trade volumes and container shortages
   Improved profitability of our customers and strong
    payment performance is expected to continue in 2021
   Capex in excess of $925M ordered for 1H21, essentially all
    pre‐committed
   We remain focused on improving profitability and
    maintaining a strong balance sheet to better serve our
    customers and take advantage of future opportunities

                                                                 26
Appendix
Reconciliation of GAAP to Non‐GAAP Items
                                                                                                    Thre e Months Ende d,                                              Ye ars Ende d,
                                                                           De ce mbe r 31, 2020      Se pte mbe r 30, 2020   De ce mbe r 31, 2019    De ce mbe r 31, 2020       De ce mbe r 31, 2019
                                                                                             (Dollars in thousands) - Unaudite d                            (Dollars in thousands) - Unaudite d

Reconciliation of adjusted net income:
Net income attributable to common shareholders                             $            44,260      $            16,952      $            28,782     $           72,822       $                56,724
Adjustments:
Write-off of unamortized deferred debt issuance costs and bond discounts                    —                     8,628                       —                   8,750                            —
Unrealized (gain) loss on derivative instruments, net                                   (3,390)                  (4,161)                   (2,873)                6,044                        15,442
Gain on insurance recovery and legal settlement                                             —                        —                    (14,040)                   —                        (14,881)
Gain on settlement of pre-existing management agreement                                     —                        —                     (1,823)                   —                         (1,823)
Impact of reconciling items on income tax                                                   37                      (42)                     551                   (142)                          378
Impact of reconciling items attributable to the noncontrolling interest                    240                      257                      380                   (197)                         (465)
Adjusted net income                                                        $            41,147      $            21,634      $            10,977     $           87,277       $                55,375

Reconciliation of adjusted EBITDA:
Net income attributable to common shareholders                             $            44,260      $            16,952      $            28,782     $           72,822       $                56,724
Adjustments:
Interest income                                                                            (52)                     (23)                     (458)                 (531)                       (2,505)
Interest expense                                                                        27,973                   29,123                   37,486                123,230                       153,185
Write-off of unamortized deferred debt issuance costs and bond discounts                    —                     8,628                       —                   8,750                            —
Realized loss (gain) on derivative instruments, net                                      3,395                    4,107                      763                 12,295                        (1,946)
Unrealized (gain) loss on derivative instruments, net                                   (3,390)                  (4,161)                   (2,873)                6,044                        15,442
Gain on insurance recovery and legal settlement                                             —                        —                    (14,040)                   —                        (14,881)
Gain on settlement of pre-existing management agreement                                     —                        —                     (1,823)                   —                         (1,823)
Income tax (benefit) expense                                                              (463)                    (152)                     478                   (374)                        1,948
Net income (loss) attributable to the noncontrolling interest                              778                      494                      407                    851                          (168)
Depreciation expense                                                                    65,609                   65,374                   66,129                261,665                       260,372
Container (recovery) write-off from lessee default, net                                   (122)                      33                        25                 (1,647)                       7,179
Amortization expense                                                                       806                      645                      517                  2,572                         2,093
Impact of reconciling items attributable to the noncontrolling interest                 (1,960)                  (2,060)                   (2,206)                (9,467)                     (11,305)
Adjusted EBITDA                                                            $           136,834      $           118,960      $           113,187     $          476,210       $               464,315

                                                                                                                                                                                                         28
29
You can also read