Assessment and Remediation of Vapor Intrusion to Indoor Air, South Mesa State Superfund Site in Gilbert, Arizona
←
→
Page content transcription
If your browser does not render page correctly, please read the page content below
2203A Commerce Rd, Suite 1
                                                                                                                Forest Hill, Maryland 21050, USA
                                                                                                                1-410-838-8780
                                                                                                                800-878-5510 Toll Free

                                                                   Proceedings of the Sixth International Battelle Conference:
   TECHNICAL MEMORANDUM                                            Remediation of Chlorinated and Recalcitrant Compounds
                                                                   Monterey, California May 19-22, 2008

Assessment and Remediation of Vapor
Intrusion to Indoor Air, South Mesa State
Superfund Site in Gilbert, Arizona
James N. Clarke, R.G, MACTEC Engineering and Consulting, Phoenix, Arizona, Harry O’Neill, Beacon
Environmental, Bel Air, Maryland Joseph E. Odencrantz, Ph.D., P.E., Beacon Environmental Services, Inc.,
Newport Beach, California

Abstract                                                                      Introduction
Vapor intrusion to indoor air from volatile organic                           Site Description
compound (VOC) contamination in the subsurface
is increasingly becoming a more important                                     The subject site is a former metal plating facility
exposure pathway when developing site conceptual                              located within the boundaries of the South Mesa
models and ultimately obtaining site closure. Until                           Water Quality Assurance Revolving Fund (Arizona
recently, this exposure pathway was not often                                 State Superfund) Registry Site (SMWRS). In 1983,
considered during site characterization. The direct                           PCE was detected in an irrigation well located
measurement of the vapor intrusion to indoor air                              approximately 500 ft (152 m) downgradient of the
pathway is typically difficult to perform due to                              site and was immediately taken off-line, though
sample collection methods and interferences to                                it was periodically sampled. Operated as
samples such as ambient air. In order to perform                              a containment pump-and treat well from 1994
valid measurements, a thorough understanding                                  to 1997, after which the well was permanently
of the site and use of multiple characterization                              taken off-line. In 1985, a sample collected from the
tools are necessary. A cost effective three-phase                             irrigation well contained 780 ug/L of PCE. A second
approach to assess the vapor intrusion to indoor                              irrigation well, located approximately 1.5 mi (2.4 km)
air pathway at the South Mesa Water Quality                                   downgradient of the site, also had                  detections
Assurance Fund (Arizona State Superfund or                                    of PCE. Preliminary investigation, involving
WQARF) Registry site in Gilbert, Arizona was                                  sampling of production wells and the installation
implemented.                                                                  of 10 monitoring wells, identified an approximate
                                                                              1.5 mi long (2.4 km) by 0.5 mi (0.8 km) wide
                                                                              PCE groundwater plume apparently originating
                                                                              from the subject site (Figure 1 next page).

©2020 Beacon Environmental Service, Inc. Beacon Environmental is ISO/IEC 17025, DoD ELAP and NELAP accredited
for the analysis of sorbent samples following US EPA Methods TO-17, TO-15, 8260C and 325B.
                                                                                                                                               1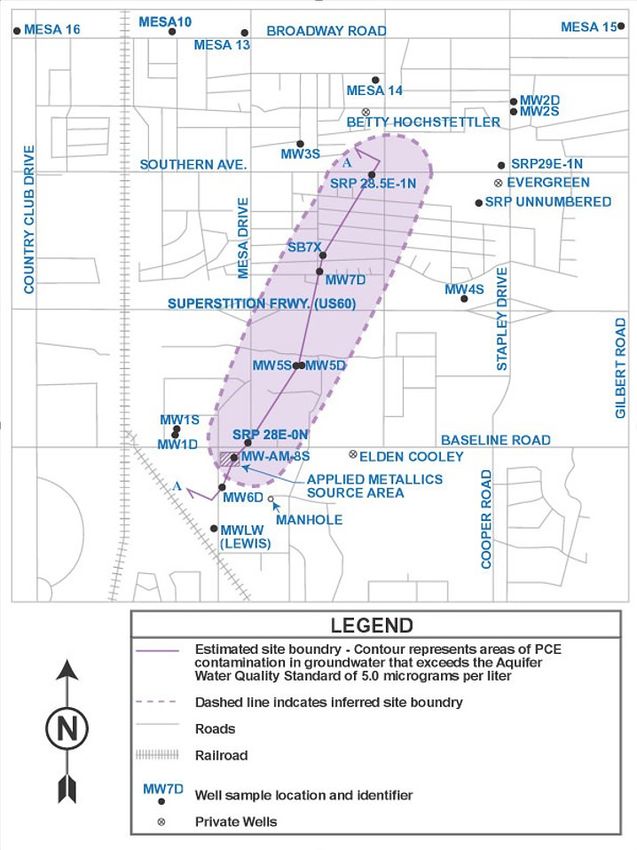
Figure 1 – Subject Site

©2020 Beacon Environmental Service, Inc. Beacon Environmental is ISO/IEC 17025, DoD ELAP and NELAP accredited
for the analysis of sorbent samples following US EPA Methods TO-17, TO-15, 8260C and 325B.
                                                                                                                2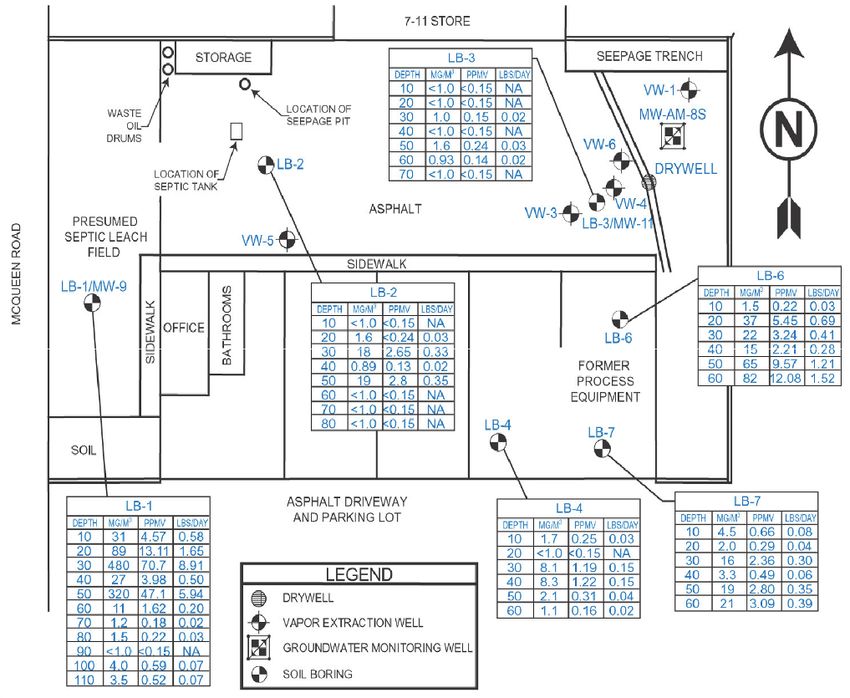
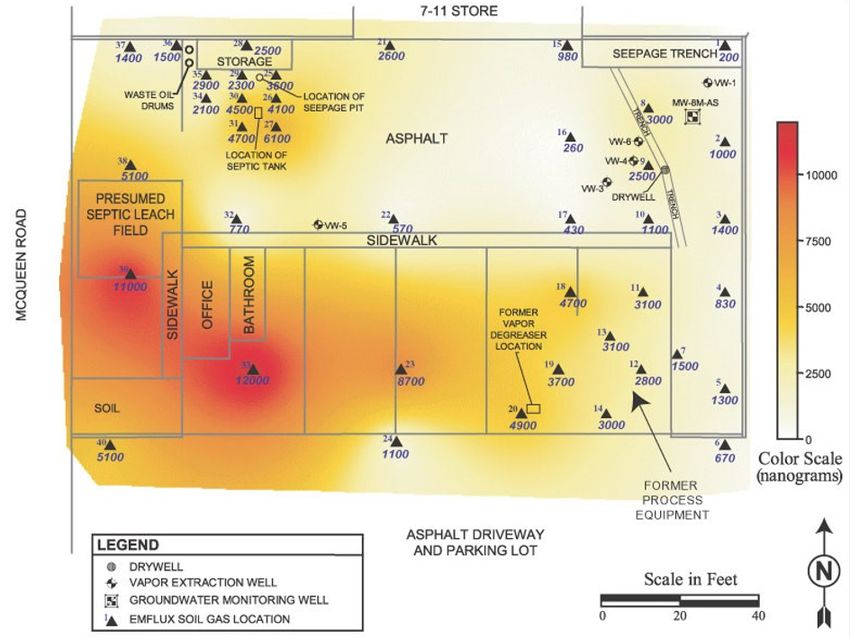
Figure 2 – Site Plan

Figure 2 shows a site plan of the former metal                                removal activities were focused on the injection
plating facility. PCE and metal wastes were                                   well and approximately 1,100 lbs (500 kg) of
discharged to an on-site injection well from                                  volatile organic compounds (VOCs) were removed
approximately 1979-1988. Other possible sources                               by Soil Vapor Extraction (SVE) from 1995-1997.
of contamination were a septic system and leakage
from processing equipment. While the metal
plating facility was in operation, groundwater
                                                                              Vapor Intrusion
was as deep as 200 ft (61 m) bgs. However, due                                Assessment Methods
to decreased groundwater usage in the area,
the water table has risen to its current level of                             A remedial investigation (RI) and early response
approximately 115 ft (35 m) bgs-a rise of 85 ft (26                           action (ERA) of the SMWRS for the Arizona
m). On-site monitor well (MW-AM-8S) installed                                 Department of Environmental Quality (ADEQ)
in 1991 to a depth of 165 ft (50 m) contained PCE                             was completed in 200?. As part of the RI, vapor
concentrations ranging from 10 ug/L to 300 ug/L.                              intrusion to indoor air was assessed. The lithology
Monitor well MW7D, located approximately one-                                 (adundance of cobbles ) below the site prevented
mile down-gradient of the site, has consistently                              the use of lower cost characterization tools,
contained PCE concentrations ranging from 8                                   such as direct-push technologies. Therefore, an
ug/L to 60 ug/L since the time of its installation                            innovative approach was utilized to minimize the
in 1991. Previous site investigation and source                               number of borings and costs. The vapor intrusion

©2020 Beacon Environmental Service, Inc. Beacon Environmental is ISO/IEC 17025, DoD ELAP and NELAP accredited
for the analysis of sorbent samples following US EPA Methods TO-17, TO-15, 8260C and 325B.
                                                                                                                                    3
assessment involved five phases as follows: 1)                                Deep Borings
surface geophysical survey; 2) passive soil vapor
survey; 3) collection of discreet soil and soil gas                           The PCE results for the passive soil vapor survey are
samples from deep borings; 4) collection of                                   shown on Figure 5. Based on the passive soil vapor
discrete soil and soil gas samples from shallow                               survey results, deep soil borings LB-1 (southwest
borings; and, 5) collection of indoor air quality                             corner), LB-2 (septic tank), and LB-3 (injection
(IAQ) samples. The objectives of the vapor intrusion                          well) were drilled from August 20, 2001 through
assessment are listed as follows: 1) identify potential                       August 31, 2001. The borings were intended to
source areas; 2) characterize the vadose zone                                 evaluate the extent of VOC impact within the UAU.
below the site; 3) obtain vertical contaminant                                Therefore, the maximum drilling depth was 240
profiles; 4) confirm operation of the SVE system;                             ft (73 m) bgs. The borings were drilled using an
5) evaluate potential health risks associated                                 AP-1000 dual-wall percussion drill rig. In order to

with vapor intrusion; and, 6) minimize costs.                                 obtain vertical contaminant profiles, discrete soil
                                                                              and soil vapor samples were collected using the
                                                                              Maxisimulprobe (MSP) system. The MSP system
Geophysical Survey
                                                                              allows the collection of discrete soil and soil
                                                                              vapor samples or discrete soil and groundwater
A surface geophysical survey consisting of a
                                                                              samples in one tool, that are analyzed on-site. The
combination of electromagnetics and ground
                                                                              sampling depths are shown on Figures 6 and 7.
penetrating radar (GPR) was performed on
                                                                              The selected sampling depths were based on the
May 14, 2001 to identify the location of an on-
                                                                              lithology of the site. All samples were submitted
site septic tank and associated leach pit.
                                                                              to an on-site mobile laboratory and PCE, TCE, and
                                                                              1,2-DCE using EPA Method 8021 were reported.
Passive Soil Vapor Survey
                                                                              The mobile laboratory was used to obtain rapid
                                                                              analytical results, thus minimizing drilling delays.
Based on the results of the geophysical survey
                                                                              The mobile laboratory typically provided analytical
and a review of historic site plans, a passive
                                                                              results within 30 minutes of sample collection.
soil vapor survey using Passive Soil Gas (PSG)
samplers provided by Beacon Environmental
                                                                              Shallow Borings
Services, Inc. (Beacon) was performed to obtain
a surficial representation of the subsurface PCE
                                                                              Borings LB-4, LB-6 and LB-7 were drilled from
contamination. The passive soil gas survey was                                September 11, 2001 through September 13, 2001.
performed from May 24, 2001 through May 31,                                   The locations are shown on Figure 4. These
2001. A survey grid consisting of 40 sample points                            borings were intended to evaluate the vadose
was designed (Figure 4), with the sample points                               zone impact below the former process equipment
concentrated around the former injection well, at                             area. The borings were drilled inside the structure.
the former process equipment area, and at the                                 Therefore, the drilling method was limited to low-
septic tank. The PSG sampler, which consists of                               profile hollow-stem auger. Very dense cobbles
sorbent materials, was installed approximately 8 in                           and gravels are present at approximately 62 ft (19
(20 cm) bgs for 72 hours. The results were time-                              m). Therefore, drilling and sampling was limited
weighted and spatially variable soil gas masses                               to 60 ft (18.3 m) bgs. During drilling, discrete soil
that took into account soil vapor concentration                               and soil gas samples were collected at 10-ft (3
changes and other vapor transport processes.                                  m) intervals using the Maxisimulprobe system.

©2020 Beacon Environmental Service, Inc. Beacon Environmental is ISO/IEC 17025, DoD ELAP and NELAP accredited
for the analysis of sorbent samples following US EPA Methods TO-17, TO-15, 8260C and 325B.
                                                                                                                                      4
Indoor Air Quality Sampling                                                   locations are shown on Figure 3. The IAQ sampling
                                                                              involved the placement of summa-canisters at
The results of the passive soil vapor survey and                              six locations within the building. Sample 7 was
subsurface investigation indicated a PCE soil                                 collected outdoors as an ambient air sample. The
vapor plume was present beneath the building.                                 summa canisters were under vacuum and regulator
Therefore, vapor intrusion to indoor air was                                  was set to collect an eight hour draw sample.
considered a potential exposure pathway at the                                The samples were analyzed for VOCs using EPA
site. ADEQ approved the use of indoor air quality                             Method TO-15. Samples 1 through 3 collected on
(IAQ) sampling to evaluate vapor intrusion into                               June 27, 2002 were collected in an office suite that
the site building. Two rounds of vapor sampling                               was vacant. During the interim, the vacant space
were performed; the first on June 27, 2002 and                                became a sales business (Suite 1) and was operating
the second on December 17, 2002. The IAQ sample                               as such on the December 17, 2002 sampling event.

                                     Figure 3 – IAQ Sample Locations

©2020 Beacon Environmental Service, Inc. Beacon Environmental is ISO/IEC 17025, DoD ELAP and NELAP accredited
for the analysis of sorbent samples following US EPA Methods TO-17, TO-15, 8260C and 325B.
                                                                                                                                     5
Vapor Intrusion PCE in the soil gas. PCE concentrations ranged from
200 ng to 12,000 ng, with a mean concentration
Assessment Results
of 3,078 ng. The PSG samplers located in the
Passive Soil Vapor Survey southwest corner of the site showed the highest
PCE masses, which indicated a possible PCE vapor
The PCE results for the passive soil gas survey are plume beneath the west side of the building and
shown on Figure 4, which is a concentration isopleth directly below Suite 1.
map that illustrates the spatially varying mass of
Figure 4 – PCE Passive Soil Vapor Survey Results
©2020 Beacon Environmental Service, Inc. Beacon Environmental is ISO/IEC 17025, DoD ELAP and NELAP accredited
for the analysis of sorbent samples following US EPA Methods TO-17, TO-15, 8260C and 325B.
6Soil Gas and Soil Samples However, the discrete soil gas samples contained
relatively high concentrations of PCE, particularly
The discrete soil gas samples were analyzed the samples collected from borings LB-1 and LB-6
for PCE, TCE, and 1,2-DCE and the soil samples (Figure 6). The samples collected between 30
were analyzed for VOCs, arsenic, total chromium, and 50 ft (9-15 m) bgs, which is a predominantly
hexavalent chromium, copper, cyanide, nickel sandy interval, contained the highest PCE
and zinc. The discrete soil samples contained concentrations. PCE mass removal rates assuming a
non-detectable concentrations of VOCs and soil vapor extraction flow rate of 200 scfm, are also
concentrations of metals and cyanide that were shown on Figure 5.
below the Arizona minimum soil cleanup levels.
Figure 4 – PCE Soil Gas Concentration with Depth
©2020 Beacon Environmental Service, Inc. Beacon Environmental is ISO/IEC 17025, DoD ELAP and NELAP accredited
for the analysis of sorbent samples following US EPA Methods TO-17, TO-15, 8260C and 325B.
7PCEa TCEb
Sample Combined
Location Date
No. CILCRd
ppbv ug/m3 CILCRc ppbv ug/m3 CILCRc
6/27/02 20 135.6 9E-07 0.97 5.21 1E-06 2E-06
Suite 1
1
Floor 12/17/02 13 88.14 6E-07 1.2 6.44 2E-06 3E-06
6/27/02 57 386 3E-06 0.94 5.05 1E-06 4E-06
2
Suite 1 12/17/02 180 1220.4 9E-06 4.0 21.48 6E-06 2E-05
Office
IAQ-1 11/21/07 0.85 5.9 4E-08Though the individual and combined ILCRs for PCE Conclusions
and TCE did not exceed the acceptable exposure
standard of 1x10⁻⁴, because the combined ILCR The passive soil vapor survey proved to be a cost
exceeded 1x10⁻⁶, ADEQ decided to proceed with effective, rapid and accurate method to delineate
an early response action (ERA) to remove the the areal extent of the vadose zone impact and
source of the vapor intrusion to the Suite 1 office. identifying possible source areas. The passive soil
vapor survey also indicated the area of the site
Remedial Activites where vapor intrusion was a potential exposure
pathway. The follow-up depth-specific soil gas
In July 2004, a nested vapor extraction well and IAQ sampling programs confirmed the results
was installed in the southwest corner of the of the passive soil vapor survey. The operation of
site, identified as VW-7 on Figures 2 and 3. The the SVE system as an ERA successfully reduced
approximately radius of influence (ROI) for a vapor the PCE and TCE concentrations in the Suite 1
well at the site was determined to be approximately office to below the established cleanup goal.
60 ft (18m). Therefore, VW-7 was installed at a
location where the ROIs for VW-5 and VW-7 would References
overlap beneath the building. VW-5 and VW-7 were
connected to the existing SVE system located in USEPA, 1990, National Oil and Hazardous
the eastern portion of the site. The SVE system Substances Pollution Contingency Plan, 40 CFR
was started in September 2004. The remedial goal Part 300; Federal Register, Volume 55, No. 46, pp.
was to reduce PCE and TCE concentrations in the 8666-8865, Washington, DC, Thursday, March 8.
Suite 1 office to an ICLR less than 1x10⁻⁶. Influent
PCE concentrations at the start of operation USEPA, 2004. Region 9 Preliminary Remediation
in September 2004 were 310,000 micrograms Goals (PRGs) 2004, December 28, 2004.
per cubic meter (ug/m ). SVE system operation
3
continued to August 2007 when asymptotic vapor
concentrations between 950 ug/m3 and 1,100 ug/
m3 had been achieved. On November 21, 2007, an
IAQ sample identified as IAQ-1 on Figure 3 and
on Table 1 was collected from the Suite 1 office.
As shown in Table 1, the PCE concentrations
in the Suite 1 office was reduced to 5.9 ug/m3
from a high of 1,220.4 ug/m3 on December 17,
2002. TCE was not detected in the November
21, 2007 sample. The combined ILCR is 4x10⁻⁸,
which is less than the 1x10⁻⁶. Therefore, ADEQ
subsequently approved completion of the ERA.
©2020 Beacon Environmental Service, Inc. Beacon Environmental is ISO/IEC 17025, DoD ELAP and NELAP accredited
for the analysis of sorbent samples following US EPA Methods TO-17, TO-15, 8260C and 325B.
9You can also read