ASSESSMENT OF EVS IN TNC FLEETS - EV Shared Mobility
←
→
Page content transcription
If your browser does not render page correctly, please read the page content below
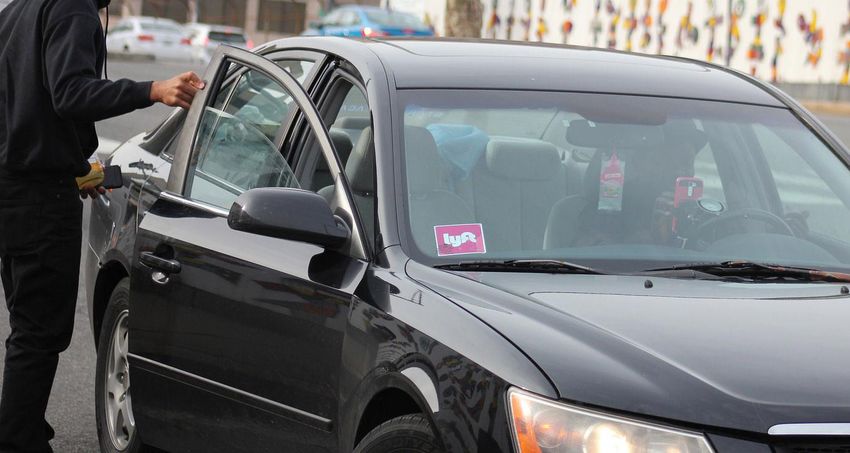
This Photo by Unknown Author is licensed under CC BY-SA

ASSESSMENT OF EVS IN TNC
FLEETS
Making the Business Case for Smart, Shared, and Sustainable Mobility Services
By Conner Smith and Kim Latham

SEPTEMBER 2020, VERSION 1.0

                                                                                     ATLAS PUBLIC POLICY
                                                                                     WASHINGTON, DC USA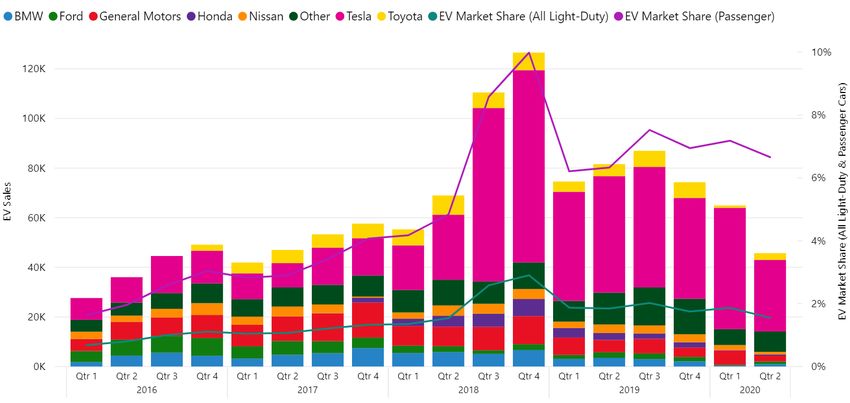
ASSESSMENT OF EVS IN TNC FLEETS

The U.S. Department of Energy-funded Making the Case for Smart, Shared, and Sustainable Mobility
Services project seeks to identify effective pathways to accelerate the electrification of shared mobility
services. The project, led by the City of Seattle and Atlas Public Policy, brings together the U.S.
Department of Energy and major industry stakeholders with the cities of Seattle, New York, Portland,
and Denver to test different electric shared mobility interventions.

Project teams in each city are focusing on market interventions, namely installing direct current (DC)
fast charging stations, assessing current electric vehicle (EV) usage among shared mobility services,
and conducting targeted outreach with shared mobility drivers to analyze electric vehicle (EV)
adoption and electric miles traveled by carshare and ride-hail services. This assessment examines the
number of EVs in Transportation Network Company (TNC) fleets within each of the participating cities
of the EV Shared Mobility project and highlights the change and make-up of their fleet from January
2019 through June 2020.

OVERVIEW OF THE NATIONAL EV MARKET

The national EV market has experienced significant growth over the past three years and sales reached an
all-time high in 2018 with sales volumes 81 percent greater than 2017 [1]. Sales were down 12 percent in
2019, primarily due to a drop-off in sales of the Tesla Model 3 after the end of Tesla’s eligibility for the
federal EV tax credit. In 2020, the entire auto sector has been hit hard by the COVID-19 pandemic and
sales have fallen due to manufacturing shutdowns and depressed consumer demand for vehicles. As a
result, EV sales have fallen by 29 percent through the first half of 2020 while the auto sector overall saw a
24 percent drop [2]. The EV market sales declines as a result of COVID-19 mirror that of the economic
downturn seen throughout the entire U.S. economy during the first two quarters of 2020, where social
distancing measures and shelter-in-place orders limited manufacturing capacity across all sectors of the
economy and led to a loss of more than 20 million jobs [3].
Despite this deceleration in the EV market, declining battery costs and investment commitments from
automakers are expected to help boost sales figures in the near term [4]. Woods Mackenzie only reduced
their projections for global EV market growth by two percent as a result of the pandemic and the analyst
group still expects the number of global EVs to increase by a factor of 35 through 2040 [5].
The U.S. EV market has been dominated by Tesla, which has accounted for 57 percent of the national EV
sales between 2018 and June 2020. While Tesla dominates sales, other automakers such as General
Motors, Volkswagen, and Hyundai are bringing new EV models to market and expanding their
transportation electrification plans [6]. Overall, the number of EV models offered in the United States has
increased from 31 in 2016 to 52 as of August 2020 [7]. More than 30 new models are expected in 2021 as
automakers enter the next phase of EV rollout [8]. Figure 1 shows a breakdown of U.S. passenger EV sales
over time.

ATLAS PUBLIC POLICY                                                                                         2
ASSESSMENT OF EVS IN TNC FLEETS

                   FIGURE 1: NATIONAL EV SALES FROM 2016 THROUGH JUNE 2020

This chart shows the growth in the national EV market. EV sales grew significantly in 2018 then declined in 2019 and
2020.
Source: [7]

ELECTRIFICATION EFFORTS IN THE TNC MARKET

 What Are TNCs?
 Transportation Network Companies (TNCs) are shared mobility providers that use websites and apps to
 connect riders with drivers. This is commonly referred to as a ride-hail service. TNC activity has expanded
 throughout cities the United States since the initial introduction of Uber and Lyft in 2010 and 2012,
 respectively in San Francisco, CA. Although 2020 saw ridership decline due to COVID-19, TNCs continue to
 operate but with fewer rides and more health and safety restrictions.

UBER
According to an April 2019 snapshot by Second Measure, “Uber accounted for 69 percent of U.S.
rideshare spending, and Lyft captured 29 percent of the market” [9]. Following Lyft’s commitment in June
2020, Uber committed in September to electrifying all rides in the United States by 2030 and globally by
2040. Uber will begin by offering Uber Green, which allows riders to pay $1 extra to request an EV, in 65
cities including 15 in the United States by the end of 2020 [10]. Before this pledge, Uber experimented
with a variety of programs to encourage electrification including the EV Champions Initiative, which was
launched in 2017. Uber has worked to expand the effort in partnership with organizations, including Forth
in Portland, to raise driver awareness and provide resources to help drivers learn more about the benefits

ATLAS PUBLIC POLICY                                                                                                3
ASSESSMENT OF EVS IN TNC FLEETS of EVs. In 2018, Uber expanded the initiative to seven cities—Austin, Los Angeles, Montreal, Sacramento, San Diego, San Francisco, and Seattle—and informed early awareness campaigns of the EV Shared Mobility project in Portland. The program was set to last through 2019, although according to EV media outlet Electrek, it ended with no announcement from Uber [11]. In the context of their commitment to electrify the platform by 2030, Uber has pledged to offer $800 million to drivers to help encourage EV adoption. Through the program, drivers in Europe and the United States will receive an extra $1.50 for every ride provided in an EV [12]. LYFT Lyft is the second largest ride-hail company in the United States. The company has seen significant growth over the last four years, accounting for 29 percent of the national market and doubling the revenue growth of Uber in 2017 and 2018 [9]. Lyft made headline news in June 2020 when the company announced a new commitment to electrify all vehicles on their platform by 2030 [13]. The company also announced in November 2019 their largest deployment of EVs to date with the provision of 200 EVs, all Kia Niros, through their Express Drive car rental service in Denver [14]. The company has also added EV offerings to their Express Drive car rental service in both Seattle and Atlanta [15]. OTHER TNC COMPANIES Companies including Via and Gett account for the remaining two percent of the ride-hail market in the United States. Gett, the parent company to Juno, a popular ride-hail service in New York City, announced its exit from the New York market in November 2019, but ensured its corporate clients had access to rides through a strategic partnership with Lyft [16]. Gett also announced displeasure with ride-hail regulations in New York City as one of the reasons for folding [17]. Via operates in Chicago, Washington, DC, and New York. Juno and Via both delivered roughly one million rides a month in New York when both companies were still operational [18]. These companies have not announced significant electrification targets as of June 2020, although Gett is now partnered with Lyft who has committed to 100 percent electrification by 2030. SEATTLE Seattle is leveraging initiatives included in the EV Shared Mobility project as well as separate programs to advance transportation electrification in the region. Between 2017 and 2018, the City’s electrification efforts were organized under Drive Clean Seattle, which was launched in 2017 to help meet the City’s goal of electrifying 30 percent of all vehicles by 2030 [19]. This program also called for municipal fleet electrification, electric utility investment in charging infrastructure, and increased public-private partnerships to accelerate transportation electrification. Drive Clean Seattle, led by the Office of Sustainability & Environment, brought together various City Departments including the Seattle Department of Transportation and Seattle City Light (“City Light”), to help achieve the City’s electrification and climate goals [20]. Within the EV Shared Mobility project, Seattle is focusing on charging infrastructure deployment and EV outreach to ride-hail drivers. City Light continues to lead charging station deployment and is committed to installing 20 DC fast charging stations for this project. The City developed the EVSE Roadmap for Shared Mobility Hubs to provide guidance for charging station deployment. The roadmap draws on the city’s EVSE Dynamic Siting Tool which considers 11 metrics for ATLAS PUBLIC POLICY 4
ASSESSMENT OF EVS IN TNC FLEETS

site assessment, drawing on feedback provided by TNC drivers and other stakeholders to create an overall
prioritization score [21]. The tool also includes Equity and Environmental Justice as one of its
considerations to help guide equitable EVSE deployments [22].
This analysis uses data from a Vehicle Safety Inspection Database housing annual for-hire driver safety
inspections collected under a City/County interlocal agreement [23]. Resulting data includes vehicles
inspected that were registered as TNC ride-hail drivers in King County, which contains the City of Seattle.
EV counts reported for Seattle’s Fleet Inventory reflect the date a vehicle was inspected and is not the
date a driver became registered. The vehicle data from the inspection database is being used as a proxy
for the number of ride-hail drivers who drive EVs in Seattle.
In 2019, King County had 996 EVs pass through inspection that were registered in the ride-hail fleet. This
is a 38 percent increase from the 612 ride-hail EVs that passed through inspection in in 2018. Since 2015,
the first year where a full dataset is available, King County has seen a steady yearly increase of EVs in their
ride-hail fleet. For 2020 however, only 189 ride-hail EVs are reported because the data was only available
through May 2020, and the COVID-19 pandemic led to reduced ridership and thus fewer ride-hail drivers.
Figure 2 shows 2014 - 2020 ride-hail EV registrations by vehicle inspection year in King County.

   FIGURE 2: 2014 – 2020 RIDE-HAIL EV REGISTRATIONS BY VEHICLE INSPECTION YEAR IN KING
                                         COUNTY

                                  1200
                                                                                              996
    Ride-Hail Electric Vehicles

                                  1000

                                  800
                                                                               612
                                  600                                   506
                                  400
                                                         225                                                189
                                  200           110
                                          1
                                     0
                                         2014   2015    2016            2017   2018          2019          2020

This figure shows the date of inspection for all identified EVs in the Vehicle Safety Inspection Database that are
registered ride-hail drivers, summarized annually from 2014 through 2020. Data is incomplete for 2020.
Source: Atlas Public Policy analysis of data from the City of Seattle

In the 2019 inspections, 90 percent of the 996 ride-hail EVs were either a Tesla, Ford, Toyota, Chevrolet, or
Kia. The top three leading make and model of EVs found in the 2019 inspection data were the Tesla Model
3 with 169 registered to ride-hail drivers, the Toyota Prius Plug In with 148 registrations, and the Chevy
Bolt with 111 registrations. The significant presence of non-Tesla EVs in the ride-hail fleet indicates the
growth potential of the ride-hail EV sector as new models are brought to market.
Over the entire period for which there is data, there have been the most registrations for the Toyota Prius
Plug Ins, with 506 vehicles having been inspected for the King County ride-hail fleet.

ATLAS PUBLIC POLICY                                                                                                  5
ASSESSMENT OF EVS IN TNC FLEETS
It is important to note that these ride-hail fleet figures capture the date of a vehicle inspection for a
registered ride-hail vehicle. It does not indicate the length of time for which a vehicle acted as a ride-hail
vehicle or how often a vehicle was used in a ride-hail capacity. Figure 3 provides a breakdown of
registered ride-hail EVs by automaker that were inspected in 2019.
FIGURE 3: AUTOMAKER OF EVS REGISTERED AS KING COUNTY RIDE-HAIL DRIVERS, INSPECTED IN
2019
300 281
250
Number of EVs
200 173
162
150 141
100 72 64
50 33
19 17 13 12 5 2 1 1
0
This chart shows EVs by automaker, inspected in 2019 that were ride-hail drivers in King County. Tesla led with 17
percent of the registrations.
Source: Atlas Public Policy analysis of data from the City of Seattle
Across the County, there are 32,353 EVs registered through August 2020. Based on 2019 registration
numbers, ride-hail EVs make up only three percent of all EVs in King County. EV deployment in Seattle is
supported by increasing charging station availability. The city had 221 DC fast charging stations and 1,778
Level 2 charging stations deployed through August 2020 [24].
PORTLAND
As the only non-government regional project lead in the EV Shared Mobility project, Forth Mobility is
bringing their expertise in education and outreach campaigns to support and design electrification
initiatives in the Portland, Oregon region. Forth is leveraging existing policies including passenger EV
rebates at the state level through the Oregon Clean Vehicle Rebate Program to accelerate their work. The
ATLAS PUBLIC POLICY 6ASSESSMENT OF EVS IN TNC FLEETS state is offering low-income to moderate-income drivers a $2,500 cash rebate on top of the $2,500 standard rebate currently available to all drivers as a part of the Clean Vehicle Rebate Program. [25]. The rebate program is also available to drivers interested in leasing or purchasing used EVs. The City of Portland has also implemented a Climate Action Plan that adopts and expands upon state goals to increase the average fuel economy of all passenger vehicles to 40 miles per gallon by 2030 [26]. Within the EV Shared Mobility project, Forth has been working with local financial institutions to develop a Fair Financing Pilot program to provide ride-hail drivers with increased access to financing to purchase EVs. In addition to this, Forth has designed and implemented EV awareness campaigns throughout the region. These campaigns have supported the rollout of DC fast charging stations by the electric utility Portland General Electric (PGE) and Lyft targeting ride-hail drivers. The program encourages drivers to take advantage of unlimited off-peak charging through a membership-based program which Lyft pays for [27]. Forth has also worked with TNCs like Uber and Lyft to support electrification programs in the region. Portland was one of the first cities selected for Uber’s EV Champion’s Initiative where Forth was a primary partner coordinating driver and rider education. Uber’s EV initiatives have been completed in Portland and informed the expansion of these programs to seven other cities in the United States and Canada [28]. This also served as the foundation for the company’s recent commitments to electrify all vehicles in the United States by 2030 [12]. Uber estimated that there were only 42 ride-hail EVs in the Portland area in at the end of 2018, a figure which represented less than 5 percent of Uber’s active user base [27]. Unlike Seattle and New York, Forth does not have access to TNC EV registration data and instead relies on charging session data from PGE and Lyft to approximate ride-hail EV adoption in Portland. In July 2019 Lyft began its subscription service with PGE’s Electric Avenue charging network to provide free charging sessions for their EV drivers. Data collected through this partnership is shown in Figure 4 and is used as a measure for EV adoption among TNC drivers in Portland [29]. After the first month of operation in August 2019, 32 unique Lyft subscribers used PGE’s Electric Avenue charging stations. This number was slightly lower the Uber’s reported 42 EV drivers in the city as of late 2018. In February 2020, there were 82 unique Lyft users charging their EVs at PGE’s Electric Avenue charging stations, showing EV adoption by Lyft subscribers doubling within the first six months of the Lyft and PGE partnership. Figure 4 shows the number unique subscribers accessing PGE’s Electric Avenue charging network on a monthly basis. The number of EV drivers charging their vehicles at these stations dropped significantly in April 2020 to 30 unique subscribers. This drop in charging network usage coincided with Oregon’s COVID-19 shelter-in-place and social distancing orders, which asked all community members, drivers and riders alike, to stay home and cutout all nonessential travel [30]. ATLAS PUBLIC POLICY 7
ASSESSMENT OF EVS IN TNC FLEETS

FIGURE 4: UNIQUE NUMBER OF LYFT SUBSCRIBERS TO PGE CHARGING NETWORK BY MONTH

                                90                                     82       81
                                80                       73
   Number of Lyft Subscribers

                                                              71
                                70
                                60                  56
                                               49
                                50
                                40   32                                                                    32
                                          29                                             30       28
                                30
                                20
                                10
                                 0

This chart shows the number of unique Lyft subscribers to PGE’s Electric Avenue charging network in Portland,
Oregon.
Source: EV Shared Mobility Dashboard [24]

Charging station usage across PGE’s Electric Avenue network delivered more than 6,800 sessions since
July 2019 when Lyft driver began subscribing to the program. Total sessions increased from 500 in July
2019 to 850 in January 2020. Due to stay at home orders imposed by the COVID-19 pandemic, station
utilization declined by more than 80 percent through April 2020 with 150 sessions recorded [24].
Using the number of Lyft subscribers and charging session data is an imperfect approximation for
estimating ride-hail EVs in Portland. This proxy measure only captured the stations on Electric Avenue
charging network—seven designated locations with four DC fast charging stations and one Level 2
charging station at each ‘Avenue’ [31] . These Electric Avenue stations only represent a small portion of
the 165 DC fast charging and more than 1,000 Level 2 charging stations throughout Portland. Portland has
the highest rates of EV uptake by population out of all the cities in the EV Shared Mobility project with
12.43 EVs per 1,000 people, ahead of Seattle’s 11.5 EVs per 1,000 people. As of September 2020, there
were 26,500 EVs registered across the Portland metro region [24].

NEW YORK

New York City hosts one of the largest for-hire vehicle (FHV) fleets in the country. The fleet tripled
between 2010 and 2019 and the emissions share from the FHV sector increased by 66 percent between

ATLAS PUBLIC POLICY                                                                                             8
ASSESSMENT OF EVS IN TNC FLEETS 2010 and 2018 [32]. FHVs directly added almost 1 billion in yearly vehicle miles traveled in the City between 2013 and 2017 [33]. The City has taken considerable strides toward increasing EV charging availability and encouraging EV adoption through various programs. City government has taken the lead by committing to electrify public fleet vehicles and has more than 2,000 passenger EVs already active in the municipal vehicle pool [34]. Local targets seek to fully electrify the fleet by 2040 and New York City has goals to reach passenger EV deployment equal to 20 percent of all new passenger vehicle registrations citywide by 2025 [35, 34]. As a part of the EV Shared Mobility project, New York City is working with charging service provider EVgo to install DC fast charging around the city to increase the deployment of EVs in the FHV sector. EVgo has committed to deploy six DC fast charging stations and the New York City Department of Transportation will deploy four additional fast charging stations at one of their parking garages. These deployments complement goals developed by the local electric utility Con Edison to develop EV fast charging hubs at a total of 50 locations throughout the five boroughs by the end of 2021. More than $20 million has been pledged to support this initiative [36]. In 2019, New York City became the first large American city to implement a cap on FHV registrations. The cap has been extended through 2020 and in 2019, EV FHV vehicles were exempt from the regulation [37]. This is one of the factors that has contributed to a rise in EV FHV registrations in the City. As of August 2020, New York City had 300 licensed EVs registered in the FHV fleet. At least 241 of these were battery electric vehicles, a 20-fold increase from the 12 licensed battery electric vehicles reported by New York City in August 2019 [38]. A recent analysis conducted in August 2020 of all EVs in New York City’s FHV fleet shows Tesla represents 40 percent of the FHV EVs in New York City. Of the Tesla models, the Model 3 accounted for 107 of the EV FHV registrations and the Model S claimed 46. The Nissan Leaf is the third most popular EV with 40 active vehicles. New York City is unique in that plug-in hybrids account for 20 percent of the active vehicles in the FHV EV fleet. The Toyota Prius Prime, a plug-in hybrid vehicle, was tied with the Chevy Bolt as the fourth most popular EV in the New York City EV FHV fleet. Almost 80 percent of the active FHV EVs in New York are registered on the Uber platform. Figure 5 summarizes the number of EV FHV registrations by make. ATLAS PUBLIC POLICY 9
ASSESSMENT OF EVS IN TNC FLEETS

FIGURE 5: MAKE OF EVS DRIVEN BY LICENSED FHV DRIVERS IN NEW YORK CITY IN AUGUST 2020

 180
             162
 160
 140
 120
 100
   80
   60
                         40
   40
                                    23          20         19          17
   20                                                                              7           6   3       3
     0

This chart shows the make of EVs driven by licensed FHV drivers in New York City in August 2020. Almost 40 percent
of FHV drivers drive a Tesla.
Source: Atlas Public Policy analysis of data from the New York Taxi and Limousine Commission

EV adoption among FHV drivers in New York City is expected to accelerate as charging infrastructure
deployments pick up through the EV Shared Mobility and other projects. The New York City metro area
including parts of Connecticut and New Jersey currently has more than 56,000 EVs on the road, indicating
that active FHVs account for less than three percent of the total. The 20 additional DC fast charging ports
being installed through this project will add to the 587 already accessible throughout the City and provide
increased fast charging access to FHV drivers to reduce downtime due to refueling.

DENVER

Both Denver and the state of Colorado are leaders in the implementation of policy supporting
transportation electrification. At the local level, Denver has adopted an aggressive transportation
electrification plan, committing to an 80 percent reduction in greenhouse gas emissions by 2050 [39].
Statewide, Colorado Energy Office launched a $4 million Direct Current Fast Charging Plazas Program,
which introduces new requirements for electric utilities to invest in transportation electrification to target
high-mileage fleets like Transportation Network Companies [40]. This legislation led to the filing of $103
million in transportation electrification plans by two utilities in the state. The plan filed by Xcel Energy
includes proposed investment in charging infrastructure specifically supporting ride-hail electrification
throughout their service territory [41].

ATLAS PUBLIC POLICY                                                                                              10
ASSESSMENT OF EVS IN TNC FLEETS The state has explored implementing regulations on TNCs similar to the approach taken in New York City. State policymakers published the Emerging Mobility Impact Study in November 2019 recommending the implementation of fees levied on shared mobility providers with exemptions for EV TNC drivers. Fees were one of the policy tools identified by the study to reduce the impact of the ride-hail and general shared mobility sectors in the state which contribute 4.5 million miles of vehicle travel every day. The report estimates this figure will grow by 140 percent through 2030, highlighting an urgency to electrify these high mileage vehicles [42]. Around the same time as the release of the Emerging Mobility Impact Study, Lyft announced plans to add more than 200 EVs to their Express Drive rental fleet in Denver [43]. Lyft made 200 Kia Niro EVs available for its Lyft drivers to lease as part of its Express Drive program in December 2019 [44]. Several months after this commitment was announced in Denver, Lyft announced plans to electrify all vehicles across their platform by 2030. Denver is one of the first cities to receive new rental EVs from Lyft as the company works towards realizing these pledges [13]. Within the EV Shared Mobility Project, Denver is rolling out DC fast charging infrastructure to support Lyft’s deployment of rental EVs across the city. Denver will work with the charging service provider EVgo to install seven DC fast charging stations targeting TNC driver use through the course of the project. The City is also working with the Denver Metro Clean Cities Coalition to increase EV awareness and encourage drivers to switch to EVs [45]. As is the case in Portland, the City of Denver does not currently track data on the number of EVs registered as ride-hail vehicles. With Lyft’s commitment, there will be at least 200 ride-hail Kia Niro EVs throughout the city. CONCLUSION Ride-hail electrification efforts have taken different forms across each of the four cities covered in the EV Shared Mobility project, but all rely on strong partnerships. The City and County of Denver and Forth in Portland have engaged directly with Lyft to accelerate electrification of ride-hail services in each city and contribute to Lyft’s goal to electrify their entire platform by 2030. The City of Seattle and New York City have formed partnerships between local government agencies and have implemented data collection methods and regulations to track the adoption of EVs among TNCs through registrations and licensing requirements. Across all four cities, efforts to increase access to charging infrastructure have taken the forefront. Across the project, Seattle, New York City, and Denver plan to install a total of 37 DC fast charging stations to help support electric shared mobility drivers. Forth’s program focuses on outreach and education to TNC drivers in Portland. Across each city, an increasing number of EVs are being adopted in local TNC fleets despite some shorter periods of decline. New York City saw their FHV EV licenses jump from roughly 12 to 300 between August 2019 and August 2020. Similarly, King County saw their ride-hail fleet’s EV registrations grow from 612 to 996 from 2018 to 2019. The data in Portland shows that Lyft’s partnership with PGE helped facilitate a significant increase in charging sessions on PGE’s Electric Avenue Charging Network within the first six months. The number of unique EV drivers using the service increased from 32 to 82 between July 2019 and February 2020. The trend of increasing EV adoption was also seen in Denver despite a lack of data on TNC EV registrations in the city. Lyft’s introduction of 200 EVs in November 2019 kickstarted the progress towards electrifying rid-hail vehicles in Denver. ATLAS PUBLIC POLICY 11
ASSESSMENT OF EVS IN TNC FLEETS

The types of vehicles EV TNC drivers use largely reflect the model offerings and sales trends seen
nationwide. Tesla, which accounts for 70 percent of EV sales between January and June 2020, is also the
most popular EV make among TNC drivers in both New York City and King County. Detailed data for make
and model of ride-hail EVs was not available for Portland and Denver. The most popular non-Tesla EV
driven by TNCs in New York City and King County differ. The Toyota Prius Plug In was the second most
popular EV registered in King County for ride-hail drivers, and the Nissan Leaf was the second most
common EV model registered in New York City. As an approximation for Denver’s TNC fleet, Lyft’s Drive
Express program chose Kia Niro as their EV for drivers. The variety of EVs used by ride-hail drivers is likely
to increase as 62 new EV models are expected to reach the U.S. market by the end of 2022 [8].
All four cities experienced unexpected challenges beginning in March 2020 as a result of the economic
and health impacts of COVID-19. Washington, New York, Colorado, and Oregon all enacted shelter-in-
place and social distancing orders, which affected ride-hail operation in each of the four cities by limiting
nonessential travel and thus reducing ridership dramatically. This decline was reflected in the data shared
in this assessment where significant declines in EV registrations and EV charging sessions were seen
across all cities reporting this data. Unique subscribers on Lyft’s charging service in Portland dropped from
80 in March to 30 in April 2020. In King County, a slight decline of 189 EVs for ride-hail drivers being
inspected as of May 2020 compared 201 in May 2019. The full 2020 dataset was not complete at the
publishing of this report. Despite declines in EV charging use and EV adoption seen throughout the
country during the pandemic, analysts have predicted a steady recovery of the U.S. EV market [5].
Nationwide, EV sales began to recover in July 2020 with and were down only 13 percent for the month
compared to July 2019. This is a significant improvement from the 54 percent drop in sales seen in May
2020 compared to 2019 levels [8]. Commitments from both Lyft and Uber to electrify all rides on their
platforms by 2030 signals confidence in the EV market and focuses on recovery that places and emphasis
on EVs.
Confidence from the private sector around the central role of EVs in the remaking of the transportation
system further supports the case for increased EV infrastructure, policies, and programs backed by local
and state decisionmakers. As EV adoption by ride-hail drivers increases, data collection efforts similar to
those conducted by New York City and King County will remain essential to assess the effectiveness of
different policies and interventions. The progress of electrification of these high mileage vehicles can
inform other citywide initiatives around greenhouse gas emission reductions and vehicle electrification.
Programs like Lyft’s charging subscription service in Portland and leasing of EVs in Denver are all examples
of how cities and organizations can leverage different stakeholders to create partnership opportunities.
These partnerships can maximize benefits to cities and their communities, especially if private sector
partners and electric utilities take on the financial responsibility of implementing EV programs.
Decisionmakers at all levels can also seek out state and federal funding opportunities, like the one
employed for the EV Shared Mobility project, to deploy the infrastructure and implement the programs
necessary to support robust EV growth.

ATLAS PUBLIC POLICY                                                                                          12
ASSESSMENT OF EVS IN TNC FLEETS

REFERENCES

[1] Atlas EV Hub, "National Sales Dashboard," August 2020. [Online]. Available:
    https://www.atlasevhub.com/materials/national-ev-sales/. [Accessed August 2020].

[2] Atlas EV Hub, "EV Hub 2020 Q2 Review," August 2020. [Online]. Available:
    https://www.atlasevhub.com/quarterly-review-of-ev-market/. [Accessed August 2020].

[3] K. E. B. W. E. J. O. Lauren Bauer, "Ten Facts about COVID-19 and the U.S. Economy," Brookings, 17
    September 2020. [Online]. Available: https://www.brookings.edu/research/ten-facts-about-covid-19-
    and-the-u-s-economy/. [Accessed 27 September 2020].

[4] International Council on Clean Transportation , "Update on electric vehicle costs in the United States
    through 2030," April 2019. [Online]. Available:
    https://theicct.org/sites/default/files/publications/EV_cost_2020_2030_20190401.pdf. [Accessed July
    2019].

[5] R. Chandrasekaran, "Electric vehicles market to get back on track post-Covid-19," August 2020. [Online].
    Available: https://www.woodmac.com/news/opinion/electric-vehicles-market-to-get-back-on-track-
    post-covid-19/. [Accessed September 2020].

[6] Atlas EV Hub , "Global Private Investments Dashboard," 2019. [Online]. Available:
    https://www.atlasevhub.com/materials/private-investment/. [Accessed July 2019].

[7] Atlas EV Hub, "State Sales and Model Availability," Atlas Public Policy, August 2020. [Online]. Available:
    https://www.atlasevhub.com/materials/state-ev-sales-and-model-availability/. [Accessed July 2020].

[8] Atlas EV Hub, "Automakers Dashboard," September 2020. [Online]. Available:
    https://www.atlasevhub.com/weekly-digest-archive/. [Accessed September 2020].

[9] Second Measure , "Uber vs. Lyft: Who’s tops in the battle of U.S. rideshare companies," June 2019.
    [Online]. Available: https://blog.secondmeasure.com/datapoints/rideshare-industry-overview/.
    [Accessed July 2019].

[10] Dara Khosrowshahi, "Driving a Green Recovery," Uber, 8 September 2020. [Online]. Available:
     https://www.uber.com/newsroom/driving-a-green-recovery/. [Accessed September 2020].

ATLAS PUBLIC POLICY                                                                                              13
ASSESSMENT OF EVS IN TNC FLEETS
[11] B. Berman, "Los Angeles considers making Uber and Lyft go all-electric," December 2019. [Online].
Available: https://electrek.co/2019/12/27/los-angeles-considers-making-uber-and-lyft-go-all-electric/.
[Accessed September 2020].
[12] J. Shieber, "Committing to a fully zero-emission fleet by 2040, Uber is dedicating $800 million to
electrifying its drivers," September 2020. [Online]. Available:
https://techcrunch.com/2020/09/08/committing-to-a-fully-zero-emission-fleet-by-2040-uber-is-
dedicating-800-million-to-electrifying-its-drivers/. [Accessed September 2020].
[13] Lyft, "Leading the Transition to Zero Emissions: Our Commitment to 100% Electric Vehicles by 2030,"
June 2020. [Online]. Available: https://www.lyft.com/blog/posts/leading-the-transition-to-zero-
emissions. [Accessed August 2020].
[14] Lyft, "Working toward a fully electric future — and challenging partners to do the same," November
2019. [Online]. Available: https://www.lyft.com/blog/posts/lyft-denver-ev-2019. [Accessed August 2020].
[15] Lyft , "Making Cities More Livable with Electric Vehicles," February 2019. [Online]. Available:
https://blog.lyft.com/posts/2019/2/6/making-cities-more-liveable-with-electric-vehicles. [Accessed July
2019].
[16] L. Dishman, "Juno is abruptly shutting down. Here’s what riders and drivers need to know," November
2019. [Online]. Available: https://www.fastcompany.com/90432598/juno-is-abruptly-shutting-down-
heres-what-riders-and-drivers-need-to-know. [Accessed August 2020].
[17] T. Bellon, "Gett's Juno ends NYC ride-hailing services, citing regulation," November 2019. [Online].
Available: https://www.reuters.com/article/us-gett-juno/getts-juno-ends-nyc-ride-hailing-services-citing-
regulation-idUSKBN1XS2JZ. [Accessed August 2020].
[18] R. Molla, "Lyft has eaten into Uber’s U.S. market share, new data suggests," Vox , December 2018.
[19] Seattle Office of Sustainability and Environment, "Drive Clean Seattle," 2020. [Online]. Available:
https://www.seattle.gov/environment/climate-change/drive-clean-seattle. [Accessed August 2020].
[20] Seattle Office of Sustainability and Environment, "Cliamte Action Plan," April 2018. [Online]. Available:
https://www.seattle.gov/environment/climate-change/climate-planning/climate-action-plan. [Accessed
August 2020].
[21] Seattle Department of Transportation, "EVSE Roadmap for Shared Mobility Hubs," May 2020. [Online].
Available: http://evsharedmobility.org/wp-content/uploads/2020/05/EVSE-Roadmap.pdf. [Accessed
August 2020].
ATLAS PUBLIC POLICY 14ASSESSMENT OF EVS IN TNC FLEETS
[22] Atlas EV Hub, "Seattle Project Living Case Study 1.0," June 2020. [Online]. Available:
http://evsharedmobility.org/resource/seattle-project-living-case-study/. [Accessed August 2020].
[23] K. County, "Regulations and notices," King County Records and Licensing Services (RALS), 9 July 2020.
[Online]. Available: https://kingcounty.gov/depts/records-licensing/licensing/taxi-for-hire-transportation-
networks/notices-regulations.aspx. [Accessed September 2020].
[24] Atlas Public Policy, "EV Shared Mobility Dashboard," August 2020. [Online]. Available:
http://evsharedmobility.org/resource/ev-shared-mobility-dashboard/. [Accessed August 2020].
[25] Go Electric Oregon, "Incentives and Rebates," 2020. [Online]. Available:
https://goelectric.oregon.gov/incentiv. [Accessed September 2020].
[26] City of Portland, "Climate Action Plan," 2015. [Online]. Available:
https://www.portlandoregon.gov/bps/index.cfm?&c=49989. [Accessed September 2020].
[27] Atlas Public Policy, "Forth Project Living Case Study 2.0," February 2020. [Online]. Available:
http://evsharedmobility.org/resource/forth-project-living-case-study/. [Accessed September 2020].
[28] Uber, "Electrifying our network," 30 June 2018. [Online]. Available:
https://www.uber.com/newsroom/electrifying-our-network/. [Accessed August 2018].
[29] "Lyft and PGE Bring Electric Vehicle Charging to Lyft Drivers," Portgland General Electric Company, 23
May 2019. [Online]. Available: https://www.portlandgeneral.com/our-company/news-room/news-
releases/2019/05-23-2019-lyft-and-pge-bring-electric-vehicle-charging-to-lyft-drivers. [Accessed
September 2020].
[30] N. King, "Governor Kate Brown Announces New Statewide Actions on COVID-19," State of Oregon
Newsroom, 16 March 2020. [Online]. Available:
https://www.oregon.gov/newsroom/Pages/NewsDetail.aspx?newsid=36192. [Accessed September
2020].
[31] B. Strasburger, Interviewee, Program Operations, Portland General Electric. [Interview]. 28 September
2020.
[32] NYC Mayor's Office of Sustainability, NYC Taxi and Limousine Commission, "Emissions from the Taxi and
For-Hire Vehicle Transportation Sector in New York City," April 2020. [Online]. Available:
http://evsharedmobility.org/resource/emissions-from-the-taxi-and-for-hire-vehicle-transportation-
sector-in-new-york-city/. [Accessed September 2020].
ATLAS PUBLIC POLICY 15ASSESSMENT OF EVS IN TNC FLEETS
[33] Schaller Consulting, "Unsustainable? The Growth of App-Based Ride Services and Traffic, Travel and the
Future of New York City," 27 February 2017. [Online]. Available:
http://schallerconsult.com/rideservices/unsustainable.htm. [Accessed August 2018].
[34] Office of the Mayor of New York City, "ONENYC: Mayor Announces City Electric Vehicle Fleet Ahead of
Schedule, Half Way Toward Goal," April 2017. [Online]. Available: https://www1.nyc.gov/office-of-the-
mayor/news/245-17/onenyc-mayor-city-electric-vehicle-fleet-ahead-schedule-half-way-toward-goal.
[Accessed September 2020].
[35] A. Sanders, "Mayor de Blasio to sign order for all municipal vehicles in NYC to be electric by 2040,"
February 2020. [Online]. Available: https://www.nydailynews.com/news/politics/ny-de-blasio-municipal-
fleet-electric-nyc-2040-20200205-p6jzjyt5ujdkvh2bk7wbi3mdvm-story.html. [Accessed September
2020].
[36] Office of the Mayor of New York City, "Leading the Charge: Mayor Announces Fast-Charging EV Hubs in
All 5 Boroughs," September 2017. [Online]. Available: https://www1.nyc.gov/office-of-the-
mayor/news/600-17/leading-charge-mayor-fast-charging-ev-hubs-all-5-boroughs. [Accessed September
2020].
[37] M. S. Jen Roberton, "Emissions Impact of For-Hire Vehicles and the Role of Electric Vehicles," 2020.
[Online]. Available: http://evsharedmobility.org/wp-content/uploads/2020/02/US-DOE-Grant-Webinar-
PresentationV2_252020.pdf. [Accessed September 2020].
[38] T. Metz, Interviewee, Policy Analyst, NYC Taxi and Limousine Commission. [Interview]. 25 June 2020.
[39] City and County of Denver, "Climate Action," 2020. [Online]. Available: https://citycountydenver-
prod.adobecqms.net/content/denvergov/en/climate-sustainability/initiatives/climate-action.html.html.
[Accessed September 2020].
[40] T. Chuang, "The good, the bad and the complicated: How Colorado’s electric vehicle laws changed this
session," May 2019. [Online]. Available: https://coloradosun.com/2019/05/06/colorado-new-electric-
vehicle-laws-2019/. [Accessed September 2020].
[41] Atlas EV Hub, "Electric Utility Filings Dashboard," 2020. [Online]. Available:
https://www.atlasevhub.com/materials/electric-utility-filings/. [Accessed September 2020].
[42] Colorado Energy Office, Colorado Department of Transportation, "2019 Emerging Mobility Impact
Study," November 2019. [Online]. Available: https://www.codot.gov/library/studies/emerging-mobility-
impact-study/emis-documents/2019-emis-report.pdf. [Accessed September 2020].
ATLAS PUBLIC POLICY 16ASSESSMENT OF EVS IN TNC FLEETS
[43] M. Moon, "Lyft adds 200 electric vehicles to its fleet in Denver," November 2019. [Online]. Available:
https://www.engadget.com/2019-11-15-lyft-denver-express-drive-electric-vehicles.html. [Accessed
September 2020].
[44] J. Paul, and T. Chuang, "Lyft is introducing a fleet of 200 electric Kias in Colorado, a car model that
motorists here can’t even buy," Colorado Sun, 14 November 2019. [Online]. Available:
https://coloradosun.com/2019/11/14/kia-niro-lyft-colorado-fleet/. [Accessed September 2020].
[45] Atlas Public Policy, "Denver Project Living Case Study 1.0," March 2020. [Online]. Available:
http://evsharedmobility.org/resource/denver-project-living-case-study/. [Accessed September 2020].
This material is based upon work supported by the U.S. Department of Energy’s Office of Energy Efficiency
and Renewable Energy under the Vehicles Technologies Office Deployment Award Number DE-EE0008261.
This report was prepared as an account of work sponsored by an agency of the United States Government.
Neither the United States Government nor any agency thereof, nor any of their employees, makes any
warranty, express or implied, or assumes any legal liability or responsibility for the accuracy, completeness,
or usefulness of any information, apparatus, product, or process disclosed, or represents that its use would
not infringe privately owned rights. Reference herein to any specific commercial product, process, or service
by trade name, trademark, manufacturer, or otherwise does not necessarily constitute or imply its
endorsement, recommendation, or favoring by the United States Government or any agency thereof. The
views and opinions of authors expressed herein do not necessarily state or reflect those of the United States
Government or any agency thereof.
ATLAS PUBLIC POLICY 17WWW.ATLASPOLICY.COM
You can also read