Assessment of Rural Communities' Adaptive Capacity to Climate Change in Kaduna State, Nigeria - CORE
←
→
Page content transcription
If your browser does not render page correctly, please read the page content below
Journal of Environment and Earth Science                                                                 www.iiste.org
ISSN 2224-3216 (Paper) ISSN 2225-0948 (Online)
Vol.5, No.20, 2015

Assessment of Rural Communities’ Adaptive Capacity to Climate
               Change in Kaduna State, Nigeria
      Iliya Bitrus Abaje1   Bulus Ajiya Sawa2     Edwin Osawe Iguisi2   Abdulhamed Adamu Ibrahim2
  1. Department of Geography and Regional Planning, Federal University Dutsin-Ma, P.M.B. 5001 Dutsin-Ma,
                                            Katsina State, Nigeria
                     2. Department of Geography, Ahmadu Bello University, Zaria, Nigeria

Abstract
This research is aimed at assessing the adaptive capacity of rural people to climate change in Kaduna State with
particular reference to some selected communities in six Local Government Areas of the state. Data and
information for this study were obtained from a direct field study based on the result of 426 questionnaires that
were administered to household heads in the selected communities. Simple descriptive statistics was used to
describe the socioeconomic characteristics of the respondents. In this study, five indices (wealth, farm inputs,
availability of infrastructures and institutions, irrigation potentials, and literacy level) influencing rural people
adaptive capacity to climate change were selected; and a five point Likert scale was used to assess the adaptive
capacity to the changing climate. The results revealed that rural communities’ people in Kajuru LGA had the
highest adaptive capacity to the impacts of climate change. Moderate adaptive capacity was recorded among the
rural people in Kagarko, Soba and Sanga LGAs; while a low adaptive capacity was recorded in Ikara and Kauru
LGAs. Therefore, Ikara and Kauru LGAs would likely be the most threatened LGAs in the state to the impacts
of climate change in terms of adaptive capacity. The study recommends the development of climate change
policies that would enhance the adaptive capacities of rural communities at both the state and local government
levels. These policies should be specifically geared toward low adaptive capacity areas with emphasis on poverty
reduction.
Keywords: Adaptive capacity index, climate change, households, impacts, vulnerability

1.       Introduction
Human and natural systems have the capacity to cope with adverse circumstances, but with continuing climate
change, adaptation is needed to maintain this capacity (Noble et al, 2014). The tendency of systems to adapt to
impacts of climate change is influenced by certain system characteristics called determinants of adaptation
(Olmos, 2001). These terms, among others include: sensitivity (degree to which a system is affected by, or
responsive to, climate stimuli); vulnerability (degree to which a system is susceptible to injury, damage or harm);
resilience (degree to which a system rebounds, recoups or recovers from a stimulus); and, adaptive capacity (the
potential or capability of a system to adapt or alter to better suit climatic stimuli).
          Adaptation depends greatly on the adaptive capacity of an affected system, region, or community to
cope with the impacts and risks of climate change (IPCC, 2001). Therefore, enhancement of adaptive capacity
reduces the vulnerability of any region, community or household and promotes sustainable development.
          At the local or rural level, the key determinant of individuals, households or communities’ adaptive
capacity both to reduce risk and to cope with and adapt to increased risk levels of climate change are their
livelihood assets such as financial, physical, natural, social, and human capital (Smit and Wandel, 2006; Moser
and Satterthwaite, 2008; Deressa et al, 2008a; Deressa et al, 2008b; Gbetibouo et al, 2010).
          Most of the research works on adaptive capacity, for examples, Dolan and Walker (2003), Smit and
Wandel (2006), Wall and Marzall (2006), Fussel and Klein (2006), Deressa et al, 2008a, Deressa, et al, 2008b;
Kuriakose et al (2009), Nelson et al (2010), Gbetibouo et al, (2010) and Ruhl (2011) among others, are closely
linked to vulnerability assessments. This may be due to the fact that adaptive capacity helps in reducing climate
change vulnerability.
          Adaptive capacity varies from country to country, from state to state, from community to community,
from household to household, among social groups and individuals, and over time. It varies not only in terms of
its value but also according to its nature. The scales of adaptive capacity are not independent or separate. The
capacity of a household to cope with climate impacts or risks depends to some degree on the enabling
environment of the community, and the adaptive capacity of the community is reflective of the resources and
processes of the region (Yohe and Tol, 2002; Smit and Wandel, 2006, Abaje and Giwa, 2010)
          With specific reference to the northern part of Nigeria, poor communities tend to be more vulnerable to
the impacts of climate change especially when located in high risk areas, as they have lower adaptive capacity
and depend solely on the natural environment, which is climate-sensitive, for their livelihoods (Ishaya and Abaje,
2008; Abaje et al, 2014).
          Thus, an assessment of the adaptive capacity of the rural people to the changing climatic conditions in
Kaduna State is imperative to facilitating appropriate strategies to ameliorate the scourge of climate change in

                                                         14
Journal of Environment and Earth Science www.iiste.org
ISSN 2224-3216 (Paper) ISSN 2225-0948 (Online)
Vol.5, No.20, 2015
the state. This forms the basis for this research with emphasis on some selected rural communities in six LGAs
of the state.
2. Study Area
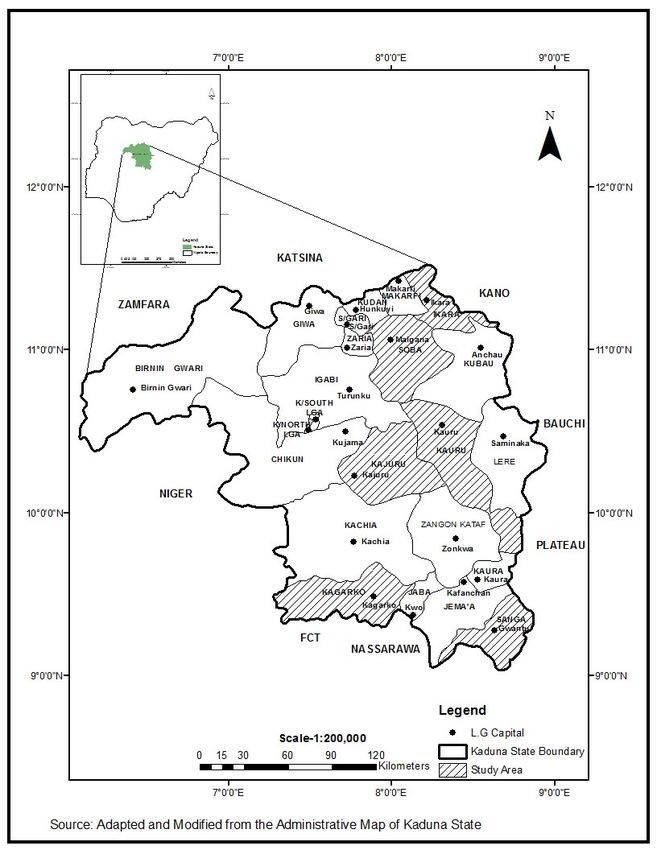
Kaduna State is located between latitude 090 02'N and 110 32'N and between longitude 060 15'E and 080 38'E
(Figure 1). The climate of the state is the tropical dry-and-wet type, classified by Koppen’s as Aw. The wet
season lasts from April through mid-October with a peak in August, while the dry season extends from mid-
October of one calendar-year to April of the next (Abaje et al, 2010). The annual average rainfall in the state is
about 1323mm. The spatial and temporal distribution of the rain varies, decreasing from an average of about
1733mm in Kafanchan-Kagoro areas in the South of the study area to about 1203mm in the central part (Kaduna)
and about 1032mm in Zaria, lkara and Makarfi LGAs in the north.
Seasonal variation in rainfall is directly influenced by the interaction of two air masses: the relative
warm and moist tropical maritime (mT) air mass, which originates from the Atlantic Ocean associated with
southwest winds in Nigeria; and the relatively cool, dry and stable tropical continental (cT) air mass that
originates from the Sahara Desert and is associated with the dry, cool and dusty North-East Trades known as the
Harmattan (Sawa, 2002; Abaje et al, 2012a). The boundary zone between these two air streams is called the
Intertropical Discontinuity (ITD). The movement of the ITD northwards across the state in August (around
latitude 21 to 220N) marks the height of the rainy season in the whole state while its movement to the
southernmost part around January/February (approximately at 60N) marks the peak of the dry season in the state
(Odekunle, 2006; Odekunle et al, 2008; Abaje et al, 2010; Abaje et al, 2012b). The highest average air
temperature normally occurs in April (28.90C) and the lowest in December (22.90C) through January (23.10C).
The mean atmospheric relative humidity ranges between 70-90% and 25-30% for the rainy and dry seasons
respectively. The highest amount of evaporation occurs during the dry season.
The geology of the study area is underlain by gneisses, migmatites and metasediments of the
Precambrian age which have been intruded by a series of granitic rocks of late Precambrian to lower Palaeozoic
age (McCurry, 1989). The entire land structure consists of an undulating Plateau with major rivers in the State
including River Kaduna, River Wonderful in Kafanchan, River Kagom, River Gurara and River Galma in
addition to several streams.
The whole state is covered by the red-brown to red-yellow ferruginous tropical soils which are heavily
weathered and markedly laterized. They are mostly formed on granite and gneiss parent materials, and on
aeolian and many sedimentary deposits. The whole state is covered by the tropical grassland vegetation with the
density of trees and other plants decreasing as one move northwards (Abaje, 2007).
15Journal of Environment and Earth Science www.iiste.org
ISSN 2224-3216 (Paper) ISSN 2225-0948 (Online)
Vol.5, No.20, 2015
Figure 1: Map of Kaduna State Showing the Study Area
3. Materials and Methods
Data and information for this research work were obtained from a direct field study. Bartlett, Kotrlik and Higgins
(2001) method of determining sample size was adopted. The method is computed as:
(t ) 2 × ( p )(q )
n0 = (1)
(d ) 2
for sample size of not more than 5% and
r
n1 = n0 (2)
100
for adjusted sample size for response rate
where: t = value for selected alpha level of 0.025 in each tail which is 1.96
(p)(q) = estimate of variance which is 0.25
16Journal of Environment and Earth Science www.iiste.org
ISSN 2224-3216 (Paper) ISSN 2225-0948 (Online)
Vol.5, No.20, 2015
d = acceptable margin of error for proportion being estimated which is 0.05
r = anticipated response rate
n 0 = sample size of not more than 5%
Based on this method, the sample size used with anticipated response rate of 90% was 426. The
questionnaires were proportionally administered to household heads in six LGAs namely: Sanga (52), Kagarko
(58), Kajuru (40), Kauru (75), Soba (112), and Ikara (89). These LGAs were selected based on their rurality.
Three (3) communities were sampled in each of the six LGAs using simple random sampling. Research
assistants specializing in geography were trained to conduct the interview. The questionnaires were purposively
administered to household heads who are 45 years and above, and must have been residing in the community for
at least 30 years. The basis for this was to gather information from respondents who have had experiences in
climate change over the years and are more concerned and conscious about the impacts and vulnerability of
climate change on their livelihoods and the environment (Ishaya and Abaje, 2008; Abaje et al, 2014). Only
respondents who were willing and interested on the subject matter were purposively administered questionnaires.
Simple descriptive statistics was used to describe the socioeconomic characteristics of the respondents using
Microsoft Excel 2013.
In this very study, the major indices influencing rural peoples’ adaptive capacity were considered as
employed by Deressa, et al (2008b) and Gbetibouo et al (2010) that climate change adaptive capacity depends
on five livelihood assets: wealth, farm inputs, availability of infrastructures and institutions, irrigation potentials,
and literacy level. These five indices were selected because they are the major indicators of adaptive capacity of
rural communities to climate change on which data can be obtained using questionnaire. At the same vein, these
indicators are the most cited in several studies (for examples: Moss et al, 2001; Cutter et al, 2003; Fothergill and
Peek, 2004; O’Brien et al, 2004; Adger et al, 2004; Deressa et al, 2008a; Cutter et al, 2009; and Gbetibouo et al,
2010) of rural communities’ adaptive capacity to climate change.
A five point Likert Scale was then used (5=strongly agree, 4=agree, 3=undecided, 2=disagree and
1=strongly disagree) to assess the adaptive capacity to the changing climate. The adaptive capacity (AC) of each
LGA was therefore calculated as:
W + FI + AII + IP + LL
AC = (3)
5
where: W = wealth
FI = farm inputs
AII = availability of infrastructure and institutions
IP = irrigation potentials
LL = literacy level
Using the interval scale of 0.50, the upper cut-off point was determined as 3.00 + 0.50 = 3.50; the
lower limit as 3.00 – 0.50 = 2.50. Table 1 shows the classification of the adaptation capacity.
Table 1: Classification of Adaptation Capacity
Mean Score Level of Adaptive Capacity
0.00 – 2.49 Low adaptive capacity
2.50 – 3.49 Moderate adaptive capacity
3.50 – 5.00 High adaptive capacity
The calculated result of the adaptive capacity of the people to the changing climatic conditions was
then used to produce a map of adaptive capacity of the studied LGAs of the state.
4. Results
4.1 Socioeconomic Characteristics of Respondents
The results of the finding show that the majority of the respondents were males (86.2%) while only 13.8% were
females. Out of the 426 respondents, 37.3% attended primary school, 12.9% Qur’anic School, 16.0% have
tertiary education, and 18.5% have secondary education, while 15.3% have no formal education. The average
age of the respondents is 53 years, and majority of them (86.6%) are married with an average household size of
10. The average annual income of the respondents is N195 970. The respondents have been living in the area
for an average of 48 years and their major occupation is farming which represent 58.7%, while 13.6% engaged
in livestock production, civil servants represent 20.2%, traders (5.6%), while craft and others 1.6%. Based on
this result, it is a clear that most of the respondents depend heavily on environmental resources for their
livelihood.
4.2 Adaptive Capacity of Rural Communities to Climate Change
The results of the rural communities’ adaptive capacity to climate change in all the LGAs based on the five
17Journal of Environment and Earth Science www.iiste.org
ISSN 2224-3216 (Paper) ISSN 2225-0948 (Online)
Vol.5, No.20, 2015
livelihoods assets (wealth, farm inputs, availability of infrastructures and institutions, potentials for irrigation,
and literacy level) are presented in Table 2.
Table 2: Adaptive Capacity to Climate Change Based on Local Government Area
Local Government Areas
Adaptive Capacity Variables
Sanga Kagarko Kajuru Kauru Soba Ikara
a Wealth consideration as indices of adaptive
2.79 3.27 3.82 2.26 3.19 2.28
capacity to climate change
b Farm inputs consideration as indices of adaptive
3.48 3.41 4.03 2.41 3.52 2.53
capacity to climate change
c Infrastructural and institutional availability as
2.70 2.92 3.69 2.00 2.74 2.42
indices of adaptive capacity to climate change
d Irrigation potentials as indices of adaptive
2.98 3.53 3.73 2.46 3.01 2.47
capacity to climate change
e Literacy level consideration as indices of adaptive
capacity to climate change 3.38 3.20 4.08 2.61 3.16 2.38
Mean 3.07 3.27 3.87 2.35 3.12 2.42
Rank 4 2 1 6 3 5
Note: 0.00 – 2.49 = Low adaptive capacity
2.50 – 3.49 = Moderate adaptive capacity
3.50 – 5.00 = High adaptive capacity
Source: Data Analysis (2015)
The result on wealth consideration as indices of adaptive capacity to climate change (Table 2) revealed
high adaptive capacity (3.82) among the rural communities’ people in Kajuru LGA, moderate adaptive capacity
among the rural communities in Sanga, Kagarko, and Soba LGAs with adaptive capacity index of 2.79, 3.27 and
3.17 respectively, and low adaptive capacity among the rural communities of Kauru and Ikara with adaptive
capacity index of 2.26 and 2.28 respectively. As stated in most of the literature, wealth is one of the major
determinants of adaptive capacity. With large wealth, the impacts of climate change and hence the vulnerability
of the rural communities or households to climate change will be reduced. Wealth, according to Cutter et al,
(2003) enables rural communities to absorb and recover from losses and other impacts of climate change more
quickly due to insurance, entitlement programs, number of livestock and economic trees owned, ownership of
radio and television, and good quality of residential houses which are commonly used as indicators of wealth in
African rural communities. People living in poverty are more vulnerable because they have less money to spend
on preventive measures, emergency supplies and recovery efforts (Fothergill andPeek, 2004; Cutter et al, 2009).
The findings of this study is supported by the work of Marlin et al (2007) that adaptive capacity is higher in
Canadian communities because of their large wealth and therefore, the communities are less vulnerable to the
impacts of climate change.
In terms of farm inputs consideration as indices of adaptive capacity to climate change, the result
(Table 2) revealed high adaptive capacity among the people in all the rural communities of Kajuru, Soba, Sanga
and Kagarko LGAs with adaptive capacity index of 4.03, 3.52, 3.48, and 3.41 respectively. Moderate adaptive
capacity (2.53) among the rural people of Ikara LGA, and low adaptive capacity (2.41) in Kauru LGA. The
availability and proximity to supplies of farm inputs within 1-4 km are identified as indicators of modern (or
technological) adaptation to climate change in rural communities (Deressa et al, 2008b).
Considering infrastructural and institutional availability as indices of adaptive capacity to climate
change, the result (Table 2) shows that only Kajuru LGA recorded a high adaptive capacity (3.69) among the
rural people. Moderate adaptive capacity was recorded among the rural people of Kagarko, Soba, and Sanga
LGAs with adaptive capacity index of 2.92, 2.74, and 2.70 respectively; whereas Kauru LGA recorded a low
adaptive capacity (2.00) among the rural community people. The availability of infrastructure and institutions
such as good roads network, rural electric power supply, health/veterinary services, formal and informal credit-
based loaning institutions, and good markets among others are of great important in terms of adaptation to
climate change in rural communities by facilitating access to resources. This is in line with the result of Deressa
et al (2008a) that infrastructure and institutional factors influence the use of adaptation methods by rural farmers
in the Nile Basin of Ethiopia.
Irrigation potential is another important and prominent adaptive capacity in checking the impacts of
climate change and vulnerability among the rural communities in the study area. Irrigation potentials as indices
of adaptive capacity among the rural people is considered high (3.73) in Kajuru, high (3.53) in Kagarko,
moderate (3.01) in Soba and also moderate (2.98) in Sanga LGAs; whereas, this same variable is considered low
(2.46) in Kauru and low (2.47) in Ikara LGAs. The use of irrigation potential as put forward by O’Brien et al
(2004) is based on the assumption that communities with more potentially irrigable lands are expected to have a
18Journal of Environment and Earth Science www.iiste.org
ISSN 2224-3216 (Paper) ISSN 2225-0948 (Online)
Vol.5, No.20, 2015
higher capacity to adapt to adverse climatic conditions and other economic shocks.
Figure 2: Map of Adaptive Capacity Across the Local Government Areas
Source: Author’s elaboration
Literacy level as an adaptive capacity among the rural people in study area was considered high (4.08)
in Kajuru LGA; whereas it was considered moderate among the rural people of Sanga, Kagarko, Soba, and
Kauru LGAs with adaptive capacity index of 3.38, 3.20, 3.16, and 2.61 respectively. In Ikara LGA, the literacy
level was low (2.38) among the rural people. The literacy level of rural communities is considered to help
ascertain the level of skills and education among the rural people. Deressa et al, (2008b) argued that
communities or nations with high level of knowledgeable people are considered to have greater adaptive
capacity than those with low literacy level.
A map of the adaptive capacity of the studied LGAs is presented graphically in Figure 2. A general
examination of the mean adaptive capacity among the rural communities in all the LGAs of the state (Table 2)
shows that rural communities’ people in Kajuru LGA have the highest adaptive capacity (3.87) to the impacts of
climate change and is ranked first (1st). Moderate adaptive capacity (3.27) is recorded among the rural people in
Kagarko LGA and is ranked second (2nd), followed by Soba with moderate adaptive capacity index of 3.12
(ranked 3rd), and then Sanga with moderate adaptive capacity index of 3.07 (ranked 4th). Ikara LGA with a low
adaptive capacity index of 2.42 among the rural people is ranked fifth (5th), while Kauru LGA with low adaptive
19Journal of Environment and Earth Science www.iiste.org
ISSN 2224-3216 (Paper) ISSN 2225-0948 (Online)
Vol.5, No.20, 2015
capacity index of 2.35 is the least (ranked 6th) and therefore, it will likely be the most threatened LGA in the state
to the impacts of climate change and vulnerability in terms of adaptive capacity.
5. Discussions
Adaptive capacity affects vulnerability through modulating exposure and sensitivity and thereby influencing
both the biophysical and the social elements of a system. The more the adaptive capacity within a system, the
greater the likelihood that system will be resilient in the face of climate change stresses. The capacity of
individuals or households to adapt to climate change impacts is a function of their access to resources.
Adaptation to climate change is costly and the need for intensive labor use also contributes to this cost.
Therefore, wealth is an important variable of adaptive capacity to climate change in rural communities. Its
enables rural communities to absorb and recover from losses and other impacts of climate change more quickly
than communities or households that lack wealth (poverty) (Cutter et al, 2003). Lack of wealth is the primary
contributor to vulnerability in the study area as fewer individuals and communities’ resources for recovery
shocks are available, thereby making the communities less resilient to the impacts of climate change. Households
with small family labor and lack the financial backing to hire labor are likely to be restricted from adaptation
practices that will mitigate the impacts of climate change in order to reduce the vulnerability in their households
and the community (Deressa et al, 2008b; Abaje et al, 2014). Wealth generally provides access to markets, farm
inputs, technology and other resources that can be used to adapt to climate change (Gbetibouo et al, 2010).
Based on this, rural communities in Kajuru LGA with high adaptive capacity (3.82) are most likely to adapt to
the impacts of climate change more strongly than communities in Kauru and Ikara with low adaptive capacity,
and will likely be the most threatened to the impacts and vulnerability of climate change in terms of wealth
consideration.
The availability and access to agricultural inputs recorded high adaptive capacity among the rural
people of Kajuru and Soba LGAs. For examples, the use of pest and diseases resistance seeds, the use of drought
tolerant or early maturing varieties of crops, and accessibility to complementary inputs such as fertilizers,
herbicides and pesticides in those LGAs will contribute positively to their successful adaptation measures.
According to Gbetibouo et al (2010), access to farm inputs (or agricultural) provide a general picture of the
financial status of a household or community. Kauru with a low adaptive capacity (2.41) in terms of availability
and access to agricultural inputs will be worst hit.
The quality and availability of infrastructure and institutions in a LGA is an important measure of
adaptive capacity of a given community. For examples, the availability of infrastructures such as good roads
permit the distribution of necessary agricultural inputs to rural farmers at all-time. These roads also influence the
feasibility and effectiveness of aid distribution programs in response to disasters resulting from climate change
such as floods, droughts and famines (Gbetibouo et al, 2010). The availability of health services can assist in the
provision of preventive treatments to the rural dwellers for diseases such as malaria and cholera that are
associated with climatic changes (Deressa et al, 2008b). Likewise, institutions such as microfinance often
supports rural communities by providing credits for technology packages which are important variables of
adaptive capacity to climate change; and the availability and access to good markets also help the rural people in
facilitating the sale of livestock and other farms produce in times of crisis. Therefore, communities having well
developed and organized infrastructures and institutions are considered to be better able to adapt to climatic
stresses than those with less effective infrastructure and institutional arrangements (Moss et al, 2001; Adger et al,
2004; O’Brien et al, 2004). This scenario which is common in communities of Kajuru LGA contributed to the
high adaptive capacity of the LGA. Rural people living in marginal environments and areas with low or without
infrastructures and/or institutions are those with low adaptive capacity to climate change. This is the case of
Kauru LGA with a low adaptive capacity index of 2.00, and therefore, it will likely be the most threatened to the
impacts and vulnerability of climate change because the rural people lack the capacity to support their
livelihoods which is primarily crop production.
Based on irrigation potentials, rural people in Kajuru and Kagarko LGAs with high adaptive capacities
are more likely to adapt to climate change better than those in Kauru and Ikara LGAs with low adaptive capacity.
The high adaptive capacity of Kajuru and Kagarko LGAs may not be unconnected with the presence of River
Kaduna passing through Kajuru LGA and River Gurrara passing through Kagarko LGA in which the flood
plains of these two rivers are often use for irrigation farming during the dry season. Investment in irrigation in
places with high irrigation potentials can increase the food supply of the area, the state and the country at large.
This food supply according to Deressa et al (2008b) could then be stored by the farmers and sold out during
extreme climatic events like drought and flood instead of depending on food aid.
In terms of literacy rate, the assumption is that higher literacy levels increase adaptive capacity by
increasing people’s capabilities and access to information, thereby enhancing their ability to cope with
adversities (Thornton et al, 2006; Gbetibouo et al, 2010). Based on that assumption, Kajuru LGA with high
literacy rate is therefore considered to have high adaptive capacity to climate change than Ikara LGA with low
20Journal of Environment and Earth Science www.iiste.org
ISSN 2224-3216 (Paper) ISSN 2225-0948 (Online)
Vol.5, No.20, 2015
literacy rate. Lower education according to Cutter et al, (2003) constrains the ability to understand warning
information and access to recovery information.
The mean adaptive capacity of all the LGAs showed that all the variables recorded high adaptive
capacity among the rural communities’ people of Kajuru LGA, placing the LGA as having the high adaptive
capacity to climate change (ranked 1). Here, it is important to note that all the determinants or variables of
adaptive capacity are not independent of each other (Smit and Wandel, 2006). The availability of wealth will
increase adaptive capacity of a household or community by providing greater access to farm inputs, markets,
infrastructure and institutions, and other resources that can be used to adapt to climate change impacts.
Higher literacy level (or educational attainment) always result in greater earnings and the ability of one
having access to farm inputs, infrastructures and to understand warning information and access to recovery that
can also be used to adapt to climate change (Cutter et al, 2003; Gbetibouo et al, 2010). This is the case of Kajuru
LGA where wealth and literacy level recorded high adaptive capacity. These two variables (wealth and literacy
rate) might have helped the rural people having access to other resources that could be used for climate change
adaptation, and hence the LGA is less threatened to the impacts of climate change. The presence of the two
major rivers, River Kaduna cutting through Kajuru LGA and River Gurara cutting through Kagarko LGA might
have contributed to the richness in water resources and soil nutrients particularly at the flood plains of the rivers.
This makes irrigation farming possible in these LGAs. With their moderate wealth and literacy rates, rural
people in Kagarko LGA where able to have access to farm inputs and other resources that can help them adapt to
climate change through the utilization of the irrigation potentials especially the presence of Gurara Dam. This
may be the major reason irrigation potential is considered high (3.53) among the rural people in all the
communities of the LGA. Ikara LGA on the other hand has the least adaptive capacity among the LGAs and
hence, the most threatened.
A critical examination of the mean adaptive capacity for all the LGAs show that adaptive capacity to
climate change decreases from the southern part of the state to the northern part. This may be due to the rural
people’s dependent on rain-fed agriculture for their livelihood that is climate-sensitive, which coincide with the
decrease in rainfall from the southern part of the state to the northern part. The southern part of the state
(Kafanchan) is having an annual rainfall of about 1733 mm, the central part (Kaduna) is having an annual
rainfall of about 1203 mm, while the northern part (Zaria) is having an annual rainfall of about 1032 mm.
6. Conclusion and Policy Recommendations
The capacity of individuals or households to adapt to climate change impacts is a function of their access to
resources. The mean adaptive capacity among the rural communities in all the LGAs studied show that rural
communities’ people in Kajuru LGA have the highest adaptive capacity (3.87) to the impacts of climate change
(ranked 1st), while Kauru LGA with low adaptive capacity index of 2.35 is the least (ranked 6th) and therefore, it
will likely be the most threatened LGA in the state to the impacts of climate change and vulnerability in terms of
adaptive capacity. Findings also revealed that the mean adaptive capacity for the state decreases from the
southern part to the northern part. This may be due to the rural people’s dependent on rain-fed agriculture for
their livelihood that is climate-sensitive, which also coincide with the decrease in rainfall from the southern part
to the northern part of the study area.
The study recommends the development of climate change policy that will enhance the adaptive
capacities of the rural communities at both the state and local government that is specifically geared toward more
vulnerable areas of the state with emphasis on poverty reduction. Such policies should streamline roles and
responsibilities, strategies for adaptation and mitigation of climate change, and stakeholders’ involvement in a
systematic manner; and there should be regular workshops and conferences, and international affiliations should
be used to provide updates on climate change issues.
References
Abaje, I.B. and Giwa, P.N. (2010). Flood risk assessment and vulnerability in Kafanchan town, Jema’a local
government area of Kaduna State, Nigeria. International Journal of Sustainable Development, 3(1),
94-100.
Abaje, I.B. (2007). Introduction to soils and vegetation. Kafanchan: Personal Touch Productions, (Chapter 8).
Abaje, I.B., Ati, O.F. and Iguisi, E.O. (2012a). Recent Trends and Fluctuations of Annual Rainfall in the
Sudano-Sahelian Ecological Zone of Nigeria: Risks and Opportunities. Journal of Sustainable Society,
1(2), 44-51.
Abaje, I.B., Ati, O.F. and Iguisi, E.O. (2012b). Changing Climatic Scenarios and Strategies for Drought
Adaptation and Mitigation in the Sudano-Sahelian Ecological Zone of Nigeria. In M.A. Iliya and I.M.
Dankani (Eds). Climate Change and Sustainable Development in Nigeria. Ibadan: Crown F. Publishers.
Abaje, I.B., Ishaya, S. and Usman, S.U. (2010). An Analysis of Rainfall Trends in Kafanchan, Kaduna State,
Nigeria. Research Journal of Environmental and Earth Sciences, 2(2), 89-96.
21Journal of Environment and Earth Science www.iiste.org
ISSN 2224-3216 (Paper) ISSN 2225-0948 (Online)
Vol.5, No.20, 2015
Abaje, I.B., Sawa, B.A. and Ati, O.F. (2014). Climate Variability and Change, Impacts and Adaptation Strategies
in Dutsin-Ma Local Government Area of Katsina State, Nigeria. Journal of Geography and Geology, 6
(2), 103-112.
Adger, W.N., Brooks, N., Bentham, G., Agnew, M., Eriksen, S. (2004). New Indicators of Vulnerability and
Adaptive Capacity. Technical Report 7. Norwich: Tyndall Centre for Climate Change Research.
Bartlett, J.E., Kotrlik, J.W. and Higgins, C.C. (2001). Organizational Research: Determining Appropriate Sample
Size in Survey Research. Information Technology, Learning, and Performance Journal, 19(1), 43-50
Cutter, S.L., Boruff, B.J. and Shirley, W.L. (2003). Social Vulnerability to Environmental Hazards. Social
Science Quarterly, 84 (2), 242-261.
Cutter, S.L., Emrich, C.T., Webb, J.J. and Morath, D. (2009). Social Vulnerability to Climate Variability
Hazards: A Review of the Literature. Final Report to Oxfam America. Adger, W.N., Brooks, N.,
Bentham, G., Agnew, M., Eriksen, S. (2004). New Indicators of Vulnerability and Adaptive Capacity.
Technical Report 7. Norwich: Tyndall Centre for Climate Change Research.
Deressa, T., Hassan, R.M., Alemu, T., Yesuf, M., and Ringler, C. (2008a). Analyzing the Determinants of
Farmers’ Choice of Adaptation Methods and Perceptions of Climate Change in the Nile Basin of
Ethiopia. International Food Policy Research Institute (IFPRI), (36 pp). Discussion Paper 00798.
Deressa, T., Hassan, R.M., and Ringler, C. (2008b). Measuring Ethiopian Farmers’ Vulnerability to Climate
Change across Regional States. International Food Policy Research Institute (IFPRI), (32 pp).
Discussion Paper 00806.
Dolan, A.H. and Walker, I.J. (2003). Understanding vulnerability of coastal communities to climate change
related risks. Journal of Coastal Research, Special Issue 39, 2004.
Fothergill, A. and L. Peek (2004). Poverty and Disasters in the United States: A Review of Recent Sociological
Findings. Natural Hazards, 32(1), 89-110.
Fussel, H. and Klein, R.J.T. (2006). Climate Change Vulnerability Assessments: An Evolution of Conceptual
Thinking. Climatic Change, 75, 301-329
Gbetibouo, G. A., Ringler, C., and Hassan, R. (2010). Vulnerability of the South African Farming Sector to
Climate Change and Variability: An Indicator Approach. Natural Resources Forum, 34, 175-187.
IPCC. (2001). Climate Change 2001: Adaptation to Climate Change in the Context of Sustainable Development
and Equity. Contribution of Working Group II to the Third Assessment Report of the
Intergovernmental Panel on Climate Change (pp 877-912). Cambridge, United Kingdom, and New
York, NY, USA: Cambridge University Press.
Ishaya, S. and Abaje, I.B. (2008). Indigenous People’s Perception on Climate Change and Adaptation Strategies
in Jema’a Local Government Area of Kaduna State, Nigeria.
Kuriakose, A.T., Bizikova, L. and Bachofen, C.A. (2009). Assessing Vulnerability and Adaptive Capacity to
Climate Risks: Methods for Investigation at Local and National Levels. Social Development Working
Papers, Paper No. 116
McCurry, P. (1989). A General Review of the Geology of the Precambrian to the Lower Palaezoic Rocks of
Northern Nigeria. In Kogbe, C.A. (Ed.). Geology of Nigeria. 2nd Revised Edition (pp 13-37). Jos: Rock
View (Nigeria) Limited.
Moser, C. and Satterthwaite, D. (2008). Towards pro-poor adaptation to climate change in the urban centers of
low-and middle-income countries. Climate Change and Cities Discussion Paper 3. London, UK: IIED.
Moss, R.H., Brenkert, A.L., and Malone, E.L. (2001). Vulnerability to Climate Change: A Quantitative
Approach. U.S. Department of Energy. PNNL-SA-33642. Retrieved from
http://www.globalchange.umd.edu/data/publications/Vulnerability_to_Climate_Change.PDF
Nelson, R., Kokic, P., Crimp, S., Martin, P., Meinke, H., Howden, S.M., …. Nidumolu, U. (2010). The
vulnerability of Australian rural communities to climate variability and change: Part II-Integrating
impacts with adaptive capacity. Environmental Science and Policy, 13, 18-27
Noble, I., Huq, S., Anokhin, Y., Carmin, J., Goudou, D., Lansigan, F..... Wright, H. (2014). Adaptation Needs
and Options. In Patt, A. and Takeuchi, K. (Eds), Climate Change 2014: Impacts, Adaptation and
Vulnerability, (51 pp). Contribution of Working Group II to the Fifth Assessment Report of the
Intergovernmental Panel on Climate Change. United Kingdom and New York, NY, USA: Cambridge
University Press.
O’Brien, K.L., Leichenko, R.M., Kelkar, U., Venema, H.M., Aandahl, G., Tompkins, H…. West, J. (2004).
Mapping Vulnerability to Multiple Stressors: Climate Change and Globalization in India. Global
Environmental Change, 14 (2004), 303–313.
Odekunle, T.O. (2006). Determining Rainy Season Onset and Retreat over Nigeria from Precipitation Amount
and Number of Rainy Days. Theor. Appl. Climatol. 83, 193–201.
Odekunle, T.O., Andrew, O. and Aremu, S.O. (2008). Towards a Wetter Sudano-Sahelian Ecological Zone in
Twenty First Century Nigeria. Weather, 63 (3).
22Journal of Environment and Earth Science www.iiste.org
ISSN 2224-3216 (Paper) ISSN 2225-0948 (Online)
Vol.5, No.20, 2015
Olmos, S. (2001). Vulnerability and Adaptation to Climate Change: Concepts, Issues, Assessment Methods.
Climate Change Knowledge Network. Retrieved from
http://www.iisd.org/cckn/pdf/va_foundation_final.pdf
Ruhl, J.B. (2011). General Design Principles for Resilience and Adaptive Capacity in Legal Systems — With
Applications to Climate Change Adaptation. North Carolina Law Review, Vol. 89.
Sawa, B.A. (2002). Trend in the Temporal Variability of Occurrence of Wet and Dry Spells North of Latitude
100N in Nigeria. In Iguisi, E.O. (Ed.). The Zaria Geographer, 15 (1), 34-41.
Smit, B. and Wandel, J. (2006). Adaptation, Adaptive Capacity and vulnerability. Global Environmental Change,
16, 282-292.
Thornton, P.K., Jones, P.G., Owiyo, T., Kruska, R.L., Herrero, M., Kristjanson, P.,…Kulkar, U. (2006).
Mapping Climate Vulnerability and Poverty in Africa. Report to the Department for International
Development. International Livestock Research Institute (ILRI). Retrieved from
http://filestore.wikiadapt.org/AMCEN/Africavulnerability/MappingClimateVulnerabilityandPovertyin
Africa.pdf
Wall, E. and Marzall, K. (2006). Adaptive Capacity for Climate Change in Canadian Rural Communities. Local
Environment, 11 (4), 373–397
Yohe, G. and Tol, R. (2002). Indicators for social and economic coping capacity-moving towards a working
definition of adaptive capacity. Global Environmental Change, 12, 25-40.
23You can also read