ASTRO2020 PROJECT WHITE PAPER
←
→
Page content transcription
If your browser does not render page correctly, please read the page content below
Astro2020
Project
White
Paper
ATLAS
Probe:
Breakthrough
Science
of
Galaxy
Evolution,
Cosmology,
Milky
Way,
and
the
Solar
System
Lead
Author:
Name:
Yun
Wang
Institution:
California
Institute
of
technology
Email:
wang@ipac.caltech.edu
Phone:
(626)
395-‐1415
Co-‐authors:
Mark
Dickinson
(NOAO),
Lynne
Hillenbrand
(Caltech),
Massimo
Robberto
(STScI
&
JHU),
Lee
Armus
(Caltech/IPAC),
Mario
Ballardini
(Western
Cape,
South
Africa),
Robert
Barkhouser
(Johns
Hopkins
Univ.),
James
Bartlett
(JPL),
Peter
Behroozi
(Univ.
of
Arizona),
Robert
A.
Benjamin
(Univ.
of
Wisconsin
Whitewater),
Jarle
Brinchmann
(Porto,
Portugal;
Leiden,
Netherlands),
Ranga-‐Ram
Chary
(Caltech/IPAC),
Chia-‐Hsun
Chuang
(Stanford),
Andrea
Cimatti
(Univ.
of
Bologna,
Italy),
Charlie
Conroy
(Harvard),
Robert
Content
(Australia
Astronomical
Obs.),
Emanuele
Daddi
(CEA,
France),
Megan
Donahue
(Michigan
State
Univ.),
Olivier
Dore
(JPL),
Peter
Eisenhardt
(JPL),
Henry
C.
Ferguson
(STScI),
Andreas
Faisst
(Caltech/IPAC),
Wesley
C.
Fraser
(Queen’s
Univ.
Belfast,
U.K.),
Karl
Glazebrook
(Swinburne
Univ.
of
Technology,
Australia),
Varoujan
Gorjian
(JPL),
George
Helou
(Caltech/IPAC),
Christopher
M.
Hirata
(Ohio
State
Univ.)
Michael
Hudson
(Univ.
of
Waterloo,
Canada),
J.
Davy
Kirkpatrick
(Caltech/IPAC),
Sangeeta
Malhotra
(GSFC),
Simona
Mei
(Paris
Obs.,
Univ.
of
Paris
D.
Diderot,
France),
Lauro
Moscardini
(Univ.
of
Bologna,
Italy),
Jeffrey
A.
Newman
(Univ.
of
Pittsburgh),
Zoran
Ninkov
(Rochester
Insti.
of
Tech.),
Alvaro
Orsi
(CEFCA,
Spain),
Michael
Ressler
(JPL),
James
Rhoads
(GSFC),
Jason
Rhodes
(JPL),
Russell
Ryan
(STScI),
Lado
Samushia
(Kansas
State
Univ.),
Claudia
Scarlata
(Univ.
of
Minnesota),
Daniel
Scolnic
(Duke
Univ.),
Michael
Seiffert
(JPL),
Alice
Shapley
(UCLA),
Stephen
Smee
(Johns
Hopkins
Univ.),
Francesco
Valentino
(Univ.
of
Copenhagen,
Denmark),
Dmitry
Vorobiev
(Univ.
of
Colorado),
Risa
H.
Wechsler
(Stanford)
Type
of
Activity:
Space-‐based
Project
0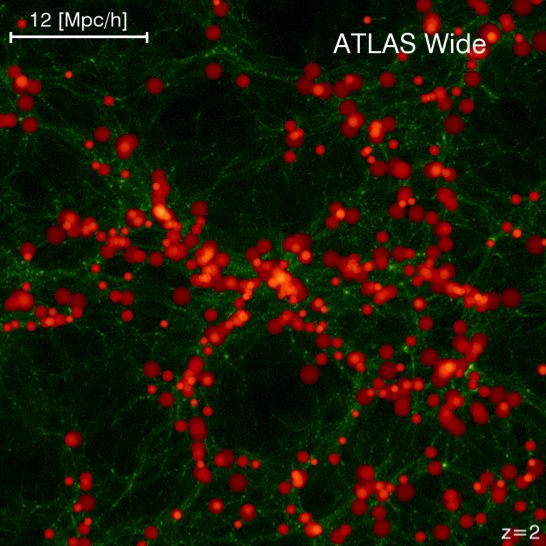
I.      ATLAS Probe: Key Science Goals and Objectives
   The observational data from recent years have greatly improved our understanding of the Universe.
However, we are far from understanding how galaxies form and develop in the context of an evolving
“cosmic web” of dark matter, gas and stars, and the nature of dark energy remains a profound mystery 20
years after the discovery of cosmic acceleration. Understanding galaxy evolution in the context of large-
scale structure is of critical importance in our quest to discover how the Universe works. This requires very
large spectroscopic surveys at high redshifts: very large numbers of galaxies over large co-moving volumes
for robust statistics in small redshift bins ranging over most of cosmic history. In particular, we need to map
the cosmic web of dark matter using galaxies through most of cosmic history. This requires a redshift
precision of ~0.0001 (i.e., R=1000 slit spectroscopy), and continuous IR wavelength coverage only possible
from space. These observational requirements also enable definitive measurements on dark energy with
minimal observational systematics by design. A very high number density wide area galaxy redshift survey
(GRS) spanning the redshift range of 0.5
Discover the bulk compositional building blocks of planetesimals formed in the outer Solar System. These
flow down to the ATLAS Probe Scientific Objectives: (1A) Trace the relation between galaxies and dark
matter with less than 10% shot noise on relevant scales at 1
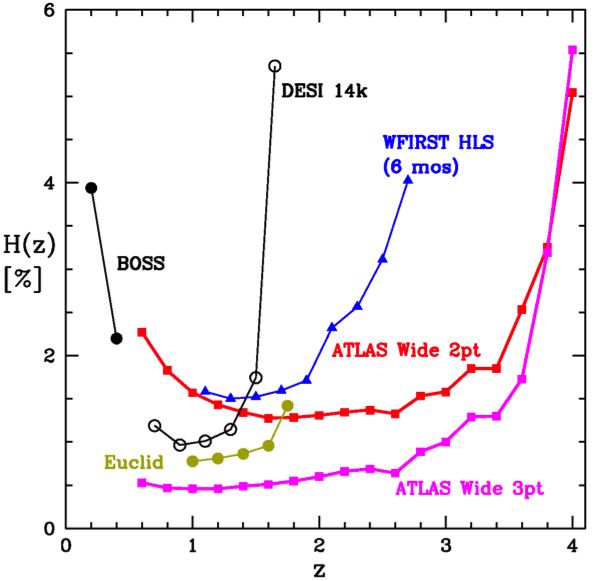
Fig.2: The spatial distribution of Hα-emitting galaxies at z=2 from the semi-analytical galaxy formation model GALFORM. Each
 panel illustrates a different survey of the same galaxy distribution, with redshift accuracy σz/(1+z) equal to (a) 10-2 (most
 optimistic photo-zs); (b) 10-3 (slitless spectroscopy); and (c) 10-4 (ATLAS slit spectroscopy).

Terlevich 1981). [OIII] luminosities will provide a measure of the accretion luminosities and black hole
growth rates. ATLAS will connect AGN activity to local and large-scale environment with exquisite statistical
accuracy that is only possible today in the local universe.
   Current observations indicate that the intergalactic medium (IGM) completed its transition from neutral to
ionized around z ~ 6, but the processes responsible are poorly understood. Reionization may have been
highly inhomogeneous, with expanding bubbles driven by strongly clustered young galaxies that are highly
biased tracers of dark matter structure. Future radio facilities (LOFAR, HERA, SKA, ASKAP) will map (at
least statistically) the distribution of neutral hydrogen in the epoch of reionization. ATLAS surveys will
provide complementary maps of the spatial distribution of the (potentially) ionizing galaxies themselves
over the same volumes, detecting [OIII]+Hβ emission lines at 5
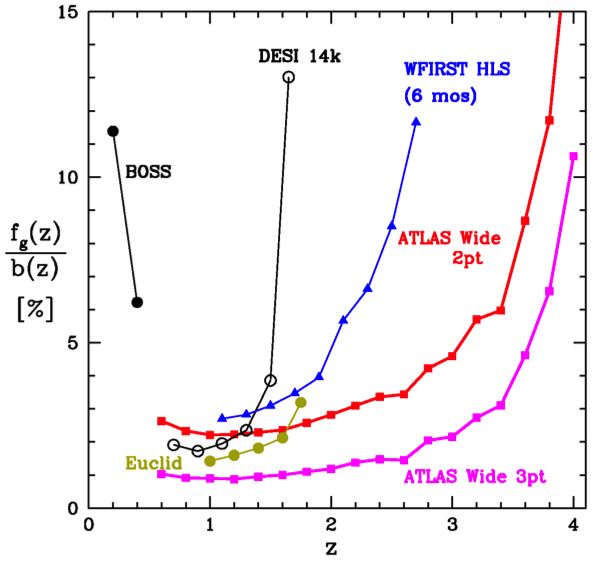
measurements provide a direct
measurement of H(z) and angular
diameter distance DA(z) (Blake &
Glazebrook 2003; Seo & Eisenstein
2003), and the redshift-space
distortions        (RSD)        enable
measurement of fg(z) (Guzzo et al.
2008; Wang 2008). ATLAS Wide
provides multiple galaxy tracers of
BAO/RSD (red galaxies, different
emission-line selected galaxies, and Fig.3. Expected H(z) and f (z) from future surveys. “2pt” refers to galaxy power
                                                                  g
WL shear selected galaxies) over spectrum, “3pt” refers to galaxy bispectrum. Constraints are derived following
0.5
understanding of the 3D Milky Way beyond the ongoing revolution provided by ESA/Gaia, especially in the inner Galaxy (|l|
confidently identified in the spectra of small (D≲500km) KBOs. This is largely the result of the lack of
identifying absorption features in the λ≲2.5µm region, beyond which current facilities are insufficiently
sensitive to gather observations of these bodies. This is unfortunate, as many anticipated materials exhibit
strong absorption features at these longer IR wavelengths (Parker et al., 2016).
Notably, no silicate materials, commonly identified by Fe/Mg absorptions at ~1µm, and deep hydroxl
feature at 3.0µm, have ever been detected in the spectra of KBOs. This represents one of the big
outstanding gaps in our compositional knowledge of these bodies. From our best proxy of the spectra of
KBOs - Phoebe - it is clear that ATLAS Probe has the potential to detect such features, as it will provide the
requisite SNR throughout the important 1-4µm wavelength range.
Spectra of KBOs will come from two separate ATLAS surveys. The ATLAS Wide Survey will gather
useful IR reflectance spectra of roughly 300 KBOs. These spectra will provide NIR spectral slopes, as well
as a measure of water-ice absorption. For the brightest targets, silicate detection is possible. The ATLAS
Solar System Survey, with pointed observations of known bodies, would gather more than 3000 spectra,
down to a practical brightness limit of r~23.2, for on-target integrations of 2500s. All such bodies have, or
will be detected and tracked by the LSST, or the Pan-STARRS surveys, and the resultant spectra will have
higher SNR than typical from the spectra gathered during the ATLAS Wide Survey.
II. ATLAS Probe: Technical Overview
To meet its science objectives, ATLAS requires a ~1.5m space telescope in an L2 orbit (Fig.4), with a
multi-object spectrograph with R~1000 over a FoV ~0.4 deg2, with spectroscopic multiplex of ~6000, and
the wavelength coverage of 1-4µm.
(i) ATLAS Probe Instrument
Optical Design: ATLAS has only one instrument consisting of 4 identical modules, compact and modular;
it fits below the primary mirror structure into a cylindrical envelope only slightly larger than 1.5m in diameter
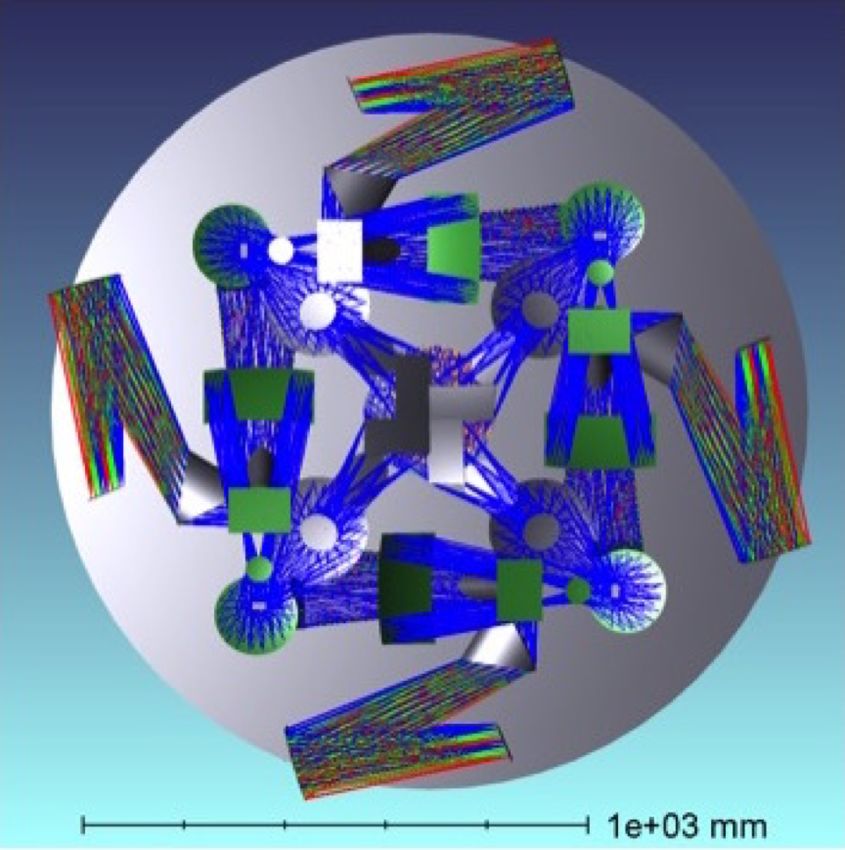
(the size of the primary) and ~65cm in height (see Fig.5). The instrument size can be reduced in a future
design phase. The camera optics image a square 0.75ʺ″ field onto a little less than 2 x 2 pixels on the
detector, delivering a scale of about 0.385ʺ″ pixel. The footprint of the DMD on each NIR detector is about
4,000 x 2,100 pixels. The scale can easily be changed in the spectral direction to at least 2.1 pixel/micro-
mirror because of the unused space on the 4k×4k detector. The instrument is maintained at temperatures
Fig.4: ATLAS Probe orbit.
Fig.5: A full view of the preliminary optical design for
the ATLAS Probe instrument. The large gray circle is
the back of the primary.
6~50K to keep thermal noise below zodiacal light TELESCOPE
level. Our preliminary optical design already has Type modified Ritchey-Chrétien
excellent image quality in the spectrograph. The Primary: diameter & focal ratio 150cm; f/1.6
Gaussian Equivalent Full Width at Half Maximum Primary: central obscuration 19% diameter (3.7% area)
(GEFWHM) is about 1/2 of a DMD micro-mirror Secondary: diameter 29 cm
Telescope focal ratio f/11.2
image. The image quality of the fore-optics on PYRAMID MIRROR 4 rectangular faces
the DMD is 1/2 of a micro-mirror, satisfactory at Size 4 ×13.6 cm×7.4 cm
this point of the preliminary design. Table 1 lists Field of view 4 ×25.60ʹ′×13.50ʹ′
the main parameters of our system. For a FORE OPTICS
detailed discussion of the ATLAS instrument, see f/# (off axis) f/2.3×f/2.5
Wang et al. (2019a). Scale on DMD (slit size) 0.75ʺ″×0.75ʺ″/micro-mirror
Target Selection Mechanism: The ATLAS COLLIMATOR
instrument requirement of a spectroscopic Elements 4 mirrors (+ 1 dichroic)
DISPERSING ELEMENTS
multiplex factor of ~6000 drives the adoption of
Wavelength ranges 1-2.1µm (NIR); 2.1-4µm (MIR)
DMDs as the target selection mechanism. DMDs Resolving power R ~ 1000
have been invented for digital display/projection Type prism
applications by Texas Instruments. ATLAS CAMERAS
baselines the 2k CINEMA model with 2048×1080 Elements 1 mirror (each camera)
micro-mirrors, 13.7µm on a side. Each micro- Sampling on detector 0.38ʺ″×0.39ʺ″ (pixel scale)
Table 1: ATLAS main optical parameters.
mirror of the DMD’s can tilt ±12° to separate the
reflected “ON” vs. “OFF” beam. Therefore a
DMD, perpendicularly illuminated, must receive a beam slower than f/2.4 to prevent overlap between the
input and output beams, setting an upper limit to the scale per micro-mirror, and therefore to the total FoV
of the spectrograph.
Detectors and ASICs: Our baseline detector is the Teledyne H4RG-10, the same type currently under
development for WFIRST. The long-wavelength cutoffs of our spectroscopic channels (2.1µm and 4µm)
are compatable with the standard ~2.35µm and ~5.37µm cutoff of WFIRST and JWST devices
respectively. Fine-tuning the Hg vs. Cd stoichiometric ratio can further reduce the long wavelength cutoff
and therefore the dark current, allowing warmer operating temperatures. H4RG arrays tested by WFIRST
have typical QE>90% in the 0.8-2.35µm range, readout noise ~15e in Double Correlated Mode and mean
dark currentchanges related to the spacecraft attitude. Mission • Astrophysics IR all sky observer (galaxy
Note that for a survey telescope the attitude redshift survey)
can be more easily maintained within optimal • L2 Orbit
range than for a general observatory (like • Class B Mission
e.g. HST or JWST) where the pointing and • Dual string spacecraft bus
Constraints • Tight pointing stability
orientation are driven by the science
– Driven by slit size of 0.75”
programs, impacting optimal scheduling. – Requires +/- 0.375” 3-sigma
Table 2 summarizes ATLAS mission • ~40-60 K detector temperature (in family with
implementation requirements. We have other passively cooled similar missions)
assumed that solar panels can be integrated • Sunlight cannot contact telescope
• Long exposures (up to days)
with bottom sun shield / bottom deck of
Measurement • 4 identical spectrometers covering 1-4 µm
spacecraft. Thermal solutions adopted for Data Volumes • ~600Mb every 500 seconds, for 170 samples
similar class missions are adequate for per day
ATLAS’s 4 spectrometers. • ~186 Tb over 5 years
Mass Estimates: ATLAS instrument mass Commanding Weekly commanding cycle once on orbit.
were derived by scaling results from Table 2:. ATLAS Probe mission implementation requirements.
studies of similar class missions. A Detectors Focal Plane Spectrometer Spectrometer Spectrometer
single spectrometer mass and costs is (#) mass (kg) min mass (kg) mode mass (kg) max mass (kg)
scaled by the number of detectors, for 2 2.4 26.6 39.9 79.7
a total of 4 identical spectrometers Telescope Diameter (m) Telescope Telescope mode Telescope max
using 2 H4RG detectors each. The min mass (kg) mass (kg) mass (kg)
focal plane mass/costs are scaled from
1.5 214.8 350.1 485.5
a similar study with H2RG detectors.
Payload Payload min Payload mode Payload max
Rules of thumb were applied to
mass (kg) mass (kg) mass (kg)
calculate spectrometer mass and costs
from focal plane mass/cost. The 321.1 509.6 804.4
telescope mass was calculated Table 3: Estimated instrument mass for ATLAS Probe.
from telescope diameter, using a Payload Mass Bus Mass Bus Cost
linear fit derived from similar Estimate Estimate Estimate
study results to estimate mass Minimum Payload Mass 321 kg 618 kg $140.05
as a function of diameter. The
Mean Payload Mass 510 kg 981 kg $216.41
error in the fit was used to
calculate max and min probable Maximum Payload Mass 804 kg 1548 kg $335.82
mass. The payload mass is 70% Values 598 kg 1150 kg $252.08
given as the sum of 4
spectrometers plus the
Maximum mass EELV Capability (kg) 3400 LV margin uses an average L/V
telescope, with estimated
estimate used for Total ATLAS MEV Mass (kg) 2352 adapter mass of 30 kg and
minimum, mode, and maximum margin calculations propellant mass of 161.7 kg
payload mass, see Table 3. NASA Margin (%) 48%
ATLAS spacecraft mass
Table 4: Estimated spacecraft mass and cost for ATLAS Probe.
estimate is based on scaling of
similar missions using the total
payload mass (Telescope + 4 Spectrometers), see Table 4. Estimated minimum, mode, and maximum
mass are given, as well as 70th percentile confidence spacecraft mass. Payload mass estimates are used
to generate spacecraft bus estimates using historical average Mass/Payload ratios. Bus cost estimates are
generated using another relationship between astrophysics spacecraft mass to cost ratios. The bus costs
have been increased by $10M to accommodate out-of-family pointing requirements.
8Ground System Design: The ATLAS Ground system is based on TCM 1 Clean up 25m/s
a mission specific implementation of the standard JPL mission Halo orbit insertion + Clean up 25m/s
operations and ground data systems. During Phase E, ATLAS Station Keeping /year 4m/s
spacecraft will cruise to Sun-Earth L2 and enter HALO orbit, and Total over 5 years 70m/s
perform surveys per plan to meet science objectives. ATLAS will Table 5: Delta V budget for ATLAS
observe most of each day, permitting ~25 minutes/day for Probe.
miscellaneous spacecraft (S/C) activities that may impact
observation (S/C trim maneuvers, wheel desats, antenna pointing…). Science downlink is planned for once
a week for 2 hours which can be concurrent with science observations. The ground network utilizes the
DSN 34m BWG subnet, the Near Earth Ka-band for High Rate science downlink, 150 Mb/s data rate.
Excluding protocol overhead, this becomes effectively 130 Mb/s science downlink. The uplink and
engineering data can be X-/S-band via S/C LGA. During cruise, 2-3 passes will be made per week. During
science phase, 1-2 passes will be made per week as needed; nominally 1 pass will be adequate. Table 5
shows the Delta V budget for the ATLAS Mission Design & Navigation.
III. ATLAS Probe: Technology Drivers
DMDs and Controller: The DMD is the core of our system. We base our design on the 2k CINEMA
model of 2048×1080 micro-mirrors, 13.7µm on a side. DMDs have been successfully used on ground-
based spectrographs like RITMOS (Meyer et al. 2004) and IRMOS (MacKenty et al. 2006). A new DMD-
based spectrograph, SAMOS, is under construction for the SOAR telescope in Chile (Robberto et al. 2016).
NASA has funded a Strategic Astrophysics Technology (SAT) program (PI Ninkov, ATLAS team member)
to raise the TRL level of DMDs to TRL5-6 before the 2020 Decadal Survey. DMDs have successfully
passed proton and heavy-ion irradiation testing (Fourspring et al. 2013,Travinsky et al. 2016). Following
NASA General Environmental Verification Standard (GEVS), the team performed random vibration, sine
burst, and mechanical shock testing of manufacturer-sealed DMDs (Vorobiev et al. 2016) and of devices
re-windowed for better UV and IR capabilities (Quijada et al. 2016). These GEVS tests suggest that DMDs
are robust and insensitive to the potential vibroacoustic environments experienced during launch. Low-
temperature testing of DMDs were also performed, the main concern being micro-mirror stiction. Tests at
RIT have shown that temperatures as low as 130 K do not affect the performance of DMDs. More recent
data obtained at JHU at ~80K confirm these results. A general overview of the results obtained by these
test campaigns has been recently presented (Travinsky et al. 2017).
These findings place DMDs between TRL levels 5 and 6 (note that level 6 requires testing against the
specific environment of a mission, thus is only achievable after a mission has been identified, e.g., ATLAS
at L2). DMDs are normally controlled by commercially available boards based on the DLP Discovery 4100
chipset produced by Texas Instruments. The chipset is not designed to operate in a cryogenic environment
or in space. ATLAS team members at JHU have successfully developed custom electronics to operate
Cinema DMDs at cryogenic temperatures. For ATLAS, we intend to produce a version of this system based
on rad-hard components, suitable for operations at L2.
IV. ATLAS Probe: Organization, Partnerships, and Current Status
The ATLAS Probe Collaboration currently has ~50 members, including scientists from the U.S., Italy,
France, Spain, Portugal, Canada, Australia, and other countries. The PI is Yun Wang (Caltech). Massimo
Robberto (STScI & JHU) is the Instrument Lead. Mark Dickinson (NOAO) and Lynne Hillenbrand
(Caltech) are Science Leads. We expect that JPL will be the primary partner for ATLAS Probe. JPL funded
a high-level TeamX cost study of ATLAS probe in June 2019. The pathfinder for ATLAS, ISCEA (Infrared
SmallSat for Cluster Evolution Astrophysics), has been selected by NASA for a mission concept study.
9V. ATLAS Probe: Schedule Schedule (months)
Table 6 shows the schedule for ATLAS Probe estimated from JPL’s Team X Phase A 12
schedule reference model, using the closest analog missions. It includes one Phase B 12
month schedule reserves for each year in development with 2 months held in Phase C 22
ATLO which are fully funded reserves and included in the cost estimate. Design 10
VI. ATLAS Probe: Cost Estimate Fabrication 6
The ROM cost estimate for ATLAS in Table 7 is based on this methodology: (1) Subsystem I&T 6
The telescope OTA is from the Stahl Model. (2) The spectrometer(s) cost Phase D 18
distribution is scaled from similar class missions and JPL rules of thumb. (3) The System I&T 14
spacecraft is based on triangular distribution of Probe class spacecraft busses. (4) Launch Operations 4
Mission Operations and Ground Data System are costed by JPL subsystem
engineers. (5) WBS elements 1-4 and 10 are based on their historical relationship Phase E 60
to WBS 5 & 6. (6) Standard schedule used for all Probe class missions is applied. Phase F 4
$26.64M (FY19$) total telescope cost was calculated using the ‘Phillip Stahl Table 6: Estimated
ATLAS Probe schedule.
Model’. The focal plane costs are scaled from the number of detectors compared
to similar studies. Rules of thumb have been applied to go from focal plane costs
to first unit spectrometer
WBS WBS Title Cos Estimate Method Min A-D Max E-F
cost. The other 3 No. Mode
spectrometers are 01 Project Mgmt. % Wrap from similar studies $9.5 $14.0 $22.5 $4.3
assumed to be 40% initial
02 Project Sys. Eng. % Wrap from similar studies $12.5 $18.5 $29.7
unit costs. The focal plane
is estimated to cost 03 S&MA % Wrap from similar studies $12.9 $19.2 $30.7
~$5.87M, with the 4 04 Science % Wrap from similar studies $12.5 $18.5 $29.7 $31.8
spectrometers costing 05 Payload Sys. Subtotal of below $105.2 $147.6 $247.7
$75.49M, $116.67M, and 05.01 Payload Sys. Mgmt. % Wrap from similar studies $1.68 $2.36 $3.96
$213.89M (min, mode,
05.02 Payload Sys. Eng. % Wrap from similar studies $1.37 $1.92 $3.22
max). The ground system
cost is based on Quick 05.04 Optical Instrument Instrument ROT $75.49 $116.67 $213.89
Model run based on 05.05 Telescope Stahl Model $26.64 $26.64 $26.64
characteristics of the 06 Spacecraft Sys. $/kg from similar studies $140.1 $216.4 $335.8
mission, with development
07 MOS % Wrap from similar studies $18.6 $18.6 $18.6 $16.4
$31M FY19, operations
$21M FY19 W/O MD/Nav 08 LVS AO provided $150.0
support. The assumed 09 GDS % Wrap from similar studies $19.5 $19.5 $19.5 $6.7
MD/Nav is ~$7M for 10 Project Sys. I&T % Wrap from similar studies $15.1 $22.4 $35.8
development, ~$2.5M for Reserves % Wrap from similar studies $103.71 $148.40 $231.01 $8.88
operations.
Total Total of above $449.4 $643.1 $1,001.0 $218.1
The cost information
contained in this
document is of a Total A-F $667.5 $861.2 $1,219.1
budgetary and planning Cost Target (incl LV) $1,000.0 $1,000.0 $1,000.0
nature and is intended for A-D Reserves 30% Difference $332.5 $138.8 -$219.1
informational purposes E-F Reserves 15%
only. It does not constitute
a commitment on the part
70th percentile cost $975.7
of JPL and/or Caltech.
Table 7. ATLAS Probe ROM cost estimate in $M.
10References
Baldwin, J.A., Phillips, M.M., & Terlevich, R. 1981, PASP, 93, 5, “Classification parameters for the
emission-line spectra of extragalactic objects”
Behroozi, P., et al., 2013, ApJ, 770, 57, “The Average Star Formation Histories of Galaxies in Dark Matter
Halos from z = 0-8”
Behroozi, P., et al., 2019, “Astro2020: Empirically Constraining Galaxy Evolution”, Astro2020 science white
paper, arXiv:1903.04509
Blake, C., & Glazebrook, K., 2003, ApJ, 594, 665B, “Probing Dark Energy Using Baryonic Oscillations in
the Galaxy Power Spectrum as a Cosmological Ruler”
Castellano, M., et al. 2016, ApJL, 818, L3, “First Observational Sopport for Overlapping Reionized Bubbles
Generated by a Galaxy Overdensity”
Clampitt, J.; Miyatake, H.; Jain, B.; & Takada, M., 2016, MNRAS, 457, 2391, “Detection of stacked
filament lensing between SDSS luminous red galaxies”
Dickinson, M., et al., 2019, “Observing Galaxy Evolution in the Context of Large-Scale Structure”,
Astro2020 science white paper, arXiv:1903.07409
Epps, S.D. & Hudson, M.J. , 2017, MNRAS, 468, 2605, “The Weak Lensing Masses of Filaments between
Luminous Red Galaxies”
Fourspring , K., et al. 2013, Optical Eng. 52(9), 091807, “Proton radiation testing of digital micromirror
devices for space applications”
Gagrani, P., & Samushia, L., 2017, MNRAS, 467, 928 , “Information Content of the Angular Multipoles of
Redshift-Space Galaxy Bispectrum”
Guzzo, L., et al., 2008, Nature, 451, 541, “A test of the nature of cosmic acceleration using galaxy redshift
distortions”
Hounsell, R., et al., 2018, ApJ, 867, 23, “Simulations of the WFIRST Supernova Survey and Forecasts of
Cosmological Constraints”
Jullo, E., et al., 2010, Science, 329, 924, “Cosmological Constraints from Strong Gravitational Lensing in
Clusters of Galaxies”
MacKenty, J. et al. 2006, SPIE, 6269, 15 , “Commissioning of the IRMOS MEMS spectrometer”
McDonald, P.; Seljak, U., 2009, JCAP, 10, 007, “How to evade the sample variance limit on measurements
of redshift-space distortions”
11Meyer, R.D., et al., 2004, SPIE. 5492, 200, “RITMOS: a micromirror-based multi-object spectrometer”
More, S., Miyatake, H., Takada, M., et al. 2016, ApJ, 825, 39, “Detection of the Splashback Radius and
Halo Assembly Bias of Massive Galaxy Clusters”
Moster B. P., Naab T., White S. D. M., 2013, MNRAS 428, 3121, “Galactic star formation and accretion
histories from matching galaxies to dark matter haloes”
Parker, A. et al., 2016, PASP, 128, 8010, “Physical Characterization of TNOs with the James Webb Space
Telescope”
Perlmutter, S., et al. 1999, ApJ, 517, 565, “Measurements of and from 42 High-Redshift Supernovae”
Pisani, A., et al., 2019, “Cosmic voids, a novel probe to shed light on our Universe”, Astro2020 science
white paper, arXiv:1903.05161
Quijada, M., et al. 2016, SPIE, 9912, 99125V-1, “Optical evaluation of digital micromirror devices (DMDs)
with UV-grade fused silica, sapphire, and magnesium fluoride windows and long-term reflectance of bare
devices”
Riess, A., et al. 1998, AJ, 116, 1009, “Observational Evidence from Supernovae for an Accelerating
Universe and a Cosmological Constant”
Robberto, M.; et al. 2016, Proceedings of the SPIE, 9908, 99088, “SAMOS: a versatile multi-object-
spectrograph for the GLAO system SAM at SOAR”
Samushia, L., et al., 2019, in preparation
Seo, H., Eisenstein, D., 2003, ApJ, 598, 720, “Probing Dark Energy with Baryonic Acoustic Oscillations
from Future Large Galaxy Redshift Surveys”
Spergel, D.N., et al., 2015, WFIRST SDT Final Report, arXiv:1503.03757
Sullivan, M. et al. 2010, MNRAS, 406, 782, “The dependence of Type Ia Supernovae luminosities on their
host galaxies”
Tilvi, V., et al. 2014, ApJ, 794, 5, “Rapid Decline of Lyα Emission toward the Reionization Era”
Tojeiro, R., et al., 2017, MNRAS, 470, 3720, “Galaxy and Mass Assembly (GAMA): halo formation times
and halo assembly bias on the cosmic web”
Travinsky, A. et al. 2016, Optical Eng. 55(9), 094107, “Effects of heavy ion radiation on digital micromirror
device performance”
Travinsky, A.; et al., 2017, J. of Astronomical Telescopes, Instruments, and Systems, 3(3), 035003,
“Evaluation of digital micromirror devices for use in space-based multiobject spectrometer application”
12Valogiannis, G. & Bean, R. 2018, PRD, 97, 023535, “Beyond δ: Tailoring marked statistics to reveal
modified gravity"
Valogiannis, G. & Bean, R. 2019, “Convolution Lagrangian Perturbation Theory for biased tracers beyond
general relativity”, arXiv1901.03763
Vorobiev, D. et al. 2016, SPIE, 9912, 99125M-1, “Shock and vibration testing of digital micromirror devices
(DMDs) for space-based applications”
Wang, Y., 2008, JCAP05, 021, “Differentiating dark energy and modified gravity with galaxy redshift
surveys”
Wang, Y.; Chuang, C.-H.; Hirata, C.M., 2013, MNRAS, 430, 2446, “Towards more realistic forecasting of
dark energy constraints from galaxy redshift surveys”
Wang, Y., et al. 2019a, PASA, 36, e015, 31 pages, “ATLAS Probe: Breakthrough Science of Galaxy
Evolution, Cosmology, Milky Way, and the Solar System” (arXiv:1802.01539)
Wang, Y., et al. 2019b, “Illuminating the dark universe with a very high density galaxy redshift survey over a
wide area”, Astro2020 science white paper, arXiv:1903.06034
Yankelevich, V.; Porciani,C., 2019, MNRAS, 483, 2078, “Cosmological information in the redshift-space
bispectrum”
13You can also read