Astrometric surveys: Solving the Milky Way puzzle with Gaia
←
→
Page content transcription
If your browser does not render page correctly, please read the page content below
EPJ Web of Conferences 19, 09002 (2012)
DOI: 10.1051/epjconf/20121909002

C Owned by the authors, published by EDP Sciences, 2012

Astrometric surveys: Solving the Milky Way puzzle with Gaia
A.G.A. Browna

Leiden Observatory, Leiden University, PO Box 9513, 2300 RA Leiden, The Netherlands

         Abstract. In this contribution I provide a brief summary of ongoing and future astrometric surveys and then
         focus on presenting the current status and expected scientific performance of the Gaia mission, scheduled
         for launch in 2013.

1. ASTROMETRIC SURVEYS OF OUR GALAXY

The results from the Hipparcos mission are a powerful demonstration of the value of high accuracy
all-sky astrometry for studies of the structure and formation history of the Milky Way. The results from
the Sloan Digital Sky Survey on the other hand show the power of surveys covering large fractions of
the volume of our Galaxy with uniform and high quality photometry. We are now poised to enter an
era of surveys that will enable us to combine the power of high accuracy astrometry with a large reach
within the Milky Way. The resulting map of the Galaxy’s phase space and the characterization of its
stellar populations will ultimately enable us to assemble the puzzle of the Milky Way.
     Past, present, and future astrometric surveys were reviewed recently for the IAU Symposium
‘A Giant Step: from Milli- to Micro-arcsecond Astrometry’ [1]. An overview of the various programmes
was given as well as a description of parameter space that defines astrometric surveys. The latter was
used to try and identify gaps in the present astrometric programmes and thus fruitful directions for
future astrometric surveys. Figure 1 is an update of figure 2 in [1] and shows that with the cancellation
of the SIM Lite mission the only astrometric survey in the optical that covers the 10 as to 1 mas
accuracy range will be Gaia. Thus as illustrated in section 3 the Gaia mission will play a central role
in assembling the puzzle of our galaxy. The final Gaia catalogue is not expected until ∼ 2021, with a
first data release foreseen in 2015–2016. Nevertheless there is no reason to sit and wait for the Gaia
catalogue. The many contributions to this conference show that there is plenty of high-quality survey
data to exploit now, before the Gaia catalogue arrives. Examples of surveys that already allow large
scale studies of the Galaxy are the Sloan digital sky survey (with good proper motions derived for
‘strip 82’), the Hipparcos catalogue and its re-reduction, the Geneva-Copenhagen Survey, the Tycho-2
catalogue, the RAVE survey, and soon the first Pan-Starrs survey results. In addition to these wide area
surveys there are targeted surveys providing very high accuracy astrometry, such as the surveys of the
Galactic centre described by Schödel in this volume, and the Bessel survey [2] providing 10 as level
parallaxes for individual masers in the Galaxy, allowing accurate studies of the Galactic disk structure
and kinematics.
     In the rest of this contribution I will focus on the Gaia mission. I will summarize the current status of
the mission and the most recent performance predictions, as well as highlight some of the less obvious
ways in which Gaia will impact studies of the Milky Way.

 a e-mail:   brown@strw.leidenuniv.nl

This is an Open Access article distributed under the terms of the Creative Commons Attribution-Noncommercial License 3.0, which
permits unrestricted use, distribution, and reproduction in any noncommercial medium, provided the original work is properly cited.

 Article available at http://www.epj-conferences.org or http://dx.doi.org/10.1051/epjconf/20121909002
EPJ Web of Conferences
106 105 104 1000 100 10 1 Precision (µas)
UV/X-ray
Photographic surveys m = 0–20 109
CCD sky surveys m = 16–24 1010
Ground based parallaxes m < 16 104
Optical Hipparcos m = 0–12 105
Tycho-2 m = 0–12 106
JMAPS m = 0–14 Nano-Jasmine m = 4–10 106
Gaia m = 6–20 109
Interferometry m < 16 wide-angle narrow-angle 104
Number of sources
IR CCD sky surveys m = 2–20 1010
Infrared
8m+AO m < 17 104
JASMINE z < 14, K < 11 107
JWST m = 10–30 104
Millimeter ALMA 104
Radio VLBI 105
Figure 1. Graphical overview of astrometric surveys. The surveys are characterized by a number of parameters:
wavelength range, depth, magnitude range, precision reached, number of objects surveyed. The precision refers
to all astrometric parameters (position, proper motion, parallax), where typically the proper motion precisions are
numerically smaller than parallax precision. Implicit in the proper motion precision is also the time baseline of a
given astrometric survey. The shading of the boxes and the right vertical axis serves to aid the eye in segregating
the wavelength domains. The references for the survey parameters can be found in [1].
2. GAIA MISSION STATUS AND PERFORMANCE PREDICTIONS
Gaia is the European Space Agency mission that will carry out an all-sky astrometric, photometric,
and spectroscopic survey – observing every object brighter than 20th magnitude – amounting to about
1 billion stars, galaxies, quasars and solar system objects. At the time of writing this contribution the
Gaia spacecraft and payload are in an advanced stage of assembly with extensive tests of the integrated
scientific payload expected to take place by mid-2012. Gaia is on track for a launch by mid-2013.
The scientific power of Gaia rests on the combination of three desirable qualities in a single mission:
(1) the ability to make very accurate (global and absolute) astrometric measurements; (2) the capability
to survey large and complete (magnitude limited) samples of objects; and (3) the matching collection
of synoptic and multi-epoch spectrophotometric and radial velocity measurements (cf. [3]). The range
of science questions that can be addressed with such a data set is immense and Gaia will revolutionize
studies of the Milky Way. Much of the Gaia science case can be found in this volume and the proceedings
of the conferences ‘The Three-Dimensional Universe With Gaia’ [4] and ‘Gaia: At the Frontiers of
Astrometry’ [5].
The astrometric measurements are collected employing a wide photometric band (the Gaia G band)
which covers the range 330–1000 nm. Multi-colour photometry will be obtained for all objects by means
of low-resolution spectrophotometry. The photometric instrument consists of two prisms dispersing all
the light entering the field of view. One disperser – called BP for Blue Photometer – operates in the
09002-p.2Assembling the Puzzle of the Milky Way
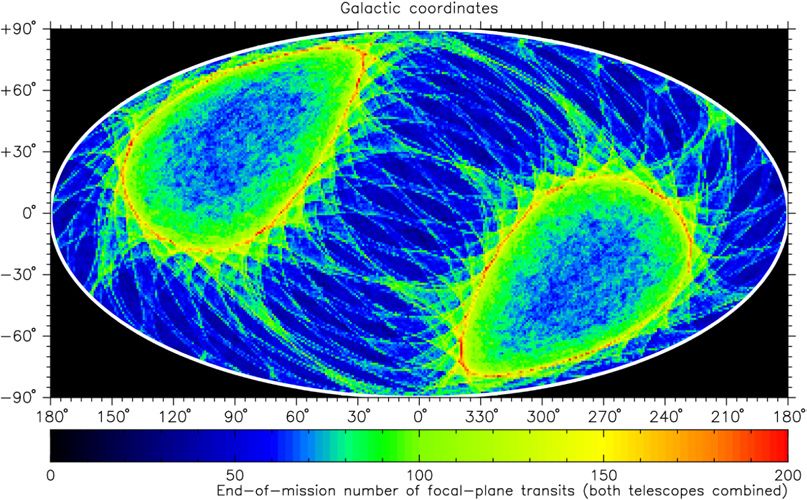
Figure 2. The predicted sky coverage of Gaia in Galactic coordinates. The colours indicate the number of times a
particular region on the sky is observed. By using the Galactic coordinate grid one can appreciate which regions of
the Milky Way will be observed more often. The two annuli around the ecliptic poles where most of the observations
are reflect the constant 45◦ angle between the Gaia spin axis and the direction from the spacecraft to the sun. Image
courtesy J. de Bruijne and ESA.
wavelength range 330–680 nm; the other – called RP for Red Photometer – covers the wavelength range
640–1000 nm. In addition radial velocities with a precision of 1–15 km s−1 will be measured for all
objects to 17th magnitude, thus complementing the astrometry to provide full six-dimensional phase
space information for the brighter sources. The radial velocity instrument (RVS) is a near-infrared (847–
874 nm, / ∼ 11 000) integral-field spectrograph dispersing all the light entering the field of view.
The focal plane of Gaia comprises an array of 106 CCD detectors which serve the three instruments
mentioned above. The observing programme is based on the autonomous on-board detection of celestial
sources, which is unbiased and complete to G = 20 (V ∼ 20–22). Gaia will be located at L2 and scan
the sky with its two telescopes by continuously spinning around the axis perpendicular to the two lines
of sight. The spin axis in addition makes a precessing motion around the spacecraft-sun direction, and
as a result Gaia will scan the whole sky roughly every 6 months. Each celestial source will on average
be observed about 80 times during the 5 year mission lifetime with a quasi-regular time sampling. The
number of times a source is observed is not uniform across the sky as illustrated in figure 2. The regions
in the annuli located 45◦ away from the ecliptic poles are observed most often, while the regions around
the ecliptic are covered less often. The number of stars in the Gaia catalogue is estimated to be ∼ 7 × 10⁵
to G = 10, 48 × 106 to G = 15 and 1.1 × 10⁹ to G = 20. About 60 million stars are expected to be
seen as binary or multiple systems by Gaia, among which about 106 –107 eclipsing binaries. In addition
the catalogue will contain astrometry and photometry for ∼ 3 × 10⁵ solar systems bodies, ∼ 5 × 10⁵
quasars, and some 106 –107 galaxies. The sky survey by Gaia will also produce the most accurate optical
all-sky map ever, with an angular resolution comparable to that of the Hubble Space Telescope.
The astrometric performance of Gaia is summarized in figure 3, which shows the sky averaged
parallax standard errors as a function of V -band magnitude. This figure illustrates a number of important
issues to keep in mind. At the bright end calibration errors will dominate and the parallax accuracies
will range from ∼ 5 to ∼ 14 as. At the faint end the behaviour of the errors as a function of V is
09002-p.3EPJ Web of Conferences
Figure 3. Sky averaged parallax standard errors as a function of magnitude in the V -band. The errors are shown
for stellar spectral types B1V and M6V. See the text for further explanations of this plot. The figure was made using
the performance predictions available through the ESA Gaia web pages.
dictated by the photon noise. The parallax accuracies are shown for an early and a late spectral type
to illustrate that at a given V the astrometric accuracies are better for red stars. As a function of G the
differences are negligible. The bands around the average relations reflect the uncertainty on calibration
errors at the bright end and the variation in sky coverage at the faint end. Note furthermore that expressed
in V the survey limits for red stars are different, being fainter at both ends. For M6V stars the limits
are 8 V 22. The parallax accuracy predictions include a rough estimate of the effects of radiation
damage and a 20% margin (factor 1.2) to account for unmodelled effects. The standard errors in position
and proper motion can be obtained by applying factors of ∼ 0.5 and ∼ 0.7, respectively, to the parallax
standard errors.
The velocities of the stars perpendicular to the line of sight can be inferred from the proper motion
and parallax. The expected accuracies on the transverse motion are around 1 km s−1 at a distance of
1 kpc, and range from ∼ 1–20 km s−1 at 3 kpc. At 10 kpc the transverse motions for K giants are expected
to be around 20 to 30 km s−1 . To complement the transverse motions Gaia will collect radial velocities
for the brightest 150 million stars in the survey. The predicted accuracies range from 1 to 20 km s−1
with a rather strong dependence on spectral type. For FGK stars accuracies better than 5 km s−1 can be
achieved to V ∼ 16, while for earlier spectral types this limit is already reached at V ∼ 12.
A stereoscopic and kinematic map of the Milky Way is only useful when complemented by a
detailed characterization of the age distributions and chemical compositions of the stellar populations.
To this end the multi-colour photometry and RVS spectra for the brighter stars can be used. Figure 4
shows simulated Gaia spectrophotometric observations of main sequence stars. The different spectral
types are clearly distinguishable and from these observations the astrophysical parameters of the stars
can be derived, including Teff , AV , log g, [M/H], and [/Fe] for the brighter stars. In addition the
detailed analysis of the Ca triplet region from the RVS spectra is expected to deliver the following
diagnostics: rotational velocities, atmospheric parameters, interstellar reddening (V < 13, 5 million
stars), and abundances (V < 12, 2 million stars). In addition the RVS spectra can be used to study
09002-p.4Assembling the Puzzle of the Milky Way
sample sample
40 30 20 10 0 60 50 40 30 20 10 0
3.0 3.0
RP counts (10 3 photons)
BP counts (10 3 photons)
2.5 2.5
2.0 2.0
1.5 1.5
1.0 1.0
0.5 0.5
0.0 0.0
400 500 680 900 640 700 800 9001000
λ (nm) λ (nm)
Figure 4. The response of Gaia’s blue and red photometers (left and right panel respectively) to main sequence
stars of spectral types varying from O5V (blue lines) to M5V (red lines). Input stellar spectral energy distributions
were provided by V. Straižys.
binary stars, where about 106 spectroscopic and 105 eclipsing binaries are expected, a quarter of which
will be double-lined spectroscopic binaries, allowing mass estimates.
Much more information on the expected performance and catalogue contents of Gaia than can be
provided here can be found on the ESA Gaia web pages (http://www.rssd.esa.int), in particular
in the ‘Science Performance’ section. The latter provides, among others, background information on the
instruments and the error modelling, interpolation tables and formulae for simulating the errors and the
predicted variations thereof over the sky, transformations from the Johnson and Sloan systems to Gaia
photometric system, and references to the relevant literature. The information on these pages allows
one to precisely simulate the performance of Gaia in order to prepare for the scientific exploitation of
the data. These web pages will be updated with better estimates of the expected accuracies on derived
products such as stellar astrophysical parameters. Over the next few years the Gaia Data Processing
and Analysis Consortium together with the Gaia Science Team will also make available simulated Gaia
catalogues containing the billion expected sources so that the astronomical community can prepare for
the scientific exploitation of the Gaia catalogue.
3. GAIA’S IMPACT ON SOLVING THE PUZZLE OF THE MILKY WAY
The scientific impact of the Gaia data on our understanding of the structure and formation history of
the Milky Way will be unprecedented with hopefully many interesting surprises awaiting us. I will not
attempt to summarize the expected science harvest here, but instead point out a number of the less
obvious ways in which Gaia will impact Galactic astronomy.
First of all it is important to realize that out to a distance of about 2.5 kpc from the sun parallaxes can
be determined to better than 1 per cent, covering about 11 million stars. This will enable an extremely
accurate calibration of luminosities and distance indicators across the Hertzsprung-Russell diagram.
This information can then be used to extend the reach of Gaia by employing well-calibrated photometric
distances instead of parallaxes at the faint end of the survey. Secondly, keep in mind that Gaia is a multi-
epoch survey of the sky and is expected to observe about 20 million classical variables, including 1–5
million eclipsing binaries, about 5000 Cepheids and 70 000 RR Lyra variables. The latter will enable us
to probe Galactic structure out to ∼ 75 kpc.
09002-p.5EPJ Web of Conferences
In terms of dissecting the structure of the Milky Way and understanding the fossil record of its
formation Gaia has a number of unique capabilities not provided by any other large sky survey. Gaia
will directly map Galactic phase space (3D distances and motions) over the full sky and a large volume.
In addition ages and compositions of stellar populations can be mapped, an endeavour that will be very
much enhanced by the large ground-based spectroscopic surveys described by Steinmetz in this volume.
Gaia data allow a mapping of dynamical quantities such as energy and angular momentum, which
is required to disentangle the formation history of the inner halo where dynamical mixing precludes
the detection of substructure as features in sky maps. Gaia will also enable us to study other ‘solar
neighbourhoods’, as described by Antoja at this conference, something that can not (easily) be done
with presently available data. The combination of Gaia parallaxes, interstellar reddening measures and
data on the Milky Way’s ISM will enable us to map the ISM accurately in three dimensions. This will
add very powerful constraints on any model we construct of the Milky Way.
Although the vast majority of stars observed will be within about 10 kpc from the sun, one should
keep in mind that Gaia will observe every source to G = 20. This means that individual bright giants
will be observed even in M31 and in particular that a significant fraction of the population of nearby
dwarf galaxies (to V ∼ 20–22 depending on the colour of the star) will be probed by Gaia. Accurate
distances and motions of these galaxies can thus be determined.
In relation to large ground based surveys of the sky Gaia will also have a tremendous impact. It
will enable excellent calibrations of standard candles and photometric distance indicators which in the
ground based surveys can be seen to distances 10 times further than can be reached by Gaia. In addition
Gaia will provide an extremely accurate reference frame against which astrometry can be done from the
ground. For example in the LSST science book it is illustrated how the proper motion and parallax errors
form a continuation from the Gaia errors to fainter magnitudes. This means that we will have access to
Hipparcos quality astrometry out to 24th magnitude. Finally, Gaia parallaxes, even when of relatively
poor quality, will provide the possibility to perform dwarf/giant separation which is important in target
selection for spectroscopic surveys.
4. PLANS FOR THE PUBLICATION OF GAIA DATA
The astronomical community is eagerly looking forward to the Gaia catalogue which is expected to
be ready in its final form around 2021, 8 years after launch. This is however ten years from today
so in keeping with modern practice, the Gaia community is developing plans for early and multiple
data releases. Each data release is planned to be made public world-wide immediately and the release
schedule is currently under discussion. The data releases will be increasingly complex in scope, starting
from an all-sky catalogue of accurate positions, including magnitudes and colours for each source.
Subsequently data such as parallaxes, proper motions, radial velocities, and multicolour photometry
will be added. Lastly, derived quantities are added such as stellar astrophysical parameters (including
ages), variable star classification, binary and multiple system parameters (orbital solutions, masses).
Detailed error information will be provided, including parameter covariances and estimates of source to
source correlations.
Scientifically exploiting the huge and complex catalogue that will be produced with Gaia will not
be trivial. Hence the Gaia community is now in the process of defining the way that Gaia data will
be made accessible to astronomers. This includes developing the data archiving and querying systems,
as well as producing detailed documentation and providing sophisticated data analysis tools, such as
visualization software for high dimensional data. In addition the aim is to make the data available in a
form that allows reprocessing of and adding to (parts of) the Gaia data in order to maximize the science
return. Examples are advanced searches for substructure in the Galactic halo by jointly considering
the intermediate data on groups of stars, or incorporating future information such as complementary
09002-p.6Assembling the Puzzle of the Milky Way
ground based spectroscopy. This is not a closed process taking place within the Gaia community. Ideas
on the Gaia catalogue are very welcome and are in fact currently being solicited from the astronomical
community through a requirements gathering process.
References
[1] Brown A.G.A. in Proceedings of IAU Symposium 248: A Giant Step: from Milli- to Micro-
arcsecond Astrometry (Cambridge University Press, Cambridge 2008) pp. 567–576
[2] Brunthaler A., et al., Astronomische Nachrichten 332, (2011) 461–466
[3] Lindegren L., in Proceedings of IAU Symposium 248: A Giant Step: from Milli- to Micro-arcsecond
Astrometry (Cambridge University Press, Cambridge 2008) pp. 217–223
[4] Turon C. O’Flaherty K.S., Perryman, M.A.C., The Three-Dimensional Universe with Gaia (ESA
Special Publication 576, 2005)
[5] Turon C., Meynadier F., Arenou F., Gaia: At the Frontiers of Astrometry (EAS Publications Series
Vol. 45, EDP Sciences 2011)
09002-p.7You can also read