Athabasca Uranium: a high grade super-district
←
→
Page content transcription
If your browser does not render page correctly, please read the page content below
Athabasca Uranium: a high grade super-district
NexGen Energy (NXE CN): Initiating with BUY rating and C$6.00/sh PT                                                         RISK RATING: HIGH
Fission Uranium (FCU CN) Initiating with BUY rating and C$0.75/sh PT                                                        RISK RATING: HIGH
IsoEnergy (ISO CN): Initiating with BUY rating and C$4.00/sh PT                                                             RISK RATING: VENTURE
UEX Resources (UEX CN) Initiating with BUY rating and C$0.50/sh PT                                                          RISK RATING: VENTURE

        Our mantra on exploration and development is: stick to well funded companies operating in the most attractive terranes.
        Think Archean gold, Andean Cu-Au and Mexican Silver. As the ongoing under-supply of uranium flows into equity
        valuations, we add another to our list of most attractive districts: The Athabasca Basin. The Athabasca’s infrastructure
        stands as a testament to the success of its 50-year uranium mining history: three mills in place, road and grid-power
        access, and a mature and codified permitting process that has seen mines successfully permitted, operated,
        decommissioned and rehabilitated. In addition, the prospectively of the district speaks for itself. Since 2011, in the teeth
        of a decade-long bear market, three world class discoveries have been made and advanced to DFS, and we believe
        more are on the way making the Athabasca ideal for uranium equity positions.
        Size and grade of new discoveries speak for themselves
        The rate and quality of new discovery for uranium in the Athabasca has been unprecedented and even more impressive
        in the context of a bear market. Since 2010, Arrow (348Mlbs at 2.0% U3O8), PLS (135Mlbs at 1.6%) and Gryphon
        (71Mlbs at 1.9%) have been discovered and advanced through PFS with average reserve conversion of 66%. Dare we
        use AuEq, these new discoveries equate to 9.0Moz @ 21.7g/t at spot, converting to 5.9Moz @ 26.4g/t of reserves.
        Cycle timing couldn’t be better for the Athabasca developers/explorers
        The knocks on the Athabasca in the past have been high capex, as traditional unconformity-hosted deposits required
        sophisticated mining methods, and associated rigorous permitting. The new generation of basement-hosted discoveries
        avoid these hurdles by being amenable to convectional stoping. Further, the silver lining of the recent down cycle is that
        the two more advanced developers covered here (NexGen/Fission) are at DFS stage with advanced permitting and
        provide precedent for earlier-stage IsoEnergy and UEX. Belt wide, this is a common theme exemplified by Arrow, PLS,
        and Gryphon, while Denison’s new ISR-approach at Phoenix could lower hurdle rates for unconformity-hosted deposits.
        We believe these trends will align with a bull market to in a series of green lights for this world-class district.
        NexGen Energy: best undeveloped project with SCPe C$1.1bn FCF per year
        We think NexGen’s Arrow project is the best combination of size and grade globally with a reserve of 204Mlbs @ 3.1%
        U3O8 set to drive >80% cash margins. Arrow should be the next major project to be built in the sector, and is the furthest
        advanced on permitting of Athabasca peers. With no surprises expected in the imminent DFS, followed by permits as
        soon as next year, we expect equity momentum to build, underpinning our positive view.
        Fission Uranium: good value and a natural consolidation play
        Of the advanced Athabasca developers, we believe Fission offers best value, with its substantial 135Mlbs @ 1.8%
        putting the stock on just US$1.01/lb. Its location ~20km from NexGen’s proposed plant offers potential future synergies,
        whether that be M&A or shared infrastructure, offering the opportunity to significantly reduce capital intensity. Investors
        should thus focus on the quality of the geology as the shallowest Athabasca asset amendable to conventional stoping.
        IsoEnergy: world class Hurricane discovery brings NexGen DNA to eastern Athabasca
        Since its 2016 NexGen spin out, Iso has rapidly built an impressive 2,771km 2 land package in the eastern Athabasca,
        and made what we believe is a world-class discovery at Hurricane. With intercepts such as 7.5m @ 38.8% U3O8 and
        9.0m @ 12.8% U3O8 over a strike of 575m, and with a large corridor of low-resistivity anomalies, we see all the
        ingredients for Hurricane to shape up as the next world class unconformity find in the eastern Athabasca.
        UEX: patient explorer with the largest land package in the district
        UEX’s 2,942km2 of Athabasca tenements represents the largest holding in the district, with exposure to the key belts in
        the basin. The existing attributable 99.5Mlbs across three projects provides leverage to exploration, allowing new
        discoveries to hit scale faster. Geologically, these discoveries also provide a good proof of concept of the endowment
        of the western basin holdings at the Rabbit Lake Camp and between Cigar Lake and McArthur River.

        All prices in this report as of 29 January 2021 unless otherwise noted                       Sprott Capital Partners Equity Research

            1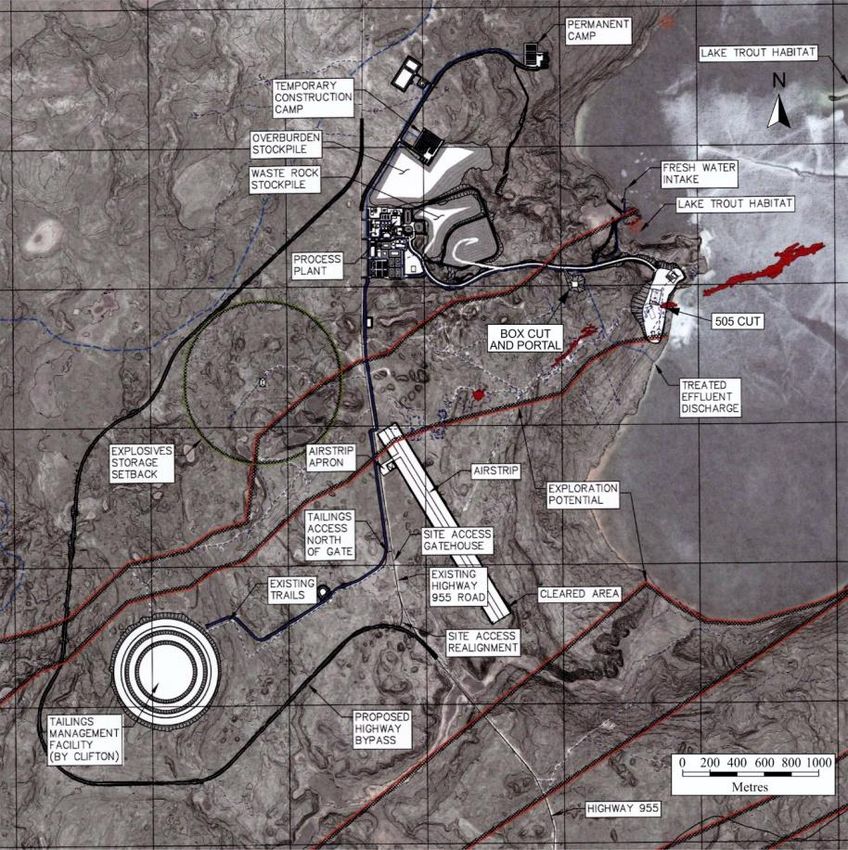
SECTOR OVERVIEW .................................................................................................................................... 3

NEXGEN ENERGY ........................................................................................................................................ 8
INVESTMENT THESIS ........................................................................................................................................ 9
VALUATION ................................................................................................................................................... 13
RECOMMENDATION: INITIATE COVERAGE WITH BUY RATING AND C$6.00/SH PT ........................................ 14
ASSET SUMMARY .......................................................................................................................................... 17

FISSION URANIUM ................................................................................................................................... 28
INVESTMENT THESIS ...................................................................................................................................... 29
VALUATION ................................................................................................................................................... 31
RECOMMENDATION: INITIATE COVERAGE WITH BUY RATING AND C$0.75/SH PT ........................................ 32
ASSET SUMMARY .......................................................................................................................................... 35

ISOENERGY ................................................................................................................................................ 46
ASSET SUMMARY .......................................................................................................................................... 47
INVESTMENT THESIS ...................................................................................................................................... 48
VALUATION ................................................................................................................................................... 52
RECOMMENDATION: INITIATE COVERAGE WITH BUY RATING AND C$4.00/SH PT ........................................ 52

UEX CORPORATION ................................................................................................................................. 60
INVESTMENT THESIS ...................................................................................................................................... 61
VALUATION ................................................................................................................................................... 62
RECOMMENDATION: INITIATE COVERAGE WITH BUY RATING AND C$0.50/SH PT ........................................ 62
ASSET SUMMARY .......................................................................................................................................... 63

                                                                                                                          Sprott Capital Partners Equity Research

2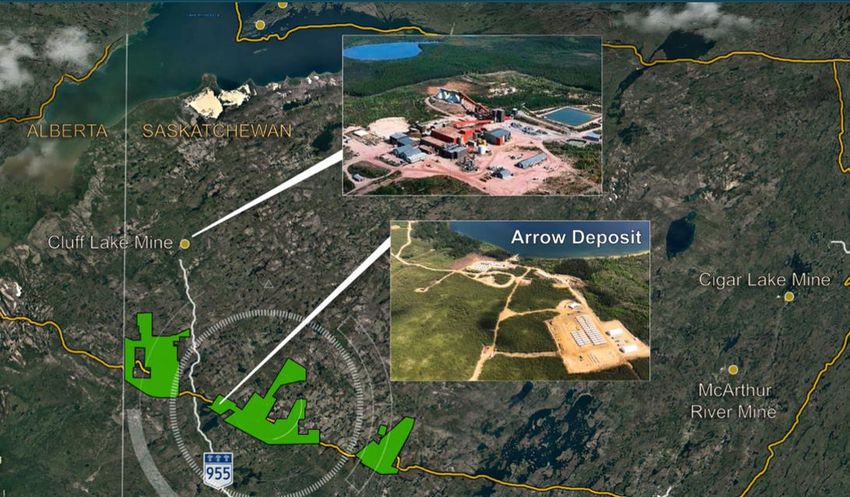
Athabasca Uranium Sector, 4 February 2021
Uranium equities rally as investors weigh falling inventories and exploration/development spend
Uranium equities have rallied in since November 2020, with the average producer +35% and pre-producers +93%
since the start of November. This rally came despite the spot price has remained sluggish at ~US$30/lb, and as
reported long-term contract volumes fell to 53Mlbs in 2020 from 96Mlbs in 2019 (per Kazatomprom). We see three
reasons why the uranium equity rally is justified.
(1) Demand continues to outstrip supply, causing inventory drawdowns: the uranium market has been
undersupplied since 2017, further tightening in 2020 with the closure of Energy Resource’s of Australia’s 3.5Mlbs
pa Ranger operation, a 15% fall in Kazatomprom production, and the COVID-driven suspension of operations at
Cameco’s Cigar Lake Mine, which remains offline. Combined, we estimate a 25-30Mlb supply deficit from
mined/secondary supply in 2020. The steeply downward sloping contracted position of US utilities leaves them
with 25Mlbs of uncontracted demand through 2023. We expect these utilities return to the market to drive prices
up, a key driver for our positive view on the commodity price.
Figure 1. (A) Falling inventory balances; (B) Global supply/demand and falling exploration / development spend
300 200.0 2,500
Exploration and Development (US$m)
180.0
Production / Demand (Mlbs)
250 160.0 2,000
140.0
Ivnentories (Mlbs U3O8)
200 120.0 1,500
100.0
150 80.0 1,000
60.0
100 40.0 500
20.0
50 - -
2010 2011 2012 2013 2014 2015 2016 2017 2018 2019
- Canada Kazakhstan Australia
2015 2016 2017 2018 2019 Namibia Uzbekistan Niger
Russia Other Secondary
EU US
World demand Exploration and development
Source: Inventories US EIA and Euratom, global supply and demand from World Nuclear Association, secondary supply SCPe, exploration
and development expenditures from OECD NEA and IAEA joint report
(2) Buy low, sell high - uranium one of the best value trades in the commodity space: we measure this in
two ways. Uranium is at 18% relative to it’s 10-year high/low, among the most attractive (Figure 2A) in the peer
group. Against the cost curve, the spot price implies that 30% of producers have less than a 30% profit margin,
and we think even this is optimistic for economic breakeven at the current spot price. The lack of price incentive
over recent years has created under-supply, providing support for future price rises.
Figure 2. (A) Selected commodities vs their 10-year high/lows (%);
(B) Greenhouse gas emissions in electricity generation by energy source (gCO 2Eq per kWh)
1,000
100% 81% 81% 740 820
80% 61% 67% 800
59% 490
60% 48% 600
40% 400 230
18%
20% 200 11 12 12 24 27 38 41 48
- -
Biomass-…
Concentrate…
Solar PV -…
Solar PV -…
Biomass -…
Wind - offshore
Coal
Geothermal
Gas
Hydropower
Nuclear
Wind onshore
Gold
Nickel
Silver
Copper
Uranium
Aluminium
Zinc
Source: (A) US EIA for GHG emissions; (B) commodity market data from S&P Capital IQ
(3) Nuclear energy is crucial to the decarbonisation thesis and the emerging markets thesis: nuclear energy
is, along with onshore wind, the least carbon intensive (full life cycle) source of energy generation and is crucial
for keeping overall emissions low while managing intermittency. The importance of this thematic cannot be
understated.
Sprott Capital Partners Equity Research
3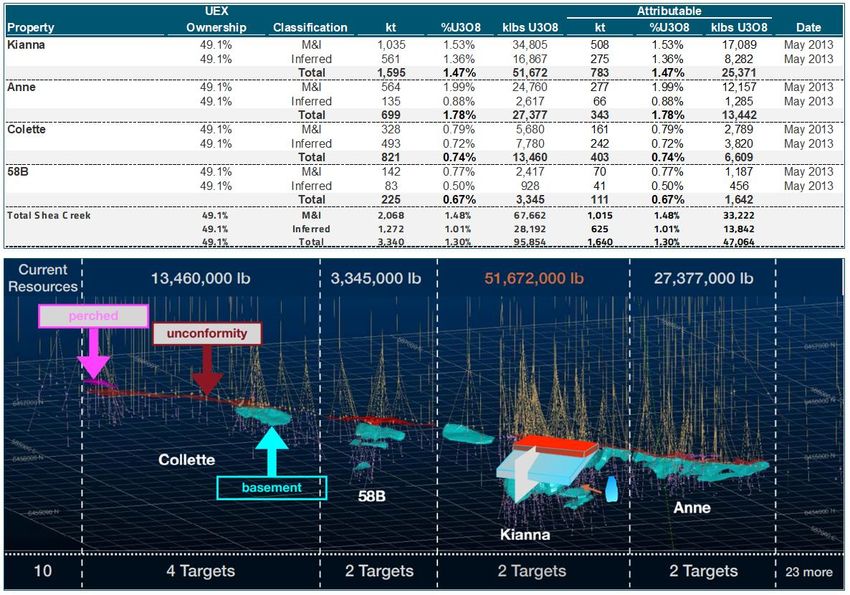
Athabasca Uranium Sector, 4 February 2021
Pre-producers have outperformed producers, and offer more leverage to a rising price
Share price movements over the past three months are instructive, as the average pre-producer has more than 3x
outperformed Kazatomprom and Cameco. Moreover, we believe in the case of uranium, there is additional benefit
to pre-production status as the producers are selling production at below the long-term incentive price, which is
NAV-dilutive, a problem that pre-producers do not have. Finally, producers can and have been impacted by Covid-
19. Given the currently low spot uranium price and reduced level of contracting activity, we believe pre-producers
are the sweet spot.
Figure 3. Selected Uranium companies last-three-month USD share price performance
200%
150%
100%
50%
--
Deep Yellow
Cameco
Kazatomprom
Yellow Cake
Energy Fuels
Peninsula
Ur Energy
IsoEnergy
Boss Energy
Fission
UPC
Paladin
UEX
UEC
Global Atomic
Denison
NexGen
Berkeley Energia
Source: Bloomberg as at 29 January 2019
Athabasca pre-producers attractively valued relative to peers
Constraining the universe to projects in Tier I jurisdictions, Athabasca producers are now more attractively valued
than their ISR and hard-rock peers. This is despite significantly lower study operating costs and more recent
economic studies in many cases. Though we just noted that pre-producers offer more torque, in our view
Athabasca names offer the ‘Goldilocks trade’ with more upside due to their preproduction status but with Tier I
assets that will sit in the lowest cost quartiles once in operation, offering investors upside but also safe positioning.
Figure 4. Major uranium districts by identified resource endowment (Mlbs) and grade (ppm)
Paladin Energy Fuels Ur Energy UEC NexGen Denison Boss Peninsula Fission UEX
Asset Langer Heinrich Nichols Ranch Lost Creek Texas Hub Arrow Wheeler River Honeymoon Lance Patterson Lake South Shea Creek
Location Namibia Wyoming Wyoming Texas Saskatchewan Saskatchewan South Australia Wyoming Saskatchewan Saskatchewan
Status C&M C&M Small scale prodn Resource DFS imminent DFS study work C&M Small scale prodn DFS study work PEA
EA commenced EA restarted EA submitted
Permits Permitted Permitted Permitted Various Permitted Permitted Not permitted
April 2019 December 2020 April 2020
Ownership (%) 75% 100% 100% 100% 100% 90% 100% 100% 100% 49%
Study 2020 PFS 2015 PEA 2016 PEA 2010 Resource 2018 PFS 2019 PFS 2020 FS 2018 DFS 2019 PFS 2013 Resource
Deposit type Surficial Sandstone Sandstone Sandstone Ingress Egress / Ingress Sandstone Sandstone Ingress Egress
Mining Open Pit ISR ISR ISR UG UG/ISR ISR ISR UG UG
Milling Mill, NIMCIX IX IX SX Mill build McClean Lake Mill NIMCIX IX Mill build TBD
Reserve grade (% U3O8) -- -- -- -- 3.09% 3.55% -- -- 1.61% --
Reseves (Mlbs) -- -- -- -- 234.1 109.4 -- -- 81.4 --
Resource Grade (% U3O8) 0.044% 0.113% 0.048% 0.086% 2.04% 3.24% 0.062% 0.048% 1.78% 1.30%
Resources (Mlbs U3O8) 119.7 9.0 21.0 19.2 348.3 135.1 71.6 53.6 135.2 95.9
Other projects (Mlbs U3O8) -- 101.8 8.8 74.1 -- 35.3 -- -- -- 52.4
Recovery (%) 88.5% 70.0% 80.0% -- 97.6% 89.7% -- 90.0% 96.7% SCPe 95%
Sales Royalty (%) 3.50% 9.50% 6.30% various 7.25% 7.25% 6.50% 6.30% 7.25% 7.25%
Profit Royalty (%) -- -- -- -- 10-15% 10-15% -- -- 10-15% 10-15%
Tax Rate (%) 37.5% 21.0% 21.0% 21.0% 27.0% 27.0% 30.0% 21.0% 27.0% 27.0%
Annual production (Mlbs) -- 0.6 1.0 -- 25.4 7.7 3.2 3.0 10.7 --
LOM total production (Mlbs) 76.1 6.5 13.8 -- 228.4 107.6 20.7 33.4 75.2 --
Initial Capex (US$m) 81.0 53.5 - spent 46.5-spent -- 988.7 750 72.2 118.7 933 --
Initial capex intensity (US$/lb LOM) 1.06 8.18 spent 3.37 - spent -- 4.33 6.97 3.49 3.55 12.41 --
Operating cash cost (US$/lb) 27.00 11.36 14.58 -- 4.36 7.34 21.07 31.77 7.18 --
AISC (US$/lb) 30.85 29.85 28.58 -- 9.08 8.90 28.20 41.00 10.69 --
FD mkt cap (US$m)E 487.5 520.0 136.7 324.7 1,263.8 461.3 136.5 87.6 161.2 90.1
FD EV (US$m) 611.7 500.6 141.0 310.4 1,056.4 423.6 116.0 76.3 136.4 82.2
EV/Reserve (US$/lb) nmf nmf nmf nmf 4.51 3.87 nmf nmf 1.68 nmf
EV/Resource (US$/lb) 6.81 4.52 4.72 3.33 3.03 2.70 1.62 1.42 1.01 0.83
Source: SCP, company disclosure, market data from Bloomberg and S&P Capital IQ
Sprott Capital Partners Equity Research
4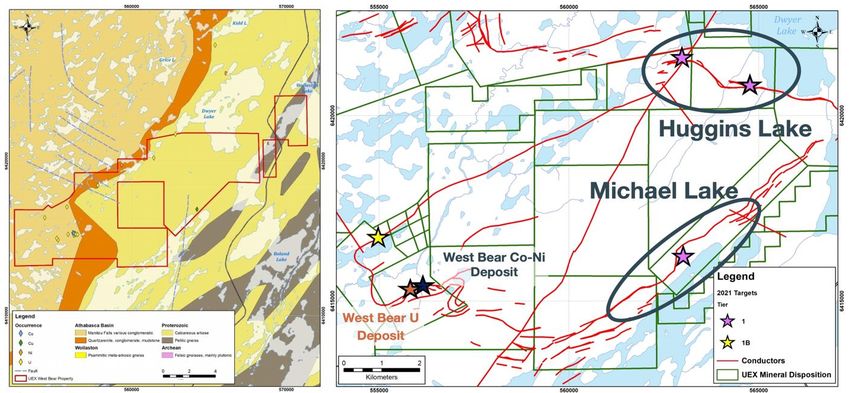
Athabasca Uranium Sector, 4 February 2021

Athabasca is the highest grade uranium district in the world
At 1.9 billion pounds of identified resources at grade of 1.6% U3O8, the Athabasca boasts the largest endowment
of any jurisdiction in the world. In gold equivalent terms at spot, the Athabasca hosts 31Moz AuEq @ 17g/t. Not
only does this speak to exploration potential, there are real operating benefits to the scale and high grade of this
resource endowment. The size of the endowment ensures the long-life use of processing, power and transportation
infrastructure while high grades make transporting ore and/or pregnant solution highly economic.
                   Figure 5. Major uranium districts by identified resource endowment (Mlbs) and grade (ppm)
2,500          15,163                                                                                Resource (Mlbs, LHS)           100,000
                                 513                                                                 Grade (ppm, RHS)
2,000                                                                                 1,881                                         10,000
                                              959                                                      691             701
                                                                         471
1,500                                                         264                                                                   1,000

1,000                                                                                                                               100

    500                                                                                                                             10

      --                                                                                                                            1
            Saskatchewan Kazakhstan           Niger          Namibia   Western      Northern         South          Wyoming
                                                                       Australia    Territory       Australia

Source: S&P Market Intelligence; Kazatomprom grades from 2019 IPO prospectus, SCPe

Not only is the district well endowed, the individual projects are among the largest in the world, rivalling the largest
open pit projects in Africa or ISR fields in Kazakhstan. Athabasca deposits dominate the top right of the grade-
tonnage distribution and even better, three of the five projects were discovered in the 2010s; there are still world
class discoveries to be had.
                          Figure 6. Projects resources (Mlbs U3O8) and resource grade (ppm, log scale)
    Grade (ppm U3O8)
    1,000,000
                         Saskatchewan                                                         Athabasca large and highest
                         Kazakhstan
                         Namibia                                                                                   grade
                         Niger                                                                          Cigar Lake
      100,000
                         South Australia                                                                   McArthur River
                         Western Australia                                                        Wheeler River
                         Northern Territory                                                       PLS Arrow
       10,000            Wyoming                                                                Shea Creek
                         Other

           1,000                                                                                       African open pits large but
                                                                                                              lower grade

            100

                                                                              Kazakh ISRs are lower grade
             10
                                                                               but large for ISR projects

              1
                   0.0                 0.1             1.0             10.0             100.0                1,000.0             10,000.0
                                                      Contained Resources (MI&I, Mlbs U3O8)
Source: S&P Market Intelligence; Kazatomprom grades from 2019 IPO prospectus, SCPe

                                                                                                      Sprott Capital Partners Equity Research

5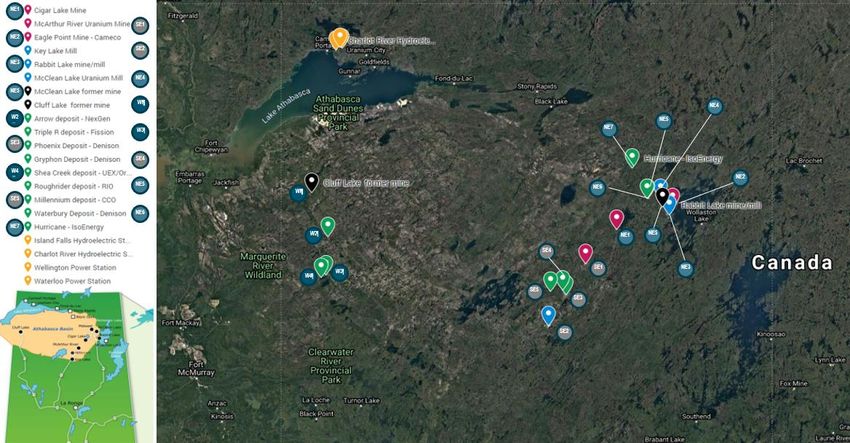
Athabasca Uranium Sector, 4 February 2021

Basement hosted mineralisation gives West Athabasca scale and low costs
NexGen’s Arrow and Fission Uranium’s PLS projects represent a total of 484Mlbs of resources at 2.0% U 3O8 in
adjacent properties less than a 20km haul from each other. Arrow alone represents the best undeveloped (and
best overall) uranium project in the world in our view, and we believe the size, grade and host settings of the two
deposits present an overwhelmingly clear economic logic for a mill in the Western Athabasca. Moreover, both are
basement hosted for significantly lower operating costs than unconformity-hosted deposits like McArthur River and
Cigar Lake. We expect a mill in the Western Athabasca to achieve quick capital payback, have a 15+ year regional
resource base to draw from, and all this in a relatively unexplored and demonstrably prolific new district. From an
exploration perspective, we believe this means that cut-off grades in the Western Basin are likely to come down
as toll milling or acquisition becomes a viable development option.
                    Figure 7: Schematic depicting host settings for Athabasca uranium deposits

                                                                                 Ultra high grade(5%+) but more
                                                                                  challenging ground conditions

                                Basement –hosted
                                mineralisation enables
                                conventional stoping methods
Source: IsoEnergy

Eastern Athabasca benefits from existing mills and new ISR extraction method may lower cutoffs
The Eastern Basin is an established mining district with three licensed mills (Key Lake, McClean Lake and Rabbit
Lake), grid power, road connections, and an established airstrip access. The current generation of most-promising
development prospects in the Eastern Basin are the ultra-high grade unconformity-hosted deposits, including
Denison’s Phoenix deposit and Iso’s exciting Hurricane discovery, though Dension’s Gryphon and Rio Tinto’s
Roughrider are sufficiently basement hosted to enable conventional stoping. Denison has advanced an ISR-
extraction concept at Gryphon with encouraging initial field tests and PFS results. If successful, this could
significantly reduce operating costs and would lower development/exploration hurdles for other unconformity
hosted deposits and new discoveries in the basin.
                    Figure 8: Denison proposed Phoenix wellfield configuration and cross section

Source: Denison

                                                                                      Sprott Capital Partners Equity Research

6
Athabasca Uranium Sector, 4 February 2021
Prolonged downturn has enabled new discoveries to shorten lead time vs global peers
While the prolonged uranium downturn has hurt the sector, we believe the Athabasca pre-producers have uniquely
benefitted from the opportunity to shorten permitting and exploration lead-times vs their peers in other jurisdictions.
Consistent exploration through the downturn has resulted in over 700Mlbs of collective resource delineation.
NexGen, Denison and Fission have advanced their flagship projects through to DFS stage, while advancing
permitting works through the EA process. We believe NexGen is now in a position to get its permits and commence
production this cycle while Fission is to commencing DFS workflows and we believe would benefit from a significant
re-rate if NexGen receives mill approval.
Figure 9: Key metrics for selected largest Athabasca pre-producers
Primary Asset FD Market
Company Ticker Stage Cap EV Reserves Resources P/NAV EV/Reserves EV/Resources
(US$m) (US$m) (Mlbs) (Mlbs) (x) (US$/lb) (US$/lb)
NexGen Energy TSX:NXE DFS 1,263.8 1,056.4 234.1 348.3 0.5x 4.51 3.03
Denison Mines TSX:DML DFS 461.3 423.6 98.4 156.9 0.8x* 4.30 2.70
Fission Uranium TSX:FCU DFS 161.2 136.4 81.4 135.2 0.4x 1.68 1.01
IsoEnergy TSXV:ISO Exploration 184.4 164.9 -- 0.5x -- --
UEX Corporation TSXV:UEX Exploration 90.1 82.2 -- 99.5 0.5x -- 0.83
Average 0.5x 2.10 1.51
Weighted Average 0.6x 3.91 2.30
SCPe, Company disclosure, NAV estimates from SCPe except for Denison, Denison NAV from S&P Capital IQ, market data from Bloomberg
Putting it all together
The Athabasca is a world-class mining district having yielded three major discoveries during since 2011, and we
expect more to come. The district offers multiple ways to play the uranium thesis in the pre-producer space.
NexGen is a world-class development project that offers torque and attractive valuation with size and liquidity.
Fission is a value play that we believe is excessively discounted relative to its resource endowment and options
to reduce capital intensity. The two together form a new producing belt in the West Athabasca that we expect to
become a globally significant production centre. IsoEnergy has the early appearance of a world-class unconformity
discovery at Hurricane in the Eastern Athabasca, while UEX offer upside to new discovery success, with its value
backstopped, and exploration de-risked by, pounds already in resource at a market-discounted valuation.
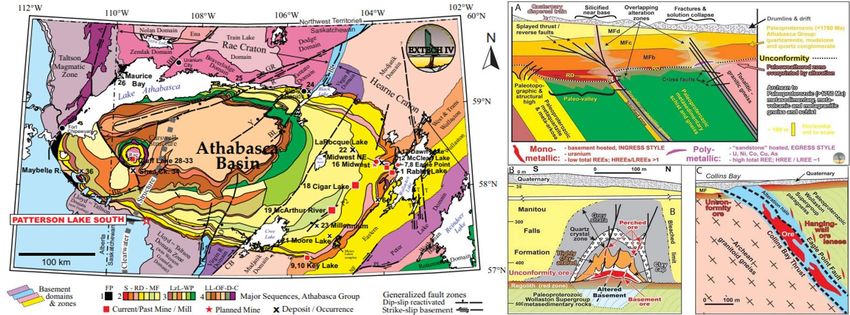
Figure 10: Regional map of the Athabasca basin with a regional road map in bottom left
NE4
NE5
NE7
NE2
NE6
WI
W2 NE1 NE5
SE4
SE1 NE3
W3
W4
SE5
SE3
SE2
Source: SCPe, Google Maps, Cameco (Map), SaskPower, Company disclosures
Sprott Capital Partners Equity Research
7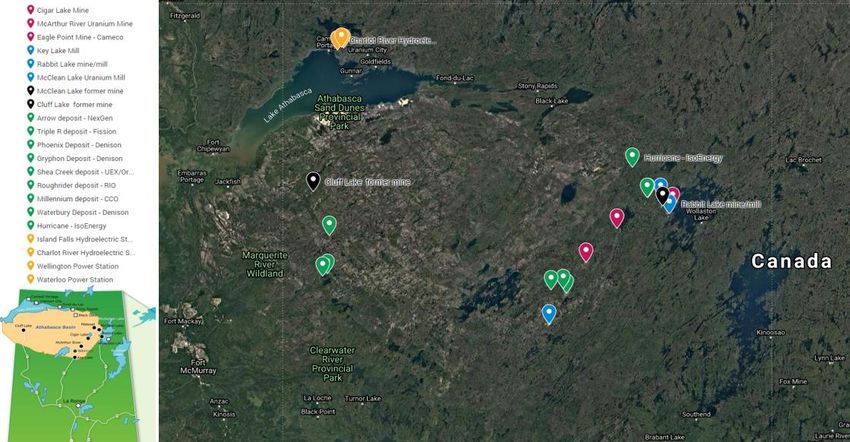
NEXGEN ENERGY (NXE CN)
World’s best undeveloped uranium asset
RECOMMENDATION: BUY PRICE TARGET: C$6.00 RISK RATING: HIGH
SHARE DATA C$3.61/sh
West Athabasca developer with 338Mlb, 30Mlbs per year project
Shares (basic, FD) 377 / 474 NexGen’s 100%-owned Rook I property in the western Athabasca Basin of
52-week high/low 3.83 / 0.8
Saskatchewan hosts the 338Mlb at 2.69% U308 Arrow deposit. Drilling at Arrow
Market cap (US$m) US$1021m
Net cash (debt) (US$m) 76
commenced in 2013, and quickly identified a large and extremely high-grade
1.0xNAV8% @ US$26/oz (US$m) 1,180 deposit, resulting in a 2015 maiden resource estimate of 202Mlbs at 2.63%
1.0xNAV7% FD (p/sh) C$2.49 U3O8. A PEA quickly followed in 2018 which was followed up by the 2018 PFS
P/NAV (x) 1.45x
which delineated production of 228Mlbs over a 9-year mine life at operating
Average daily value (C$m, 3M) 3.60
costs of US$4.36/lb and AISC of US$9.08/lb.
FINANCIALS
U3O8 produced (000lbs)
CY26E
25,075
CY27E
29,927
CY28E
29,949
Largest and lowest cost project globally
Revenue (C$m) 865 1,032 1,033 With a reserve of 234Mlbs at 3.09% U3O8, average annual production of
AISC (C$/lb) 10.16 9.30 9.50
25.4Mlbs, and steady state production of 30.0Mlbs at US$4.63/lb cash costs,
Income (C$m) 148.1 283.5 300.5
EPS (C$/sh) 0.24 0.45 0.48
Arrow should be the largest and lowest operating cost asset in the world once
PER (x) 15.2x 8.0x 7.5x in production, occupying nearly the entirety of the bottom cost quartile. The
CFPS (C$/sh) 0.72 0.89 0.88 combination of high grade (221Mlb at 15.5% U3O8 high grade core) and
P/CF (x) 3.8x 3.0x 3.1x
competent gneissic host rock should result in significantly lower development
EBITDA (C$m) 549.0 684.8 677.5
EV/EBITDA (x) 4.3x 2.8x 2.1x
and operating costs than other Athabasca operations.
NAV over time 2021E 2022E 2022E
Rapid payback perfect for building a west Athabasca mill
1xNAV7% FD (C$/sh) 2.00 3.35 2.65 We forecast C$635m of free cash flow in year one of production, increasing to
ROI to 1xNAV (% pa) -45% -4% -10% C$1,004m in year two, repaying initial capex in 1.6 years. We forecast average
1.2xNAV7% FD (C$/sh) 2.40 4.02 3.18
ROI to 1.2xNAV (% pa) -45% 5% -4%
annual free cash flow of C$1.1bn over years 2-7 of production with an average
FCF margin of 55% and FCF yield of 51%. The cash margins and rapid payback
SOTP 1xNAV8% US$26/oz US$m C$/sh make Arrow the ideal asset to develop a mill in the western Athabasca basin.
Arrow NPV 4Q20 940 1.98 Given the proximity of other high grade deposits, we believe the mill would be a
Other Assets 399 0.84
Central SG&A & fin costs 4Q20 (317.6) (0.67)
multi-decade strategic asset anchoring a new producing district.
Net cash + options
TOTAL
159.6
1,180
0.34
2.49
Most advanced permitting in the Athabasca basin
5.00 5.00 Arrow’s permitting process is nearly 18 months ahead of peers, which we
Volume (m)
4.00 4.00 believe is another key advantage that should allow NexGen to secure preferable
Price (C$)
Volume (C$m)
long term contracts. Arrow’s EA commenced in April 2019 and based on the
Price (C$/sh)
3.00 3.00
CNSC’s guidance of the EA process taking up to 36-months, we estimate that
2.00 2.00
permits could be in place as early as 2022, enabling a 2023 construction start
1.00 1.00
and SCPe first production in 2026.The DFS is expected to be completed in 1Q21
0.00 with EIS submission shortly thereafter.
Oct-20
Jan-20
Jul-20
Jan-21
Apr-20
Initiate with BUY rating and C$6.00/sh price target
Source: S&P capital IQ Trading at an EV multiple of 11% of spot in-situ value at an already low uranium
price, NexGen is one of the cheapest world class projects in the mining space,
despite being the highest grade large project in global mining. We initiate with a
BUY rating and C$6.00/sh price target for NexGen based on 0.85x fully diluted
Justin Chan +44 7554 784 688 jchan@sprott.com NPV8%-50/lb. While this is higher than a typical developer multiple, Arrow is a
Brock Salier +44 7400 666 913 bsalier@sprott.com special strategic asset and our target equates to 20% of spot in-situ value, which
Brandon Gaspar: +1 204 541 1144 bgaspar@sprott.com is reasonable for a world class project in our view, especially as this is calculated
off of a low spot uranium price.
8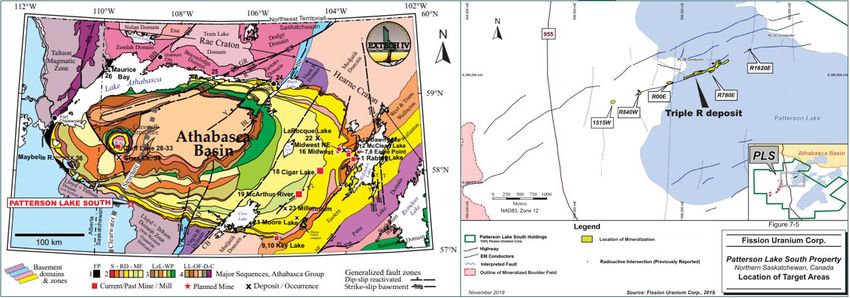
Nexgen Energy, 4 February 2021

Investment thesis
West Athabasca developer with best undeveloped uranium project globally
NexGen ‘s flagship property is the 350.65km2 Rook I property in the western Athabasca Basin. The property hosts
the Arrow, a 348Mlb at 2.04% U3O8, with a high grade core of 221Mlbs at 15.56% U3O8. NexGen acquired the
property in 2012 and carried out EM, VTEM, gravity and prospecting work in 2013 and discovered Arrow in 2014,
with a maiden intercept of 26.2m of highly anomalous radioactivity with intense alteration and pitchblende. Intensive
exploration followed, with a maiden resource estimate of 202Mlb at 2.63% U3O8 in 2015. In 2016, NexGen
announced a PEA with production of 18.8Mlbs over 15 years, and in 2018 announced a PFS which delineated a
9-year life with average annual production of 25.4Mlbs per year at a head grade of 3.09% uranium (>1oz per tonne
AuEq at spot prices), with a 1.2-year payback period. NexGen is led by a strong management team led by CEO
Leigh Curyer (ex CFO at Southern Cross Resources), SVP Travis McPherson, Chief Project Officer Tony George
(ex Victoria Gold, Lundin Gold, Lucara Diamonds) and VP Ops Troy Boisjoli, who was Chief Geologist at Cameco’s
Eagle Point Mine, which, like Arrow, is a basement-hosted deposit.
                                                                                                Figure 11: Location Map

Source: NexGen Energy
Largest and lowest cost project globally
With PFS LOM cash operating costs of US$4.36/lb and annual production of 25.4Mlbs per year for nine years, and
30Mlbs per year at steady state, Arrow is by far the largest and lowest cost undeveloped project globally. Moreover,
Arrow is the lowest risk of the undeveloped assets. It is amenable to conventional underground mining and milling
methods, and benefits from an exceptional operating jurisdiction in Saskatchewan, with a clear and successful
permitting precedents, in a geopolitically stable and secure location.
                                         Figure 12: Uranium projects by average annual production and cash costs (bubble size = LOM production)
                                         $50
                                                                                                                                          Athabasca     ISR      Open Pit
                                         $45                                    Etango
    Study Operating Cash Cost (US$/lb)

                                                             Mutanda   Norasa
                                         $40
                                                 Wiluna
                                         $35
                                                              Lance             Mulga Rock           Langer Heinrich
                                         $30             Madoela
                                                                                 Westmoreland
                                         $25         Tiris
                                                                        Honeymoon
                                         $20                           Salamanca
                                                      Lost Creek                       Dasa
                                         $15
                                         $10             Nichols Ranch             Gryphon
                                                        Dewey Burdock                                 PLS
                                          $5                                                                                                                         Arrow
                                                                                 Phoenix
                                           --
                                                --                     5.0                   10.0              15.0                20.0                 25.0                  30.0
                                                                                                Average annual production (Mlbs/year)
Source: SCPe, company disclosures

                                                                                                                                               Sprott Capital Partners Equity Research

9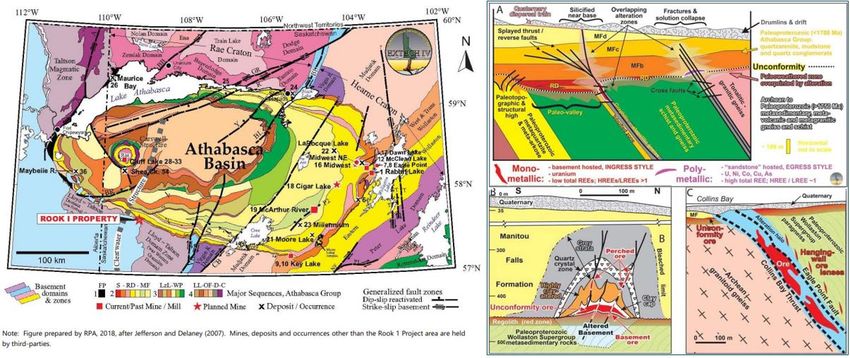
Nexgen Energy, 4 February 2021

Arrow is comfortably a lowest quartile cost asset, ranking just above Karatau (Kazakhstan ISR, 6.6lbs) at SCPe
US$6.52/lb vs US$6.01/lb for Karatau including royalties calculated at US$26.12/lb.
                                                            Figure 13: Uranium 2019 mine cash cost curve
                     40.0
                                                                                                                                                     Namibia
                     35.0
                                                                                                                                              Namibia
                     30.0
                                                                                                                                     Niger Niger
Cash cost (US$/lb)

                     25.0                                                                                                       Russia
                                   Arrow SCPe US$4.80/lb at                                                                 Australia                  Rossing
                     20.0          US$26.12/lb (for LFL comparison)                                                      Russia
                                                                                                                Australia                         Husab
                     15.0                                                         Canada          Kazakhstan                               Somair
                                                                    Kazakhstan                                                     Cominak
                                                           Australia                                                             Dalur
                                      Kazakhstan
                     10.0                                                                                                   Ranger
                                                                                   Cigar Lake                           Khiagda
                                                                   Kharasan                                   Olympic Dam
                      5.0                  South InkaiKatco Beverley                                      Zarechnoye
                                        Akdala                                                        Inkai
                                    Akbastau
                      0.0     Karatau

                            0.0        10.0         20.0         30.0            40.0          50.0         60.0        70.0         80.0          90.0        100.0
                                                                                        Production (Mlbs U3O8)
Source: S&P Market Intelligence; 1kt U = 2.6Mlbs U3O8
Rapid payback and asset quality make Arrow and ideal deposit to anchor a West Athabasca Mill
Due to its size, low costs, and favourable deposit setting, one of the very few concerns about NexGen’s Arrow
project is its location in the western part of the Athabasca basin. The eastern part of the basement hosts the
majority of the historic and existing mines with three mills, i) McClean Lake (24Mlbs), ii) Key Lake (25Mlbs), and
iii) Rabbit Lake (16.9Mlbs). The implied conclusion is that NexGen is at a disadvantage due to its western location,
despite having the best deposit.
                      Figure 14: (A) Map of NexGen’s Athabasca landholdings and (B) schematic of Athabasca uranium deposits

Source: SCPe, company disclosures

We disagree with this conclusion for three reasons: payback period, strategic value, and operating margins.
Payback period: Despite the requirement to build a mill, the limited need for ground freezing (in Arrow’s case just
for the first 150m of shaft sinking) gives NexGen lower preproduction capex and opex than other Athabasca
deposits. This results in a payback period of just 1.2 years at US$50/lb for Arrow (per the PFS), the fastest of the
Athabasca projects and world class for any mining project. NexGen can quickly pay back capex and become a
>50% FCF yield stock at US$50/lb, with a further 7.5 years of mine life at Arrow to harvest cash.

                                                                                                                               Sprott Capital Partners Equity Research

10
Nexgen Energy, 4 February 2021
Figure 15: SCPe FCF and FCF yield at US$50/lb – Rapid payback de-risks mill build
$1,500 80%
60%
$1,000
40%
$500 20%
-- --
(20%)
($500.0)
(40%)
($1,000.0) (60%)
2021 2023 2025 2027 2029 2031 2033 2035
Arrow (C$m) Capex (C$m) Exploration (C$m) Interest and corporate (C$m) FCF yield (%)
Source: SCPe
Strategic value: The western basin now has ~570Mlbs of defined resources between Arrow, PLS and Shea Creek,
while Arrow remains open in all directions with other targets on the Rook I property. Adding Fission Uranium’s
Triple R deposit to the end of NexGen’s Arrow mine life, assuming Fission’s base case mine plan from the 2019
UG-only PFS with C$300m of assumed development capital (C$220m for mine development plus $50m for a road
and C$30m for a TMF expansion) would result in C$540m of additional NPV at T0, more than 2x Fission’s current
EV. While we are not implying any corporate action will take place, we believe there is significant strategic value
to building a mill at Arrow beyond the economics of the Arrow deposit standalone.
Figure 16: Undeveloped Athabasca deposits by size (Mlbs) and grade (% U308)
25.00%
Reserves
20.00% Resources
Phoenix
15.00% Arrow high grade
% U3O8
10.00% Gryphon
Phoenix
Fox Lake
Shea Creek
5.00% Roughrider
Milennium
Gryphon Triple R Arrow
Triple R Arrow
-- Horseshoe-Raven
-- 50 100 150 200 250 300 350 400
Mlbs U3O8
Source: SCPe, company disclosures
Margins: With a Reserve of 234Mlbs at 3.09% U3O8, Arrow is by far the largest of the Athabasca deposits and
its high grade core of 221Mlbs at 15.5% U308 is the second highest grade development project in the basin and by
far the largest. Host setting is another decisive factor. Arrow is a basement-hosted deposit with competent granitic
gneiss host rock that enables conventional underground stoping methods, significantly reducing mining and
development costs. Ground freezing will only need to be employed during shaft sinking through the first 150m,
compared to a life of mine operating reality for unconformity hosted deposits. Arrow thus benefits from significantly
lower mining costs at C$157/t of ore, compared to C$137/t for Triple R (also Western Athabasca basement-hosted
but under a lake) and C$211/t at Wheeler River’s Gryphon deposit (East Athabasca LH stoping).
Sprott Capital Partners Equity Research
11Nexgen Energy, 4 February 2021
A world class project for any commodity
Table 17: Selected high grade global mining projects by in-situ value and valuation
Mag Silver Sabina NexGen Greatland Mincor Silvercrest
Asset Juanicipio Back River Arrow Havieron Cassini Las Chispas
Location Zacatecas, MX Nunavut Saskatchewan W. Austraila W. Austraila Sonora, MX
Commodity Ag Au U308 Au-Cu Ni Ag
Resource date 1Q18 PEA Apr-19 2018 PFS Dec-20 June 2020 3Q19 PEA
Global resource (kt)A 24,900 35,992 7,726 52,000 5,203 4,600
B
Reserve or mine inventory (kt) 23,124 15,010 3,433 na 2,303 2,908
Total Resource (million) 531Moz AgEq 9.2Moz Au 338Mlbs U3O8 4.1Moz AuEq 196kt Ni 129Moz AgEq
Total Reserve (million) 9Moz AgEq 3.2Moz Au 234Mlbs U3O8 0.1Moz AuEq 65kt Ni 1Moz AgEq
C
In Situ Value (US$m) 14,290 16,980 10,166 7,529 3,518 3,478
Reserve Value (US$m) 0 5,991 7,035 na 1,173 2,316
In Situ Grade (US$/tonne) 574 472 1,316 167 682 756
Reserve Grade (US$/tonne) 0 399 2,049 na 509 797
Recovery (%)D 92% 93% ~99% 88% 89% 91%
Payability (%) 83% 100% 100% 95% 72% 100%
Ownership (%) 44% 100% 100% 30% 100% 100%
Royalty (%) 0.5% 3.6% 7.3% 3.0% 4.2% 0.5%
In situ - attr payable recoverable (US$m) 4,743 15,151 9,306 1,824 2,150 3,153
Reserve - attr payable recoverable (US$m) 3,122 5,346 6,440 na 717 2,100
Grade - payable recoverable (US$/t) 433 421 1,205 135 417 686
Payable recoverable on in-situ (%) 75% 89% 92% 81% 61% 91%
E
FD mkt cap (US$m) 1,888 679 1,324 1,365 399 1,364
FD EV (US$m) 1,689 636 1,121 1,328 315 1,202
EV/in-situ payable recoverable (%) 36% 4% 12% 73% 15% 38%
EV/Reserve payable recoverable (%) 54% 12% 17% na 44% 57%
(A) MAG using 2018 PEA; Sabina using Jan 2020 resource estimate; Nexgen using 2018 PFS; Greatland using Dec 2020 Maiden Resource; Silvercrest Metals 3Q19 PEA; (A) MAG using 2018 PEA; Sabina using
SCPe; Nexgen using 2018 PFS; Greatland using Dec 2020 Maiden Resource; Silvercrest Metals 3Q19 PEA; Cassini from June 2020 Reserve update (C) Prices: $1840/oz Au, $24.70/oz Ag, US$30.00/lb U308,
US$8,000/t Cu; US$18,000/t Ni (D) Silvercrest Metals, Mag Silver, from PEA; NexGen from PFS; SBB from SCPe, GGP from weighted average resource cut-off, SIL from 2018 PEA, Mincor from 2020DFS; (E)
Diluted for ITM options + warrants and post period end equity; (F) cash as last reported plus net cash from post period equity and ITM options.
Source: SCPe, Bloomberg market data, priced 15 January 2021
At US$1322/t in-situ value at spot, NexGen has among the highest in-situ grades of any project in the world,
equivalent to 22g/t Au or 1,725g/t Ag but at bulk mineable widths in a leading mining jurisdiction. Moreover, NexGen
is trading at just 12% of in-situ value, making it one of the cheapest world class assets in any commodity despite
being the highest grade. This is at a US$30.20 uranium price, a much more conservative price level than the rest
of the commodity complex. Nor do we see a catch here, 69% of Arrow’s in-situ lbs are contained in reserves at
~50% higher grade, giving it a significantly larger payable reserve than the other projects profiled above.
Most advanced along the permitting process of the Athabasca projects
We believe that at least one Athabasca project (between Arrow, Wheeler River and Triple R) is likely to be
developed in the next generation of uranium mines, as Cigar Lake’s mine life is scheduled to end in 2029 per
Cameco and the market will need to replace its 20Mlbs of supply. Arrow is not only the best economic prospect
(lowest capital intensity, largest, lowest cost) in the basin, it is also the most advanced Athabasca project with
respect to permits. The EA including project description was submitted and accepted in April 2019, while Wheeler
River’s project description was accepted in December 2020. In addition, we believe that Arrow’s submission should
face fewer headwinds given the conventional nature of the mining process and fewer groundwater issues to
contend with.
Feasibility study expected in 1Q21 with EIS submission shortly thereafter
While our bullish stance on uranium might lead some like-minded investors to seek out of the money option projects
(i.e. high tonnage, low grade, cheap pounds in the ground) we believe that NexGen offers the ideal combination
of leveraged price exposure as a developer, with permitting and project milestones as sources of value creation
independent of the commodity cycle. In our view EA approval is the single largest de-risking catalyst for Arrow, as
its grade and amenability to conventional processes all but guarantee economic viability, leaving permitting and
funding as the main to-be-confirmed items for investors. The DFS is expected in early 2021 and we expect limited
changes, with EIS submission shortly thereafter. As the EA process is now 20 months in, we believe the EA
approval could be received as early as in 2021, which in our view should be a major positive catalyst for the shares,
and one unique to NexGen (as opposed to a ‘lb in the ground’ play).
Sprott Capital Partners Equity Research
12Nexgen Energy, 4 February 2021
Valuation
Mine Plan and Inventory
We base our valuation on NXE’s PFS inputs, with a total inventory of 234.1Mlbs at 3.09% U3O8 producing a LOM
total of 228Mlbs over a nine-year mine life at unit costs of C$389/t or C$5.82/lb. At like-for-like inputs of US$50/lb,
our NPV8% matches NXE’s LOM NPV of C$3.6bn. We then add US$20/year of exploration and evaluation costs
from 2020-2022E and conservatively increase operating costs and capex by 10%.
Figure 18 Summary of SCPe mine plan
NexGen SCPe
Category Unit 2016 PEA 2018 PFS PFS Inputs $50/lb $60/lb
Inventory kt 3,613 3,141 3,414 >> >>
Grade % U3O8 1.73% 3.09% 0.03 >> >>
Recovery % 92.8% 97.6% 97.6% >> >>
Throughput tpd 1,448 1,039 1,039 >> >>
Total production mlbs 276 228 228 >> >>
Average annual mlbs pa 18.5 25.4 25.4 >> >>
Cash costs US$/lb 6.70 4.36 4.36 4.80 4.80
AISC US$/lb 7.97 9.08 8.67 9.11 9.83
Mine life years 15 9 9 9 20
UG mining cost US$/t mined 131.87 157.31 157.31 173.04 173.04
Mining cost US$/t ore mined 131.87 157.31 157.31 173.04 173.04
Processing cost US$/t processed 110.91 164.65 164.65 181.12 181.12
G&A US$/t processed 63.20 67.11 67.11 73.82 73.82
Total cost per tonne US$/t processed 305.98 389.07 389.07 427.98 427.98
Initial capex US$m 1,188.00 1,246.9 1,246.9 1,371.6 1,371.6
Sustaining capex total US$m 468.0 213.9 213.9 213.9 213.9
Sustaining capex per year US$m 31.2 23.8 23.8 23.8 10.7
Closure cost US$m 64.0 48.0 48.0 48.0 48.0
Uranium price US$/lb 50 50 50 50 60
Discount rate % 8.0% 8.0% 8.0% 8.0% 8.0%
USD/CAD 1 CAD = 0.75 0.75 0.75 0.75 0.75
NPV at build start C$m 3,490 3,661 3,613 3,492 4,476
IRR at build start % 56.7% 56.8% 54.6% 50.5% 58.6%
Operating margin % 85.5% 90.6% 91.2% 90.4% 92.0%
Average annual FCF C$m 553.0 866.9 765.0 747.8 423.0
LOM FCF C$m 8,295.0 6,934.8 6,885.4 6,730.5 8,459.2
(1) Including sales royalties but not the provinical profit royalty
Source: SCPe, company disclosure
Timeline and capex
We model a three-year construction period with total initial capex of C$1.37bn (PFS +10%) starting in 2023, with
first production from 2026. This assumes EA acceptance in early 2022 with the remaining permits granted through
the remainder of the year allowing for construction start in Spring 2023. We model a C$24m per year of sustaining
capital, in line with the PFS, and a C$48m closure cost, both in line with the PFS.
Taxes, royalties and fiscal
There are no third party royalties on the property. In line with current legislation, we model a 4.25% provincial
revenue royalty (5.0% gross sales royalty minus a 0.75% resource credit), a 3% provincial sales surcharge, and a
sliding 10-15% net profit royalty at 10% for profit per kg up to C$23.29/kg (C$10.54/lb) and 15% on profits per kg
above that level. We assume a 27% corporate income tax rate, in line with current provincial and federal legislation.
Funding and balance sheet
We assume a total funding package of C$1.7bn consisting of C$960m of debt at 12%, C$300m of prepaid offtake
at US$50/lb, and C$385m of equity at 0.6x NAVPS in 2022.
Production Profile
We estimate a nine-year mine life at average cash operating costs of C$6.40/lb (US$4.80) and C1 + revenue
royalties of C$12.14/lb at US$60/lb. Adding the 10-15% variable provincial profit royalty, we estimate LOM AISC
Sprott Capital Partners Equity Research
13Nexgen Energy, 4 February 2021
of C$19.49/lb (US$14.62/lb) at US$50/lb. This generates life of mine FCF of C$5.0bn at US$40/lb, C$6.7bn at
US$50/lb and C$8.5bn at US$60/lb. We estimate FCF payback of capex, corporate expenses and pre-production
expenses within 1.6 years of first production at US$50/lb.
Figure 19: SCPe production profile
30.0
15.00
25.0
12.00
20.0
9.00
15.0
10.0 6.00
5.0 3.00
-- --
2026 2027 2028 2029 2030 2031 2032 2033 2034
Arrow (Mlbs, LHS) Cash Costs (US$/lb, RHS) AISC (US$/lb, RHS)
Source: SCPe; AISC includes 7.25% revenue royalty and 10-15% variable royalty calculated at US$50/lb
Other assets
We have included US$2.00/lb for lbs outside the mine plan (C$139m total) and NXE’s 52.5% stake in IsoEnergy
at current market value (C$139m).
Share count
As at the end of September 2020, NXE had 376.95m shares outstanding with 37.41m options at an average strike
price of C$2.23/sh. 33.83m options are in the money at an average price of C$2.11/sh. In addition, NXE has
US$60m of 7.5% convertibles due in each of 2021 and 2022 at US$2.326 and US$2.692/sh, with US$15m of
convertibles due in 2025 at a conversion price of C$2.34. We have assumed that convertibles are converted into
shares as they are all in the money currently. This generates a fully diluted share count of 474m shares. We
assume SCPe fully funded share count estimate is 540m.
Figure 20: SCPe NAV breakdown and NAV sensitivity to uranium price
C$/sh 1xNAV sensitivity to gold price and discount / NAV multiple
Asset C$m Fully diluted Fully Diluted + Funded 1xNAV Arrow (C$m) $30/lb $40/lb $50/lb $60/lb $70/lb
Arrow NPV 4Q20 2,955 6.24 5.47 10% discount 990 1,704 2,418 3,133 3,847
Central SG&A & fin costs 4Q20 -118 -0.25 -0.22 9% discount 1,121 1,897 2,673 3,449 4,225
Lbs outside mine plan ($2.00/lb) 304 0.64 0.56 8% discount 1,267 2,111 2,955 3,799 4,643
IsoEnergy 52.5% stake 95 0.20 0.18 7% discount 1,430 2,349 3,268 4,187 5,106
Cash and restr. cash 3Q20 79 0.17 0.15 6% discount 1,613 2,615 3,616 4,618 5,620
Debt 3Q20 -3 -0.01 0.00 5% discount 1,817 2,910 4,004 5,097 6,191
ITM options 84 0.18 0.15 Valuation (C$/sh) $30/lb $40/lb $50/lb $60/lb $70/lb
Equity issued for mine build 385 not included 0.71 0.50xNAV 1.60 2.60 3.50 4.50 5.40
Total 3,395 7.17 7.00 0.70xNAV 2.30 3.60 4.90 6.20 7.60
Shares outstanding (m) 0.85xNAV 2.70 4.30 6.00 7.60 9.20
Basic Shares (m) 377 1.00xNAV 3.20 5.10 7.00 8.90 10.80
ITM Options (m) 37 1.20xNAV 3.90 6.10 8.40 10.70 13.00
Shares issued for ITM converts (m) 57 Sources Uses
Convert share interest (m) 3 PFS capex C$1247m SCPe 3Q20 cash + ITM options C$122m
Fully Diluted Shares (m) 474 SCPe contingency C$125m Mine debt @ 60% gearing C$1028m
SCPe Fully Funded Shares (m) 540 SCPe G&A + fin. cost to first Au C$322m Build Equity C$385m
Market Multiples SCPe working capital C$127m Offtake C$300m
Share price (C$/sh) 3.61 Total uses C$1820m Total proceeds C$1835m
P/NAV fully diluted 0.50x
P/NAV fully diluted + funded 0.52x
Target price
Fully diluted + funded target multiple 0.85x
Target price (C$/sh) 6.00
Source: SCPe
Initiate with a BUY recommendation and C$6.00/sh price target based on 0.85x NAV8%-50/lb
Arrow’s high margins, rapid payback period, and its advanced permitting status in a tier one jurisdiction give us
confidence that the asset will be the next tier I uranium mine. At 0.5x NAV8%-50/lb or 11% of spot in-situ value,
NexGen remains cheap for a world class project, offers the safety of buying into a world class asset, with the torque
in a rising market that investors seek in pre-production assets. We initiate with a BUY rating and C$6.00/sh price
target based on 0.85x fully funded NAV8%-50/lb. We believe Arrow is a special project and deserves a higher rating
than we would normally assign a pre-production project; our target price equates to 20% of spot in-situ value at
the current uranium price and we believe there is significant upside to this as the cycle turns.
Sprott Capital Partners Equity Research
14Nexgen Energy, 4 February 2021
Why we like NexGen
1. Best undeveloped uranium asset – largest and lowest cost
2. Most advanced permitting process of the Athabasca developers
3. Still undervalued relative to world class development projects in other commodities
4. Catalyst rich: DFS expected imminently and EA approval in SCPe next 12-18 months provide upside
beyond leverage to the uranium price
Catalysts
1Q21: Arrow DFS
Mid-2021: EIS submission
SCPe 2021-2022: Potential EA approval
Risks
Permitting: We view this risk as moderate. While uranium mine permitting is a thorough process, the process is
well underway, Saskatchewan is regarded as an excellent jurisdiction with constructive regulatory authorities, and
the project itself benefits from its remote location and small tonnage footprint.
Development: We view this as a moderate risk. At 450ktpa, the project itself is modest in tonnage which should
reduce scope for overruns. In our view the highest risk item in the capital build is the shaft sinking, especially in
the initial 125m, as this presents the greatest ground condition challenge.
Geology: We view this as a relatively low risk. The deposit is well drilled with over 300,000m supporting the
Resource estimate and large consistent grades encountered in the A2 and A3 high grade zones.
Mining: We view this risk as moderate but below peers in uranium. The deposit is hosted in competent basement
rock which enables conventional stoping methods.
Processing: We view this risk as low. The deposit is high grade and is not polymetallic, while the flowsheet is
conventional for an Athabasca uranium deposit.
Logistics: We view this risk as low, due to the limited tonnage of the operation. While the project is in the west
rather than eastern Athabasca, it is still proximate to a region with a well-developed supply chain and skilled labour
force for uranium mining.
Environmental: We view this risk as moderate. Tailings are non-mineralised and non-asset forming. The
underground tailings deposition method occurs well below the unconformity in stable ground conditions. The
company has put in place provisions to treat process water.
Sprott Capital Partners Equity Research
15Nexgen Energy, 4 February 2021
Ticker: NXE CN Price / mkt cap: C$3.61/sh, C$1,361m Market P/NAV: 0.50x Assets: Arrow
J Chan / B Salier / B Gaspar Rec / PT: BUY / C$6.00 1xNAV2Q20 FD: C$7.17/sh Country: Canada (Saskj)
Group-level SOTP valuation 3Q20 4Q20 Share data
C$m O/ship NAVx C$/sh Basic shares (m): 376.9 FD + options (m): 473.8 FD + FF 540.0
Arrow NPV 4Q20 2,954.9 100% 1.0x 6.24 Commodity price CY23E CY24E CY25E CY26E CY27E
Central SG&A & fin costs 4Q20 (118.1) -- 1.0x (0.25) Uranium price (US$/lb) 50.0 50.0 50.0 50.0 50.0
Lbs outside mine plan ($2.00/lb) 304.0 100% 1.0x 0.64 Ratio analysis CY23E CY24E CY25E CY26E CY27E
IsoEnergy 52.5% stake 94.9 1.0x 0.20 FD shares out (m) 514.2 522.4 533.3 540.0 540.0
Cash and restr. cash 3Q20 78.6 -- 1.0x 0.17 EPS (C$/sh) (0.093) (0.150) (0.212) 1.113 1.534
Debt 3Q20 (2.6) -- 1.0x (0.01) CFPS before w/c (C$/sh) (0.00) (0.00) (0.01) 1.67 2.05
ITM options 83.6 -- 1.0x 0.18 FCFPS pre growth (C$/sh) (0.09) (0.15) (0.21) 1.18 1.86
1xNAV8% US$50/lb 3,395 7.17 FCF/sh (C$/sh) (0.47) (1.31) (1.28) 1.18 1.86
Assumed build equity issuance 385.2 0.71 FCF yield - pre growth (%) (3%) (4%) (6%) 33% 52%
1xNAV fully funded8% US$50/lb 3,780 7.00 FCF yield (%) (13%) (36%) (36%) 33% 52%
P/NAV (x): 0.52x EBITDA margin (%) -- -- -- 70% 72%
Target multiples Multiple C$/sh FCF margin (%) -- -- -- 38% 51%
Target P/NAV Multiple 0.85x 6.00 ROA (%) (3%) (5%) (6%) 26% 37%
Target price 6.00 ROE (%) (7%) (13%) (22%) 53% 42%
Sources Uses ROCE (%) (1%) (1%) (1%) 71% 55%
PFS capex C$1247m SCPe 3Q20 cash + ITM options C$122m EV (C$m) 915 1,605 2,311 1,725 753
SCPe contingency C$125m Mine debt @ 60% gearing C$1028m PER (x) (38.7) (24.0) (17.1) 3.2x 2.4x
SCPe G&A + fin. cost to first Au C$322m Build Equity C$385m P/CF (x) nmf nmf nmf 1.6x 1.3x
SCPe working capital C$127m Offtake C$300m EV/EBITDA (x) nmf nmf nmf 1.5x 0.5x
Total uses C$1820m Total proceeds C$1835m Income statement CY23E CY24E CY25E CY26E CY27E
1xNAV sensitivity to gold price and discount / NAV multiple Revenue (C$m) -- -- -- 1,663 1,985
1xNAV Arrow (C$m) $30/lb $40/lb $50/lb $60/lb $70/lb COGS (C$m) -- -- -- (483) (549)
10% discount 990 1,704 2,418 3,133 3,847 Gross profit (C$m) -- -- -- 1,180 1,436
9% discount 1,121 1,897 2,673 3,449 4,225 G&A & central (10) (10) (10) (10) (10)
8% discount 1,267 2,111 2,955 3,799 4,643 Depreciation -- -- -- (186) (222)
7% discount 1,430 2,349 3,268 4,187 5,106 Impairment & other (C$m) -- -- -- -- --
6% discount 1,613 2,615 3,616 4,618 5,620 Net finance costs (C$m) (38) (68) (103) (114) (48)
5% discount 1,817 2,910 4,004 5,097 6,191 Tax (C$m) -- -- -- (268) (328)
Valuation (C$/sh) $30/lb $40/lb $50/lb $60/lb $70/lb Minority interest (C$m) -- -- -- -- --
0.50xNAV 1.60 2.60 3.50 4.50 5.40 Net income attr. (C$m) (48) (78) (113) 601 828
0.70xNAV 2.30 3.60 4.90 6.30 7.60 EBITDA (10) (10) (10) 1,170 1,426
0.85xNAV 2.80 4.40 6.00 7.60 9.30 Cash flow CY23E CY24E CY25E CY26E CY27E
1.00xNAV 3.30 5.20 7.10 9.00 10.90 Profit/(loss) after tax (C$m) (48) (78) (113) 601 828
1.20xNAV 3.90 6.20 8.50 10.80 13.10 Add non-cash items (C$m) 48 78 109 302 276
Valuation over time 1Q21E 1Q22E 1Q23E 1Q24E 1Q25E Less wkg cap / other (C$m) -- -- -- (127) (21)
Mines NPV (C$m) 3,213 3,492 3,792 4,307 5,305 Cash flow ops (C$m) (0) (0) (4) 776 1,083
Cntrl G&A & fin costs (C$m) (119) (110) (89) (44) 37 PP&E (C$m) (196) (605) (571) (24) (24)
Net cash at 1Q (C$m) 51 701 477 (191) (867) Other (C$m) -- -- -- -- --
Other Assets + Options 179 179 179 179 179 Cash flow inv. (C$m) (196) (605) (571) (24) (24)
1xNAV (C$m) 3,323 4,260 4,359 4,250 4,654 Debt draw (repayment) (C$m) 257 257 257 (128) (902)
P/NAV (x): 0.5x 0.4x 0.4x 0.4x 0.4x Equity issuance (C$m) 20 15 8 -- --
1xNAV share px FD (C$/sh) 7.01 8.99 8.48 8.14 8.73 Other (C$m) (48) (78) (109) (149) (87)
ROI to equity holder (% pa) 94% 58% 33% 23% 19% Cash flow fin. (C$m) 229 194 157 (278) (989)
Resource / Reserve kt % U3O8 Mlbs EV/lb U3O8 Net change post forex (C$m) 33 (411) (419) 475 70
Measured, ind. & inf. - Arrow 7,726 2.04% 348.1 3.26 FCF (C$m) (244) (683) (684) 637 1,006
Reserves (2P) 3,433 3.09% 234.1 4.85 Balance sheet CY23E CY24E CY25E CY26E CY27E
SCPe Mine inventory - Arrow 3,433 3.09% 234.1 4.85 Cash (C$m) 994 582 164 639 709
Production (100%) CY26E CY27E CY28E CY29E CY30E Accounts receivable (C$m) -- -- -- 64 76
Arrow (000mlbs U3O8) 25.1 29.9 29.9 30.0 30.0 Inventories (C$m) -- -- -- 121 137
Arrow cash cost (US$/lb) 5.44 4.62 4.86 3.75 3.78 PPE & exploration (C$m) 516 1,121 1,692 1,530 1,332
Arrow AISC (US$/lb) 15.47 14.61 14.81 13.87 13.89 Other (C$m) 1 1 1 1 1
Arrow (mlbs) Group AISC (US$/lb) Total assets (C$m) 1,510 1,704 1,856 2,354 2,255
40mlbs US$20/oz Debt (C$m) 517 774 1,031 902 --
Other liabilities (C$m) 321 321 301 326 300
30mlbs US$15/oz
Shareholders equity (C$m) 848 863 892 892 892
20mlbs US$10/oz Retained earnings (C$m) (197) (276) (388) 213 1,041
Minority int. & other (C$m) 22 22 22 22 22
10mlbs US$5/oz
Liabilities+equity (C$m) 1,510 1,704 1,856 2,354 2,255
-- -- Net Cash 477 (191) (867) (263) 709
CY26E CY27E CY28E CY29E CY30E
Net Debt to NTM EBITDA (x) nmf nmf 0.7x 0.2x (0.5)
Sprott Capital Partners Equity Research
16Nexgen Energy, 4 February 2021
Arrow (100%-owned Rook I property, West Athabasca, Saskatchewan, Canada)
Site location and access
Arrow is located on NexGen’s 100% owned Rook I Project, located 40km east of the Alberta-Saskatchewan border,
150km north of the town of La Loche and 640km NW of Saskatoon. In total the claims cover 350.65km 2. Arrow is
not subject to any third-party royalties or encumbrances; other claims within the overall property are subject to a
2% NSR and 10% free carried interest. The site can be accessed via all-weather gravel Highway 955 which travels
N-S approximately 8km west of the Arrow Deposit and is maintained by the provincial government, with the final
stretch from 955 to site on a private all-weather access road built by NexGen. The nearest population centre is La
Loche, Saskatchewan, while Fort McMurray, Alberta, is located 180km SW of Rook I and can be reached from La
Loche by winter road from December through April. An airstrip is planned as part of the mine site design. Mean
temperatures are below freezing for seven months of the year with freeze-up typically commencing in October and
break-up in May. Mining activities are expected to operate year-round. The current mine plan is based on generator
power but there is a power line 70km south of the property.
Figure 21: Asset location within the wider basin
Source: NexGen Energy
History
Exploration commenced on the property with airborne magnetic and radiometric surveys from 1968-1970. EM work
in the 1970s uncovered conductors but drilling from 1977-1982 did not encounter radioactivity despite promising
alteration. NexGen acquired the Rook I property from Mega Uranium in 2012 and commenced VTEM and target
selection in 2013. Early drilling yielded immediate >20m results with off-scale radioactive readings and a maiden
resource estimate of 202Mlbs at 2.69% in 2015 confirmed Arrow as the premier deposit in the Athabasca basin.
Geology
The Athabasca Basin is located in Northern Saskatchewan and into NE Alberta, and is a Paleoproterozoic-aged
flat-lying fluvial sedimentary basin characterised by surficial sandstones unconformably overlying the basement
gneiss and granitoid complexes. Arrow is considered to be an example of basement-hosted ingress style
mineralisation formed by the mixing of reducing brine from the Athabasca sandstones interacting with fluids coming
up from faults in the underlying basement gneiss. At Arrow no mineralisation has been encountered at or above
the unconformity with massive veins from just below the unconformity to 700m below. Alteration is largely
conformed to structures in the basement, typical of this style of mineralisation, with intensive hydrothermal
alteration and shearing in the host gneissic basement rock.
Sprott Capital Partners Equity Research
17Nexgen Energy, 4 February 2021
Figure 22: (A) Rook I property geology (B) Arrow deposit geology
Source: NexGen Energy
Arrow consists of several stacked lenses (named A1 through A5) within a 308m wide zone with a strike length of
970m starting at 110m below surface extending to 980m, and is open at depth and to the west. Mineralisation is
closely associated to narrow, strongly graphitic, politic, and graphitic semipelitic gneiss lithologies thought to
represent discrete shear zones. The deposit is currently interpreted as being hosted chiefly in semipeltic gneiss.
Each shear panel is ~50m wide and contain narrow graphitic shear zones oriented parallel to foliation and striking
at 050° to 060°. The A2 and A3 shears host higher grade, thicker and more continuous mineralisation than the
other shears.
Reserves and Resources
Figure 23: (A) Arrow NI 43-101 R&R statement (B) Resource cross section with planned mining area
Source: NexGen Energy, Cut-off grade is 0.25%U3O8 for reserves and resources, resources calculated at US$50/lb and minimum mining
width of 1m, reserves are calculated at US$45/lb and a cut-off of 0.25% U3O8.
The resource incorporates 302,021m of drilling in 593 core holes of which 555 holes for 296,681m were conducted
by NexGen. Grades were interpolated using ordinary kriging and inverse distance squared using a minimum of 2-
3 to up to 50 composites per block. The reserves extend from 355m to 655m below surface and 31% dilution was
applied to longhole stopes with an additional 13% fill dilution applied to secondary stopes. An extraction recovery
factor of 95% was applied. In 2019, following the PFS, NexGen commenced a 125,000m drilling programme with
71,000m budgeted for upgrading indicated material to measured, 54,000m to upgrade inferred material to
indicated, and 12,500m of geotechnical drilling.
Sprott Capital Partners Equity Research
18You can also read