DRAFT 2018/2020/2022 West Virginia Integrated Water Quality Monitoring and Assessment Report
←
→
Page content transcription
If your browser does not render page correctly, please read the page content below
DRAFT
   2018/2020/2022 West Virginia Integrated Water
      Quality Monitoring and Assessment Report

Prepared to fulfill the requirements of Section 303(d) and 305(b) of the federal Clean Water Act and
Chapter 22, Article 11, Section 28 of the West Virginia Water Pollution Control Act for the period of
                                 July 2016 through December 2020.

                     Prepared by the Division of Water and Waste Management

                                             Jim Justice
                                              Governor

                                          Harold Ward
                                       Cabinet Secretary
                              Department of Environmental Protection

                                        Katheryn D. Emery
                                         Division Director
                             Division of Water and Waste Management
Combined 2018/2020/2022 WV Integrated Water Quality Monitoring and Assessment Report

                                                            Table of Contents
1.0      Introduction..............................................................................................................1
  What is new? ............................................................................................................................ 1
      Web-based Interactive Resources ............................................................................................................1
      Assessment Units ....................................................................................................................................2
      Extended Assessment Periods for Combined Cycles ...................................................................................3
      Data Presentation ...................................................................................................................................4

2.0      Water Quality Standards ............................................................................................4
3.0      WVDEP Surface Water Monitoring ..............................................................................6
  3.1        Streams and Rivers ......................................................................................................... 9
      Ambient Water Quality Monitoring Network ..............................................................................................9
      Probabilistic (Random) Sampling ..............................................................................................................2
      Pre-Total Maximum Daily Load (TMDL) Development Monitoring ...............................................................2
      Targeted Monitoring ................................................................................................................................3
      Long Term Monitoring Sites (LTMS) .........................................................................................................3
      Continuous Monitoring ............................................................................................................................3
  3.2        Lakes and Reservoirs ....................................................................................................... 4
  3.3        Wetlands ........................................................................................................................ 5
  3.4        Other Monitoring ............................................................................................................. 6
      Harmful Algal Blooms ..............................................................................................................................6
      Filamentous Algae ...................................................................................................................................7
      Fish tissue ..............................................................................................................................................7

4.0      Third Party Monitoring and Data ................................................................................7
5.0      Use Assessment Procedures ......................................................................................8
  5.1        Assigning Integrated Report Categories ............................................................................ 9
      Integrated Report Category 1, 2, or 3 ......................................................................................................9
      Integrated Report Category 4 or 5 ......................................................................................................... 10
  5.2        Data for Assessment ..................................................................................................... 10
  5.3        Numeric Water Quality Criteria ....................................................................................... 11
      Chronic Criteria Protective of Aquatic Life ............................................................................................... 12
      Acute Criteria Protective of Aquatic Life .................................................................................................. 13
      Nutrient Criteria for Lakes to Protect Aquatic Life and Contact Recreation ................................................. 13
      Fecal Coliform Numeric Criteria for Contact Recreation and Drinking Water .............................................. 13
      Continuous Monitoring Data................................................................................................................... 14
      Ohio River – Total Iron Aquatic Life Standards ........................................................................................ 15
  5.4        Narrative Water Quality Criteria – Biological Impairment Data ........................................... 15
  5.5        Narrative Water Quality Criteria - Fish Tissue and Consumption Advisories ......................... 17
  5.6        Narrative Water Quality Criteria – Filamentous Algae........................................................ 18
6.0      Assessment Results ................................................................................................. 19
  6.1        IR Category Results....................................................................................................... 19
      Streams................................................................................................................................................ 19
      Lakes ................................................................................................................................................... 20
  6.2        Use Support Results ...................................................................................................... 21
  6.3        Causes for Impairment .................................................................................................. 24
  6.4        Filamentous Algae Resulting in Delisting ......................................................................... 28

                                                                               i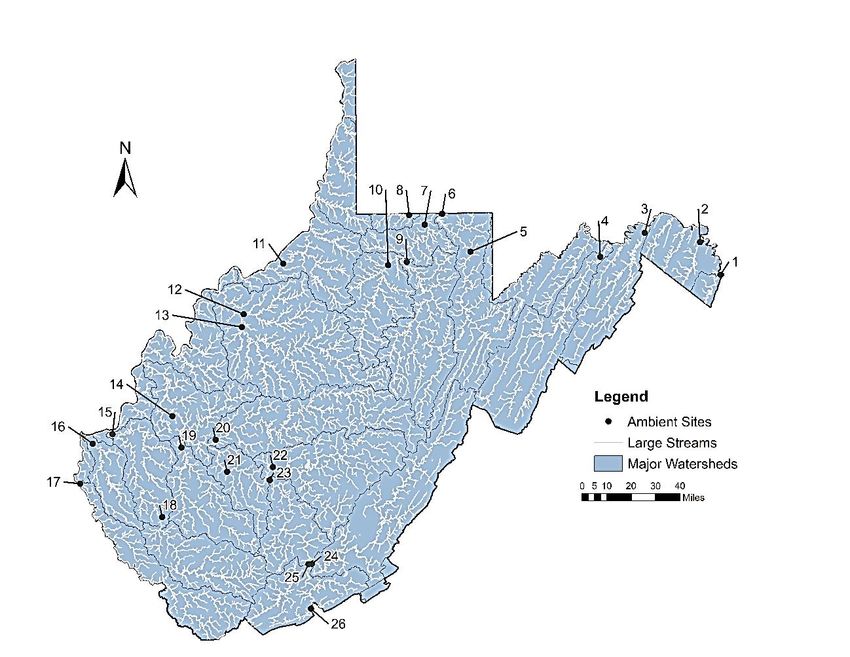
Combined 2018/2020/2022 WV Integrated Water Quality Monitoring and Assessment Report

7.0       Probabilistic Data Summary ..................................................................................... 30
   7.1        Indicators of Stream Condition ....................................................................................... 32
       Biological Community ............................................................................................................................ 32
       Water Quality Indicators of Aquatic Integrity .......................................................................................... 34
       Habitat Indicators of Aquatic Integrity .................................................................................................... 41

8.0       Total Maximum Daily Load (TMDL) Development Process .......................................... 45
9.0       Interstate Water Coordination .................................................................................. 47
   9.1        Virginia DEQ on Bluestone River PCB monitoring and TMDL development .......................... 47
   9.2        Virginia DEQ on New River PCB TMDL development ......................................................... 48
   9.3        Ohio River Valley Water Sanitation Commission – ORSANCO ............................................. 48
   9.4        Chesapeake Bay............................................................................................................ 48
   9.5        Interstate Commission on Potomac River Basin................................................................ 49
10.0      Water Pollution Control Programs............................................................................. 49
   10.1       Division of Water and Waste Management ...................................................................... 49
   10.2       National Pollution Discharge Elimination System (NPDES) Program .................................... 49
   10.3       Nonpoint Source Control Program................................................................................... 50
   10.4       Groundwater Program ................................................................................................... 51
   10.5       Division of Mining and Reclamation ................................................................................. 52
11.0      Cost Benefit Analysis ............................................................................................... 52
   11.1       Clean Water State Revolving Fund Program ..................................................................... 53
       Low Interest Loan Program ................................................................................................................... 53
       Agriculture Water Quality Loan Program ................................................................................................. 53
       Onsite Systems Loan Program ............................................................................................................... 54
   11.2       Cost Benefit Analysis Conclusion ..................................................................................... 54
12.0 Public Participation And Responsiveness Summary ...................................................... 54

                                                               List of Tables
Table 1: West Virginia Water Use Designations ............................................................................5
Table 2: Monitoring Activities from 2016-2020 .............................................................................7
Table 3: Data contributors for the 2016 303(d) List and Integrated Report .....................................8
Table 4: Integrated Report Categories for West Virginia Waters ....................................................9
Table 5: Guidance to determine status when assessing parameters for chronic criteria protective of
     aquatic life. ...................................................................................................................... 12
Table 6: 2016 Category Summary for West Virginia Stream Assessment Units (AUs) ..................... 19
Table 7: 2016 Category Summary for West Virginia Lake Assessment Units (AUs) ......................... 21
Table 8: Designated use support summary for all West Virginia assessment units by count............ 22
Table 9: Designated use support summary for West Virginia streams........................................... 23

                                                                            ii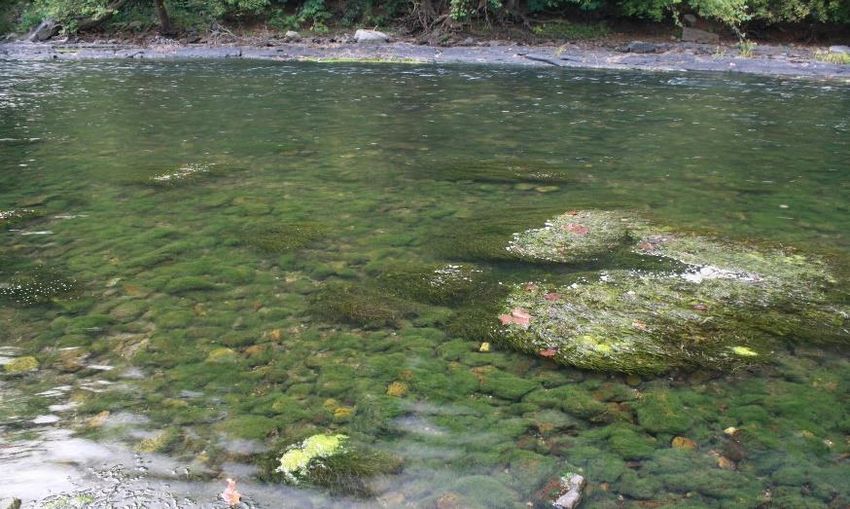
Combined 2018/2020/2022 WV Integrated Water Quality Monitoring and Assessment Report

Table 10: Designated use support summary for West Virginia lakes. ............................................ 23
Table 11: Summary of impairment causes for West Virginia streams shown in miles. .................... 24
Table 12: Summary of impairment causes for West Virginia lakes shown in acres. ........................ 25
Table 13: DEP TMDL Development in 2016-2020 ....................................................................... 46
Table14: WVDEP-DWWM-Permit Branch NPDES Permit Action Summary ..................................... 50

                                                      List of Figures
Figure 1-1: Comparison of the streamline resolution in the 2016 Integrated Report with additions for
     this Combined Integrated Report. ........................................................................................3
Figure 3-1: West Virginia Watershed Framework Groupings ..........................................................7
Figure 3-2: West Virginia Ambient Monitoring Sites .................................................................... 10
Figure 6-1: Stream miles broken out into overall IR Categories.................................................... 20
Figure 6-2: Lake areas broken out into overall IR Categories. ...................................................... 21
Figure 6-3: Chart showing a breakdown of stream miles with parameter attainment or impairment.26
Figure 6-4: Chart showing a breakdown of lake acres with parameter attainment or impairment. ... 27
Figure 6-5: Observed filamentous algae coverage in the Greenbrier River. ................................... 28
Figure 7-1: West Virginia Ecoregions ......................................................................................... 31
Figure 7-2: West Virginia Basins ............................................................................................... 32
Figure 7-3: Biological Health – Benthic Macroinvertebrate Community IBI Scores for GLIMPSS at Genus
     Level (except Chironomidae) ............................................................................................. 33
Figure 7-4: Average Specific Conductance at 12-digit-HUC Scale Watersheds in West Virginia ........ 35
Figure 7-5: Specific Conductance in West Virginia Streams.......................................................... 35
Figure 7-6: Sulfate in West Virginia Streams .............................................................................. 36
Figure 7-7: Fecal Coliform Bacteria in West Virginia Streams ....................................................... 37
Figure 7-8: Acidic Streams in West Virginia as Indicated by pH.................................................... 38
Figure 7-9: Dissolved Organic Carbon (mg/L) in West Virginia Streams ........................................ 39
Figure 7-10: Hardness (mg/L) in West Virginia Streams .............................................................. 40
Figure 7-11: Hardness (mg/L) in West Virginia HUC 12 Watersheds ............................................. 40
Figure 7-12: Overall Stream Habitat (RBP Total Score) in West Virginia Streams ........................... 42
Figure 7-13: Embeddedness Scores in West Virginia Streams ...................................................... 43
Figure 7-14: Riparian Zone Vegetation Scores in West Virginia Streams ....................................... 44
Figure 7-15: Trash/Aesthetic Scores in West Virginia Streams ..................................................... 45

                                                                  iii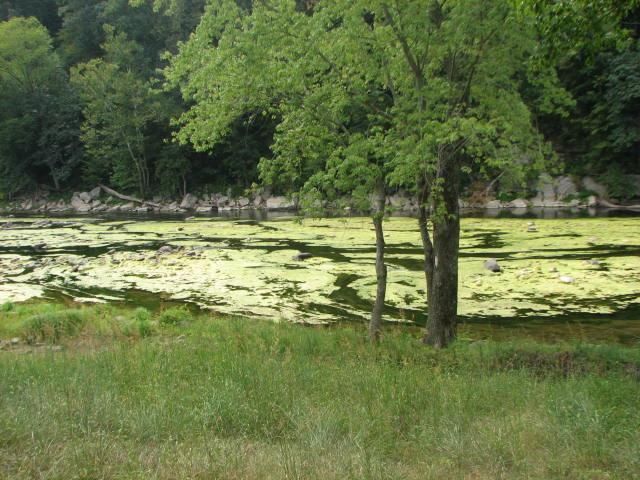
Combined 2018/2020/2022 WV Integrated Water Quality Monitoring and Assessment Report

1.0 INTRODUCTION
The federal Clean Water Act and 40CFR§130.8 contain requirements to report on the quality of a state’s
waters. Section 305(b) of the Clean Water Act requires a comprehensive biennial report. Section 303(d)
requires, from time to time, a list of waters for which effluent limitations or other controls are not sufficient
to meet water quality standards, referred to as impaired waters. Section 314 specifies that states will report
an assessment of the water quality of all publicly owned lakes, including the status and trends of such
water quality. In addition to federal requirements, West Virginia Code Chapter 22, Article 11, Section 28
also requires a biennial report of the quality of the state’s waters. The United States Environmental
Protection Agency (USEPA) has recommended these requirements be accomplished in a single report,
referred to as an Integrated Report, which combines the comprehensive Section 305(b) report on water
quality, the Section 303(d) list of waters that are not meeting water quality standards, and Section 314
assessment of publicly own lakes.

The WVDEP has prepared this Integrated Report to communicate the quality of the state’s waters, as well
as to explain the methods to assess and report on water quality. WVDEP will also be reporting results of
the assessments to the USEPA through the recently developed Assessment, Total Maximum Daily Load
(TMDL) Tracking and Implementation System (ATTAINS). To remain consist with reporting through
ATTAINS, this Integrated Report and data preparation have been organized differently, however,
assessment methodologies have remained consistent with past reporting cycles in most instances, unless
identified.

While Integrated Reports are normally published for two-year cycles, WVDEP encountered several
circumstances that delayed the release of the 2018 and 2020 cycle reports. For this reason, WVDEP is
taking advantage of an opportunity to publish a combined Integrated Report that covers three cycles: 2018,
2020, and 2022. This opportunity allows WVDEP to fulfill reporting requirements while streamlining the
process to assess data, obtain input from the public, and obtain USEPA approval.

What is new?

Web-based Interactive Resources

ATTAINS is a relatively new internet-based data management system prepared by the USEPA to better
track reported water quality, restoration planning, and implementation consistently across all regions and
states. The data reported to USEPA through ATTAINS is made available through public information web
applications such as How’s My Waterway (https://mywaterway.epa.gov/). While these federal tracking
systems and applications are undergoing continued development and maintenance, the best source of
information regarding the WV water quality and restoration plans remains the WVDEP webpage. To help
navigate the webpages and to provide an interactive platform to visualize the data presented in this
Integrated Report, WVDEP has prepared an interactive ESRI StoryMap.

                                                       1
Combined 2018/2020/2022 WV Integrated Water Quality Monitoring and Assessment Report

Assessment Units

The most significant change to the Integrated Report and assessment methodology is the creation of
relatively static assessment units on which all assessments are conducted.

Previously, the Integrated Report presented impairment for individual bodies of water and identified if the
impairment/attainment status applied to the “entire length” of stream, “entire lake”, or some portion of the
stream or lake. The majority of listed streams were identified as impaired for their entire length.
Segmentation occurred only in situations involving streams with impoundments, streams with more than
one designated use (ex. partial trout streams), streams when knowledge of a specific pollutant source
allowed clear distinction of impaired and unimpaired segments, or streams with multiple monitoring
locations with differing results. In the latter scenario, if water quality results from one monitoring location
indicated impairment, the stream was considered impaired until data sampled from a downstream or
upstream monitoring station indicated attainment of the water quality criterion.

Using the previous strategy for stream segmentation, when new monitoring stations were added between
reporting cycles, the segments of a water body could be re-delineated. Tracking changes in impairment or
attainment of specific portions of a stream from one cycle to the next was challenging. Moving forward,
the newly established assessment units will not be re-delineated between cycles. Instead, any data
collected from an existing or new monitoring station anywhere on the assessment unit reach will be
assessed to make impairment/attainment determinations. Every assessment unit in the state is tracked in
ATTAINS, so understanding changes in assessment status will be more straightforward.

The newly established assessment units were delineated based on designated uses, existing impairments,
drainage area size, upland landuse, influence from tributaries, existing loading scenarios from TMDLs,
and other site-specific considerations. This strategy for delineating relatively static assessment units will
not only conform to data rules in ATTAINS but is also expected to align more appropriately with TMDL
model predictions of impairment and attainment. See TMDL Development Process for more information
on how assessment units will be used in TMDLs.

In order to retain impairment status and ensure known water quality issues are addressed in the future, if
a newly delineated assessment unit includes any segment previously identified as impaired, the entirety
of the new assessment unit is considered impaired. There may be exceptions to this general rule when
examining a scenario where the original impaired reach comprises a relatively insignificant length of the
newly delineated assessment unit. A different attainment call may be made for an assessment unit, if
supported by an examination of landuse, pollutant sources, and historical data. These determinations are
made on a case-by-case scenario. A crosswalk between the previously listed stream codes and new
assessment unit identifiers (AUIDs) is provided in a Google Sheets workbook named “WV 2016_2022
AUID Crosswalk Final” at the following website:

https://dep.wv.gov/wwe/watershed/ir/pages/303d_305b.aspx

Assessment units are identified alphanumerically based on coding from a 1:24,000 scale stream layer
obtained and adapted from the National Hydrologic Dataset (NHD). WVDEP has joined data from this

                                                      2
Combined 2018/2020/2022 WV Integrated Water Quality Monitoring and Assessment Report

refined stream layer to existing stream codes and names originally derived from a 1:100,000 scale stream
layer. As a result, the coding system used to identify streams/stream reaches is different. There were
approximately 12,000 assessment units in the 2016 Integrated Report. In comparison using the new NHD
1:24,000 scale streamlines to derive the assessment units, there are now nearly 47,500 assessment units
loaded to ATTAINS. Because the scales of the streamlines are so different, many more small streams are
represented that have not been monitored or assessed. See Figure 1-1 to visualize the difference the change
in streamline scales makes.

Figure 1-1: Comparison of the streamline resolution in the 2016 Integrated Report with
additions for this Combined Integrated Report.

Extended Assessment Periods for Combined Cycles

In order to complete a combined 2018/2020/2022 Integrated Report, assessments were conducted for data
collected between July 1, 2012 and December 31, 2020 by the WVDEP’s Division of Water and Waste
Management Watershed Assessment Branch, as well as, other federal, state, private and nonprofit
organizations. This assessment period was established based on the following rationale: an assessment
period for the 2018 report would have normally included data collected through June 30, 2017. Following
established protocols, any data collected up to five years prior to that date would be considered in
assessment, so July 1, 2012 through June 30, 2017 for the 2018 cycle. To streamline data assessment, all
data from July 1, 2012 through the 2022 cycle data cut-off date of December 31, 2020 were assessed at
the same time. The 2022 cut-off date for data was established as a result of the monitoring delays due to
COVID-19 pandemic travel restrictions. Data collected after December 31, 2020 were considered on a
limited basis when additional data were needed to finalize an assessment decision (e.g., when a second

                                                    3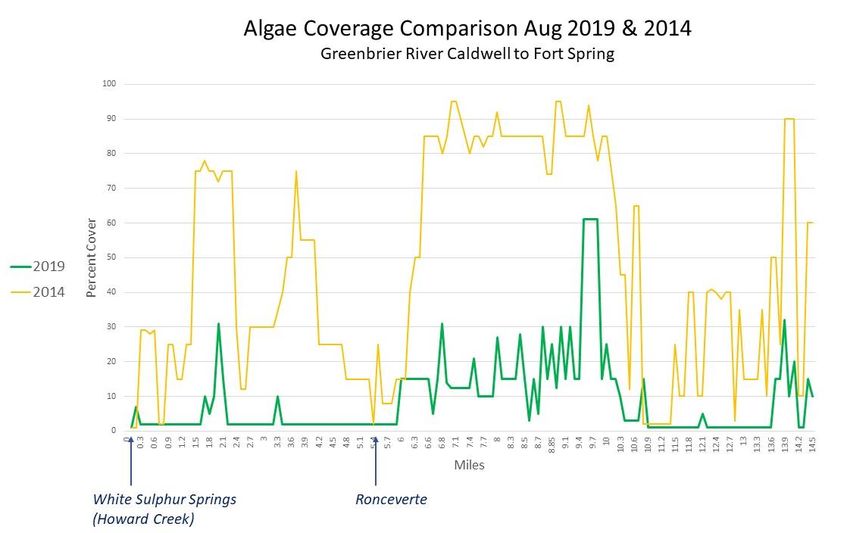
Combined 2018/2020/2022 WV Integrated Water Quality Monitoring and Assessment Report

biological sample was required). A 2018, 2020, or 2022 cycle year designation for newly identified
impairment assessment units was accomplished by examining the monitoring sample date range for each
assessment unit.

Data Presentation

This report references an interactive ESRI StoryMap. With nearly 47,500 assessments units, the amount
of data to be shown on a map of the entire state can be overwhelming. As demonstrated above, many new
assessment units represent small unassessed streams and lakes. In addition, streams that were once
identified as “entire length” have been segmented to create the static assessments units, even in situations
where no monitoring stations exist. In total there are 40,529 unassessed assessment units. The ESRI
StoryMap will provide a layer of unassessed streams and a layer of unassessed lakes. The focus of the
ESRI StoryMap will be the assessed stream and lake assessment units to display information regarding
use attainment and impairment. The ESRI StoryMap can be accessed here:

https://2018-2022-combined-integrated-report-wvdep.hub.arcgis.com/

2.0 WATER QUALITY STANDARDS
Water quality standards are the basis of the assessment process. In West Virginia, the water quality
standards are codified as 47CSR2 – Legislative Rules of the Department of Environmental Protection –
Requirements Governing Water Quality Standards. Impairment assessments conducted for the Integrated
Report are based only upon water quality standards that have received the EPA’s approval and are
currently considered effective for Clean Water Act purposes. Information regarding the Water Quality
Standards can be found at: http://www.dep.wv.gov/WWE/Programs/wqs/Pages/default.aspx. Standards
are expressed as numeric or narrative criteria.

ATTAINS uses the term “parameter” to refer to different criteria for which data are collected and assessed.
When assessing parameters, WVDEP determines if a parameter is the cause of impairment for a water
body or whether the parameter data meets water quality standards. In some instances, if too few data are
available, it may not be possible to determine if a certain parameter is causing impairment or attaining
water quality standards. In those instances, WVDEP reports that there were insufficient data to assess. If
no data are available, a parameter will be reported as unassessed.

Every waterbody is assigned designated uses, described in detail beginning in Section 6.2 of 47CSR2 and
summarized in Table 1. Each of the designated uses has associated water quality criteria that describe
specific conditions that must be met to ensure that the waterbody can support that use. For example,
Category B1 – Warm water fishery use requires that the pH remain within the range of 6.0 to 9.0 standard
units. If water quality monitoring finds that the pH is below 6 or above 9, the waterbody is considered
impaired, because it is not supporting its designated use. See the Assessment Methodology section of this
Integrated Report for more information on use attainment determination.

                                                     4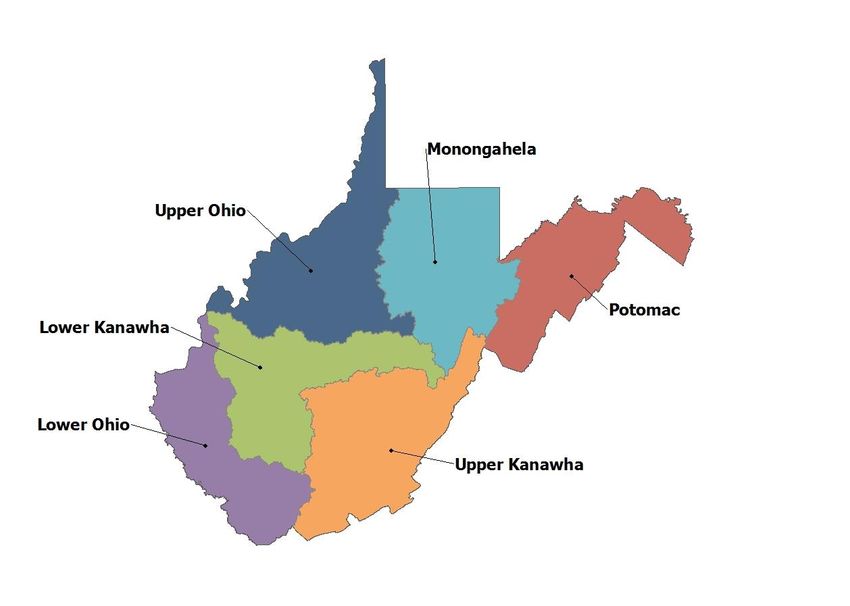
Combined 2018/2020/2022 WV Integrated Water Quality Monitoring and Assessment Report

Table 1: West Virginia Water Use Designations
 Category   Use Subcategory     Use Category                                 Description
    A       Public Water        Human           Waters, which after conventional treatment, are used for human
                                Health          consumption.
    B1      Warm Water          Aquatic Life    Propagation and maintenance of fish and other aquatic life in
            Fishery                             streams or stream segments that contain populations composed
                                                of all warm water aquatic life.
    B2      Trout Waters        Aquatic Life    Propagation and maintenance of fish and other aquatic life in
                                                waters that sustain year-round trout populations. Excluded are
                                                those waters which receive annual stockings of trout, but which
                                                do not support year-round trout populations.
    B4      Wetlands            Aquatic Life    Propagation and maintenance of fish and other aquatic life in
                                                wetlands. Wetlands generally include swamps, marshes, bogs,
                                                and similar areas.
     C      Water Contact       Human           Swimming, fishing, water skiing, and certain types of pleasure
            Recreation          Health          boating such as sailing in very small craft and outboard
                                                motorboats. In ATTAINS, Category C is split into subcategories:
                                                Water Contact Recreation - Recreation and Water Contact
                                                Recreation - Fish Consumption. The Fish Consumption
                                                subcategory applies specifically to those waters for which the
                                                State has published advisories limiting consumption, described
                                                in Section 5.7. This distinction is needed to inform How’s My
                                                Waterway. The Fish Consumption subcategory is applied to all
                                                waters in the state in this reporting cycle.
    D1      Irrigation          All Other       All stream segments used for irrigation.
    D2      Livestock           All Other       All stream segments used for livestock watering
            Watering
    D3      Wildlife            All Other       All stream segments and wetlands used by wildlife.
    E1      Water Transport     All Other       All stream segments modified for water transport and having
                                                permanently maintained navigation aids.
    E2      Cooling Water       All Other       All stream segments having one or more users for industrial
                                                cooling.
    E3      Power Production    All Other       All stream segments extending from a point 500 feet upstream
                                                from the intake to a point one-half mile below the wastewater
                                                discharge point.
    E4      Industrial          All Other       All stream segments with one or more industrial users. It does
                                                not include water for cooling.

Numeric water quality criteria consist of a concentration value, exposure duration and an allowable
exceedance frequency. The water quality standards prescribe numeric criteria for all designated uses. For
the B1, B4 and B2 Aquatic Life uses, there can be two forms of criteria for each parameter: an acute
criterion that prevents lethality, and chronic criterion that prevents retardation of growth and reproduction.
The numeric criteria for acute aquatic life protection are specified as one-hour average concentrations that
are not to be exceeded more than once in a three-year period. The criteria for chronic aquatic life protection

                                                      5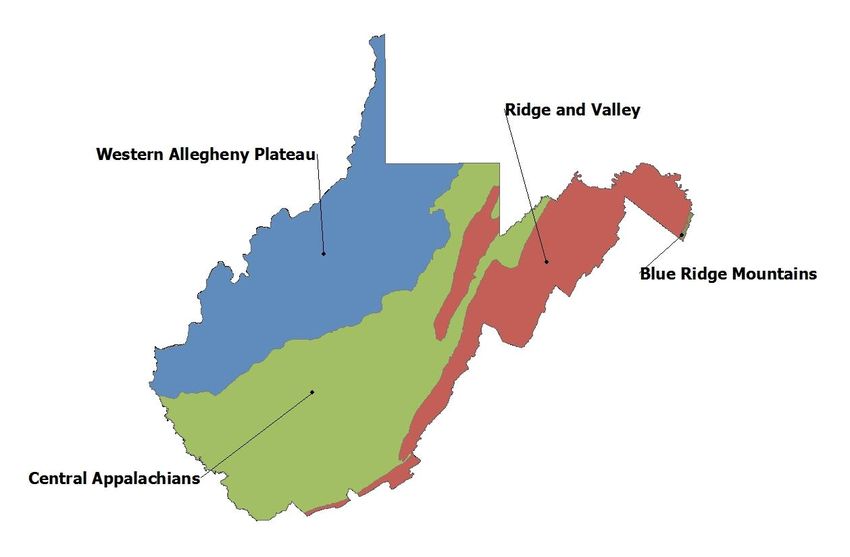
Combined 2018/2020/2022 WV Integrated Water Quality Monitoring and Assessment Report

are specified as four-day average concentrations that are not to be exceeded more than once in a three-
year period. The exposure time criterion for human health protection (i.e., Category Uses A and C) is
specified as an annual geometric mean and there are no allowable exceedances.

Narrative water quality criteria are also referred to as conditions not allowable (CNA). For example, the
water quality standards contain a provision stating that wastes, present in any waters of the state, shall not
adversely alter the integrity of the waters or cause significant adverse impact to the chemical, physical,
hydrologic, or biological components of aquatic ecosystems. WVDEP has a protocol to determine if
waters exhibit conditions not allowable for the biological component (CNA-biological), which relies upon
index of biological integrity for benthic macroinvertebrates referred to as the West Virginia Stream
Condition Index (WVSCI). Narrative criteria are contained in 47CSR2. More information regarding the
use of narrative criteria is contained in the Use Assessment Procedures section.

Ohio River Criteria

For the Ohio River, both the Ohio River Valley Water Sanitation Commission (ORSANCO) and West
Virginia water quality criteria were considered, as agreed upon in the ORSANCO compact. Where both
ORSANCO and West Virginia standards contain a criterion for a particular parameter, instream values
were compared against the more stringent criterion. WVDEP supports ORSANCO’s efforts to promote
consistent decisions by the various jurisdictions with authority to develop 305(b) reports and 303(d) lists
for the Ohio River. In support of those efforts, West Virginia has and will continue to work with
ORSANCO and the other member states through a workgroup charged with improving consistency of
305(b) reporting among compact states. ORSANCO standards may be reviewed at:

http://www.orsanco.org/programs/pollution-control-standards/

3.0 WVDEP SURFACE WATER MONITORING
This section describes West Virginia’s strategy to monitor and assess the surface waters of the state. The
Watershed Assessment Branch is responsible for general water quality monitoring and assessing
throughout the state. Visit the WV Integrated Report interactive ESRI StoryMap to see the monitoring
station locations for the entire state. Planning and monitoring follow the watershed grouping framework,
in which the state’s 32 USGS 8-digit Hydrologic Unit Code (HUC) watersheds are organized into one of
five groups, A-E (Figure 3-1).

                                                      6
Combined 2018/2020/2022 WV Integrated Water Quality Monitoring and Assessment Report
Figure 3-1: West Virginia Watershed Framework Groupings
Using the watershed framework, the focus of several monitoring programs rotates from one grouping to
the next each year, while other programs retain a statewide focus every year. At times, given program
goals and requirements, the schedule for monitoring has deviated from the rotating framework. This has
occurred primarily in the pre-TMDL monitoring program when the priority or quantity of impairments on
the 303d list influence a decision to target specific watersheds.
Table 2 provides a summary of monitoring activities that occurred during 2016-2020. The remainder of
this section describes each Watershed Assessment Branch monitoring program in detail.
Table 2: Monitoring Activities from 2016-2020
Monitoring Effort
Ambient 26 Ambient Sites are currently and will continue to be monitored monthly in the Monongahela
River Basin Sites or bi-monthly for all other ambient sites. Ambient monitoring resulted in 881
samples being collected between 2016-2020.
7Combined 2018/2020/2022 WV Integrated Water Quality Monitoring and Assessment Report
Monitoring Effort
Probabilistic Probabilistic monitoring is conducted at random locations for statistical comparisons. A fourth
round of probabilistic monitoring was completed in 2018. A fifth round was started in 2019.
Probabilistic monitoring resulted in 299 samples being collected from 278 streams within 32 major
watersheds from 2016-2020.
Pre-TMDL Pre-TMDL development monitoring was completed in the Upper Guyandotte River Watershed in
2016; for select streams in the Lower Ohio, Big Sandy, and Twelvepole Creek watersheds in 2017;
in the Lower Guyandotte River Watershed in 2018; in the Tug Fork River Watershed in 2019
(additional monitoring for the Tug Fork River mainstem continued into 2020), in the Little
Kanawha River Watershed in 2020.
Targeted Targeted Sampling was completed at 388 sites on 309 streams in 25 watersheds representing all
five Hydrologic Groups (A-E) from 2016 through 2020.
Lakes Seven lakes from Group A, 7 lakes from Group B, 9 lakes from Group C, and 7 lakes from Group D
were sampled at one or more monitoring locations four times during the May – October
assessment seasons in 2016, 2017, 2018, and 2019, respectively. A full round of lake monitoring
was not conducted in 2020 due to COVID travel restrictions.
Continuous Continuous water quality meters were deployed at 133 locations on 106 streams during the 2016-
2020 term. Parameters measured include pH, temperature, conductivity, dissolved oxygen, and
turbidity.
Long Term Long Term Monitoring Sites (LTMS) – 318 sites were sampled during the 2016-2020 sampling
seasons representing all five Hydrologic Groups.
Wetlands WVDEP has completed 107 probabilistic West Virginia Wetland Rapid Assessment Method
(WVWRAM) assessments during the first two years of its first 5-year-round of stratified
probabilistic wetland monitoring.
Harmful Algal Harmful Algal Bloom (HAB) monitoring occurs in response to a potential HAB sighting reported to
Bloom the WVDEP. In addition, in the summer of 2019, the WVDEP Watershed Assessment Branch
implemented a Harmful Algal Bloom Long-Term Trend Sampling program. In total, 15 sites were
selected with an approximate statewide distribution, focusing on larger waterbodies including
rivers, large streams, and lakes.
Filamentous WVDEP monitors numerous rivers in the state for filamentous algae blooms, including the
Algae Greenbrier River, Tygart River, South Branch Potomac River and the Cacapon Rivers. Monitoring
generally occurs in late summer - to early fall when flows lower and temperatures begin to rise in
the rivers.
Fish Tissue Monitoring from 2016-2020 resulted in the analysis of 407 samples for PCBs and mercury, and 174
for selenium. These samples were collected from 27 HUC-8 watersheds representing 55 different
waterbodies, including 11 lakes.
The Watershed Assessment Branch water quality data and biological data is currently available at:
https://apps.dep.wv.gov/dwwm/wqdata/. Data from the Watershed Assessment Branch databases are also
being prepared to share on the Water Quality Exchange (WQX) network. The WQX is a mechanism
through which data partners can submit water quality data to the USEPA for access publicly through the
Water Quality Portal. Currently, a limited amount of the Watershed Assessment Branch data has been
uploaded to WQX.
8Combined 2018/2020/2022 WV Integrated Water Quality Monitoring and Assessment Report
3.1 Streams and Rivers
West Virginia has a comprehensive strategy for monitoring streams and rivers. The Watershed
Assessment Branch utilizes a tiered approach, collecting data from long-term monitoring stations, targeted
sites within watersheds on a rotating basin schedule, randomly selected sites, and sites chosen to further
define impaired stream segments in support of TMDL development. The following paragraphs further
describe these programs. For full details on monitoring programs see the Watershed Assessment Branch
Field Sampling Standard Operating Procedure at:
https://dep.wv.gov/WWE/watershed/Pages/WBSOPs.aspx.
Ambient Water Quality Monitoring Network
The ambient water quality monitoring network concept was established in the mid-1940s. The network
currently consists of 26 fixed stations that are sampled monthly or in the Monongahela River basin, bi-
monthly. Sampling stations are generally located near the mouths of the state’s larger rivers and are co-
located with USGS stream gages. Biological monitoring using benthic macroinvertebrate communities is
conducted once annually at or near 20 of these stations. The data provides information for trend analyses,
general water quality assessments and pollutant loading calculations, and allows water resources managers
to quickly gauge the health of the state’s major waterways. Ambient water quality monitoring resulted in
881 samples being collected between 2016 and 2020. The stations are displayed on Figure 3-2 and listed
below.
9Combined 2018/2020/2022 WV Integrated Water Quality Monitoring and Assessment Report
1. Shenandoah River at Harpers Ferry 14. Kanawha River at Winfield
2. Opequon Creek east of Bedington 15. Guyandotte River at Huntington
3. Cacapon River near Great Cacapon 16. Twelvepole Creek south of Ceredo
4. SB Potomac River near Springfield 17. Tug Fork at Fort Gay
5. Cheat River at Albright 18. Guyandotte River at Pecks Mill
6. Cheat River below Cheat Lake 19. Coal River at Tornado
7. Monongahela River in Star City 20. Elk River at Coonskin Park
8. Dunkard Creek east of Pentress 21. Kanawha River at Chelyan
9. Tygart Valley River at Colfax 22. Gauley River at Beech Glen
10. West Fork River at Enterprise 23. New River above Gauley Bridge
11. Middle Island Creek at Arvilla 24. Greenbrier River at Hinton
12. Hughes River west of Freeport 25. New River at Hinton
13. Little Kanawha River at Elizabeth 26. New River at Virginia State line
Figure 3-2: West Virginia Ambient Monitoring Sites
10Combined 2018/2020/2022 WV Integrated Water Quality Monitoring and Assessment Report
Probabilistic (Random) Sampling
In 1997, the Watershed Assessment Branch began sampling sites selected through the USEPA’s random
stratified procedure to better assess the ecological health of watersheds and ecoregions within the state.
The data generated from this random stratified (also known as probabilistic) sampling effort allows the
WVDEP and the USEPA to make statistically valid assessments of aquatic integrity on a statewide basis
as well as make comparisons between watersheds and ecoregions. The data also assists in monitoring
long-term trends in watershed and ecoregion health. The WVDEP has completed four rounds of
probabilistic monitoring. WVDEP started a fifth round of probabilistic sampling in 2019. A full round of
monitoring is normally conducted over a five-year period in order to characterize conditions in wadeable
streams over a range of baseflow regimes and weather conditions. Probabilistic monitoring resulted in 299
samples being collected from 278 streams within 32 major watersheds from 2016-2020. Further details
are provided in the section titled Probabilistic Data Summary.
Pre-Total Maximum Daily Load (TMDL) Development Monitoring
The primary objective of this major effort is to collect sufficient data for Total Maximum Daily Load
(TMDL) modelers to develop stream restoration plans. Pre-TMDL monitoring has traditionally followed
the 5-year framework cycle, (i.e., impaired streams from watersheds in Hydrologic Group A were sampled
in the same year as sampling by other stakeholder agencies participating in the watershed management
framework). The 303(d) list is the basis for initial site selection and additional sites are added to
comprehensively assess tributary waters and to allow identification of the suspected sources of
impairment. More recently, to address impairments that have been listed for several years, watersheds
were selected for TMDL development outside of the schedule established by the framework cycle.
Pre-TMDL development monitoring was completed for the Upper Guyandotte River Watershed in 2016;
for select streams in the Lower Ohio River, Big Sandy River, and Twelvepole Creek Watersheds in 2017;
and for the Lower Guyandotte Watershed in 2018. WVDEP monitoring for the Tug River watershed was
completed in 2019 for most streams. The exception was in the Tug River mainstem. These sites were
monitored for an extended period of time to coincide with a monitoring project in the seven largest
tributaries draining from Kentucky into the Tug River. Pre-TMDL monitoring began in the Little Kanawha
River watershed (except Hughes River) in 2019. Due to travel restrictions resulting from the COVID-19
pandemic, sampling in most streams was extended to December 2020. To conform to a revised assessment
procedure for CNA-biological, additional benthic macroinvertebrate monitoring occurred in these
watersheds beyond the scheduled pre-TMDL program timelines to obtain second samples where needed.
Pre-TMDL monitoring for the Cacapon River watershed commenced in June 2021 and should be
completed in 2022. These data were not considered in this assessment cycle, except for instances to verify
listing/delisting decisions based on third party monitoring data.
Pre-TMDL monitoring is intensive, consisting of monthly sampling for parameters of concern, which
captures data under a variety of weather conditions and flow regimes. Pre-TMDL monitoring also includes
2Combined 2018/2020/2022 WV Integrated Water Quality Monitoring and Assessment Report
an effort to locate the specific sources of impairment, with particular attention paid to identifying pollutant
sources and land use stressors. For more information, see the TMDL Development Process section.
Targeted Monitoring
Targeted monitoring has been a component of West Virginia’s assessment strategy since the Watershed
Assessment Program’s inception in late 1995. Streams are sampled on a five-year rotating basin approach.
Sites are selected from the watersheds targeted for sampling each year. Each site is subjected to a one-
time evaluation of riparian and instream habitat, basic water quality parameters, and benthic
macroinvertebrate communities.
Sites are selected to meet a variety of informational needs in the following areas:
• Impaired streams
• Reference streams (minimally impacted)
• Spatial trends (multiple sites on streams exceeding 15 miles in length)
• Areas of concern as identified by the public and stakeholders
• Previously unassessed streams
Targeted Sampling was completed at 388 sites on 309 streams in 25 watersheds representing all five
Hydrologic Groups (A-E) from 2016 through 2020.
Long Term Monitoring Sites (LTMS)
Data from LTMS are used to monitor water quality and habitat trends over time at targeted wadeable
streams throughout the state. The stations represent a wide array of impairments commonly identified in
WV (acid mine drainage, acid deposition, sediment, nutrient enrichment, etc.). Importantly, the network
also includes streams that represent reference or best-attainable conditions.
Sampling frequency is variable. Most sites are sampled annually, while others are sampled every two to
three years. Critical elements include habitat evaluations, benthic macroinvertebrate assemblages, on-site
measurements, and water quality sampling (Refer to Table 2 for details). The sampling events take place
between March and October, inclusive. Most sites are sampled once per year; however, a subset of the
LTMS sites is sampled twice per year to document seasonal differences.
During the 2016-2020 sampling seasons, 318 LTMS sites were sampled representing all five Hydrologic
Groups.
Continuous Monitoring
Deployable sondes are used for a variety of applications to provide more detailed information on a stream.
These devices can capture conditions that may not be captured with grab samples, such as diurnal changes
and episodic events. These devices are used to support existing studies, such as TMDL development and
trout stream determinations. As these units are frequently moved to meet the agency’s needs, the number
of sites is variable.
3Combined 2018/2020/2022 WV Integrated Water Quality Monitoring and Assessment Report
Typically, the sondes are programmed to record parameters hourly. However, if frequent fluctuations in
water quality are suspected, parameters may be recorded at 30-minute or 15-minute intervals. Deployed
sondes are visited a minimum of once per month to download data, perform maintenance, and to retrieve
or replace the sonde. A critical element is conducting discrete checks, wherein a second recently calibrated
multi-probe meter is used to record field readings (temperature, pH, dissolved oxygen, and/or
conductivity) immediately adjacent to the deployed unit. The discrete check provides a fresh baseline and
aids in compensating for drift in the deployed unit’s recordings.
Data recorded by deployable sondes were not included in this assessment effort, as processes to assure
quality are still being finalized before developing an assessment methodology. Discreet samples collected
during deployment and during monthly maintenance are included in assessments for the Integrated Report.
More than one is collected at each site during a maintenance visit to allow for deployable data quality
control. Only one representative sample for the site visit was assessed. To ensure no impairment was
overlooked both the highest and lowest pH sample were examined to select a representative sample, while
the lowest dissolved oxygen data was considered.
Water quality meters were deployed at 133 locations on 106 streams during the 2016-2020 term.
Parameters measured include pH, temperature, conductivity, and dissolved oxygen.
3.2 Lakes and Reservoirs
In 2006, WVDEP resumed a lake monitoring component that focuses on physicochemical water quality
parameters. WVDEP added the collection of aquatic macroinvertebrates to the lake monitoring program
in 2011.
The objectives of lake monitoring are to identify areas of impairment and to document recovery where
abatement plans have been implemented. Sites are selected to update existing data or to address sites with
little or no information. Lakes are sampled in accordance with the five-year hydrologic grouping
watershed cycle. Seven lakes from Group A, 7 lakes from Group B, 9 lakes from Group C, and 7 lakes
from Group D were sampled at one or more monitoring locations four times during the May - October
assessment seasons in 2016, 2017, 2018, and 2019, respectively. A full round of lake monitoring was not
conducted in 2020 due to COVID travel restrictions.
The number of sites per lake is proportional to the size and shape of the impoundment. One site is
established at the deepest part of the impoundment and additional sites may be added to evaluate different
arms of the lake or to provide longitudinal information. Each lake is sampled four times during the summer
months (June - September or May - August), coinciding with the primary growing season in WV. Critical
elements are vertical chemistry profiles for temperature, pH, dissolved oxygen, and conductivity (on-site
measurements); nutrients, fecal coliform bacteria, and chlorophyll-a sampling; and Secchi depth.
Many of West Virginia’s largest reservoirs are controlled by the U.S. Army Corps of Engineers. Although
the Corps’ primary mission is to manage structures to provide navigation and flood control, the agency is
also committed to water quality management. Data generated by the Corps has been used for assessment
purposes.
4Combined 2018/2020/2022 WV Integrated Water Quality Monitoring and Assessment Report
Additional lake information is available from the West Virginia Division of Natural Resources (DNR).
The DNR, one of the signatory agencies in the Partnership for Statewide Watershed Management,
conducts fish community surveys on many of the state’s reservoirs.
3.3 Wetlands
WVDEP contributes to the management of the State’s wetlands. Wetlands are areas where the land is
covered by shallow water, or the soil is saturated to the surface for at least two weeks during the growing
season. Wetlands are wet enough to affect the types of soils and plants that can occur, but they may also
be dry at certain times of the year. Some common names for different types of wetlands are swamp, marsh,
and bog. According to the National Wetlands Inventory for WV in 2021, the current total acreage of
wetlands within the state is approximately 111,000 acres and comprises less than one percent of the State’s
total acreage; yet wetlands are critical to the overall health of our state’s aquatic resources by reducing the
impacts of floods, providing baseflow to streams, reducing bank erosion, removing pollutants, processing
excess nutrients, capturing sediment, and providing habitat to a high diversity of plants and animals.
Management efforts are currently geared toward protection of wetlands by regulatory proceedings or
acquisition. Permitting authority for activities impacting wetlands lies with the U. S. Army Corps of
Engineers (Clean Water Act, Section 404). WVDEP supports protection through the Clean Water Act,
Section 401 certification program.
WVDEP’s Watershed Assessment Branch has developed functional and condition assessments for West
Virginia’s wetlands. The indices developed for the assessment are being used throughout the state to better
describe the functions that different wetlands can provide and their overall health or condition. The West
Virginia Wetland Rapid Assessment Method (WVWRAM) includes desktop GIS Wetland Assessment
Tool (level 1), and a rapid field assessment method (level 2). These two assessments enable calculation of
debits and credits for wetland impacts and mitigation sites, as well as help to prioritize sites for land
acquisition, restoration, and preservation. In 2022-2023, WVWRAM is expected to be incorporated into
the WV Stream and Wetland Valuation Metric (SWVM), which is used by the U.S. Army Corp of
Engineers (USACE) and the WV Inter-agency Review Team to assess impacts in West Virginia.
Statewide desktop GIS assessment of wetland function was completed in 2019 for all wetlands mapped in
the National Wetlands Inventory (43,124 wetland complexes). These are preliminary scores which must
be field-verified for any wetlands entering the regulatory process. GIS-based wetland function scores are
publicly available on the WVDEP GIS viewer at: https://tagis.dep.wv.gov/wvdep_gis_viewer/
Targeted monitoring has been a component of West Virginia’s wetland assessment strategy since
WVWRAM sampling began in 2017. Sites are selected to meet a variety of informational needs. The
following sites were sampled using WVWRAM (level 1 & 2) in 2017-2021:
45 reference wetlands (minimally impacted)
64 restored wetlands (pre-construction and/or post-construction data)
28 wetlands facing impacts (pre-impact data)
21 training sites
5Combined 2018/2020/2022 WV Integrated Water Quality Monitoring and Assessment Report
In 2020, the Watershed Assessment Branch began sampling wetland sites selected through the USEPA’s
random stratified (probabilistic) procedure. The data generated from this sampling effort allows the
WVDEP and the USEPA to make statistically valid assessments of wetland conditions on a statewide
basis as well as make comparisons between watersheds and ecoregions. The data also assists in monitoring
long-term trends in wetland health. WVDEP has completed 107 probabilistic WVWRAM assessments
during the first two years of its first 5-year-round of stratified random wetland monitoring.
3.4 Other Monitoring
When the need arises, WVDEP responds to specific conditions or pollutants of concern in any waterbody.
The Watershed Assessment Branch may partner with other agencies to collect data to better understand
threats to water quality standards and designated uses.
Harmful Algal Blooms
The focus of West Virginia’s Harmful Algal Bloom Response Plan is on public recreational waters,
although these principles and practices can apply to any body of water. A coordinated effort is crucial to
successfully respond to harmful algal blooms (HABs) in West Virginia. Agencies primarily responsible
for HAB response in West Virginia include West Virginia’s Bureau for Public Health, WVDEP, Division
of Natural Resources (DNR) and local health departments. The following are the responsibilities of
WVDEP in the development of this response plan:
• Conduct sampling when blooms are sighted
• Report potential HAB to West Virginia’s HAB mailbox at HAB@wv.gov
• Train others in sampling protocols
• Conduct aerial surveillance to monitor HABs
• Maintain database of all reported HAB data
• Maintain website, reporting app and interactive map of HAB advisories
• Provide outreach to the public about HABs
• Coordinate with the USACE on all USACE lakes
Sampling will be conducted on a case-by-case basis depending on water conditions as algae starts to
appear, especially during the peak recreational season. Samples should be collected and if it is determined
that the algal bloom is dominated by potentially toxigenic genera of cyanobacteria, the algal bloom will
be classified as a HAB and cyanotoxin analysis would be conducted. Initial testing is conducted in house
via an mBio/LightDeck analysis unit to quantitatively determine concentrations of Microcystin and
Cylindrospermopsin. If the toxins are detected at levels of concern, or if the algae present are capable of
producing additional toxins beyond microcystin and cylindrospermopsin, the sample would be submitted
to a lab for quantitative testing. The HAB location should be monitored closely and if cyanotoxin
concentrations are above the Public Health Watch Advisory threshold, the area would be sampled at least
weekly. Sampling should continue until two consecutive results collected one week apart indicate that
6Combined 2018/2020/2022 WV Integrated Water Quality Monitoring and Assessment Report
cyanotoxin concentrations are below the watch advisory threshold. However, monitoring may continue
based on environmental conditions and relative health risk.
In the summer of 2019, the WVDEP Watershed Assessment Branch implemented a Harmful Algal Bloom
Long-Term Trend Sampling program. In total, 15 sites were selected with an approximate statewide
distribution, focusing on larger waterbodies including rivers, large streams, and impoundments (lakes). In
2021, three additional sites were established, and additional sites may be established as needed in the
future. Sites were selected either due to a history of harmful algal blooms, a history of elevated nutrient
concentrations, or neither HAB history nor history of elevated nutrients. These locations will be sampled
multiple times per year, for several years to attempt to determine trends in the occurrence of HABs in
West Virginia. Sampling efforts consist of a visual survey for algae (including benthic/bottom substrate,
water column, and water surface), collection and identification of algae present with emphasis on
cyanobacteria, algal toxin testing via semi-quantitative methods (Abraxis field test strips) for microcystin
and cylindrospermopsin, and water column nutrient concentration analysis. Nutrient samples were
collected in accordance with Watershed Assessment Branch SOP methods.
Filamentous Algae
Filamentous algae are connected algae cells that grow and form long threads or filaments. When growth
is excessive, large mats can form that stretch from the river bottom to the surface and cover significant
portions of a river reach. The term “Filamentous Algae” refers to any number of species that can be found
in rivers and streams. There are numerous species of algae that are native to West Virginia and that can
be found at any one location. WVDEP is monitoring numerous rivers in the state for filamentous algae
blooms, including the Greenbrier River, Tygart River, South Branch Potomac River and the Cacapon
River. Monitoring generally occurs in late summer to early fall when flows lower and temperatures begin
to rise in the rivers.
Fish tissue
In recent years, fish tissue analysis has been conducted annually, collecting fish from targeted sites on a
5-year rotation. Monitoring from 2016-2020 resulted in the analysis of 407 samples for PCBs and mercury,
and 174 for selenium. These samples were collected from 27 HUC-8 watersheds representing 55 different
waterbodies, including 11 lakes. All five Hydrologic Groups (A-E) were represented. In 2016 and 2017,
WVDEP conducted a rigorous fish tissue evaluation of the Kanawha and Monongahela rivers with
samples analyzed for mercury and PCBs, as well as dioxin at most Kanawha River sites.
4.0 THIRD PARTY MONITORING AND DATA
In addition to data collected by the WAB, the agency considered data from external sources for
assessment. The agency sought water quality information from various state and federal agencies,
including other DEP programs. Specific requests for data were made to state and federal agencies known
by WVDEP to generate water quality information. Additionally, news releases and public notices
7You can also read