Electrification Futures Study: Methodological Approaches for Assessing Long-Term Power System Impacts of End-Use Electrification - NREL
←
→
Page content transcription
If your browser does not render page correctly, please read the page content below

Electrification Futures Study:
Methodological Approaches for Assessing Long-Term
Power System Impacts of End-Use Electrification

Yinong Sun,1 Paige Jadun,1 Brent Nelson,2 Matteo
Muratori,1 Caitlin Murphy,1 Jeffrey Logan,1 and Trieu Mai 1
1
 National Renewable Energy Laboratory
2
 Northern Arizona University

Electrification Futures Study:
Methodological Approaches for Assessing
Long-Term Power System Impacts of End-
Use Electrification
Yinong Sun,1 Paige Jadun,1 Brent Nelson,2 Matteo Muratori,1
Caitlin Murphy,1 Jeffrey Logan,1 and Trieu Mai1
1
 National Renewable Energy Laboratory
2
 Northern Arizona University

Suggested Citation
Sun, Yinong, Paige Jadun, Brent Nelson, Matteo Muratori, Caitlin Murphy, Jeffrey Logan, and
Trieu Mai. 2020. Electrification Futures Study: Methodological Approaches for Assessing Long-Term
Power System Impacts of End-Use Electrification. Golden, CO: National Renewable Energy
Laboratory. NREL/TP-6A20-73336. https://www.nrel.gov/docs/fy20osti/73336.pdf.

NOTICE

This work was authored in part by the National Renewable Energy Laboratory, operated by Alliance for
Sustainable Energy, LLC, for the U.S. Department of Energy (DOE) under Contract No. DE-AC36-
08GO28308. Funding provided by U.S. Department of Energy Office of Energy Efficiency and Renewable
Energy Office of Strategic Programs. The views expressed in the article do not necessarily represent the
views of the DOE or the U.S. Government.

 This report is available at no cost from the National
 Renewable Energy Laboratory (NREL) at
 www.nrel.gov/publications.

 U.S. Department of Energy (DOE) reports produced
 after 1991 and a growing number of pre-1991
 documents are available
 free via www.OSTI.gov.

Cover image from iStock 452033401.

NREL prints on paper that contains recycled content.

Errata
This report, originally published in July 2020, has been revised in January 2021 to update the
peak demand values listed in Table 3. The original table incorrectly listed peak demand for
scenarios with an assumed level of demand-side flexibility.
Preface
This report is one in a series of Electrification Futures Study (EFS) publications. The EFS is a
multiyear research project to explore potential widespread electrification in the future energy
system of the United States. Electrification is defined as the substitution of electricity for direct
combustion of non-electricity-based fuels used to provide similar services.

The EFS is specifically designed to examine electric technology advancement and adoption for
end uses in the major economic sectors of the United States, electricity consumption growth and
load profiles, future power system infrastructure development and operations, and economic and
environmental implications of electrification. Because of the expansive scope and the multiyear
duration of the study, research findings and supporting data will be published as a series of
reports, with each report being released on its own time frame. The table below lists the reports
published to date from the series.

 Published reports to date from the Electrification Futures Study series
 1. Jadun, Paige, Colin McMillan, Daniel Steinberg, Matteo Muratori, Laura Vimmerstedt, and Trieu
 Mai. 2017. Electrification Futures Study: End-Use Technology Cost and Performance Projections
 through 2050. NREL/TP-6A20-70485.
 2. Mai, Trieu, Paige Jadun, Jeffrey Logan, Colin McMillan, Matteo Muratori, Daniel Steinberg, Laura
 Vimmerstedt, Ryan Jones, Benjamin Haley, and Brent Nelson. 2018. Electrification Futures Study:
 Scenarios of Electric Technology Adoption and Power Consumption for the United States.
 NREL/TP-6A20-71500.
 3. Hale, Elaine, Henry Horsey, Brandon Johnson, Matteo Muratori, Eric Wilson, Brennan Borlaug,
 Craig Christensen, Amanda Farthing, Dylan Hettinger, Andrew Parker, Joseph Robertson, Michael
 Rossol, Gord Stephen, Eric Wood, and Baskar Vairamohan. 2018. The Demand-Side Grid
 (dsgrid) Model Documentation. NREL/TP-6A20-71491.
 4. Sun, Yinong, Paige Jadun, Brent Nelson, Matteo Muratori, Caitlin Murphy, Jeffrey Logan, and Trieu
 Mai. 2020. Electrification Futures Study: Methodological Approaches for Assessing Long-term
 Power System Impacts of End-Use Electrification. NREL/TP-6A20-73336. [this report]

This report is the fourth publication in the EFS series, and it provides detailed descriptions of
major methodological modifications to the power system model that can be used in future EFS
studies, in order to better reflect key impacts of electrification. The levels of electrification
underlying the changes needed to power sector modeling are derived from the second report
(Mai et al. 2018), coupled with various assumptions about prominent drivers that influence the
future generation mix on the bulk power system.

Follow on studies can leverage these new capabilities to explore the potential impacts of
electrification on power sector evolution. As a result, this report is limited only to
methodological development and implementation in modeling and does not explore
electrification impacts more broadly. The methodological approaches presented in this report can
be used to assist researchers performing their own electrification analyses and to document the
modeling upgrades.

More information, the supporting data associated with this report, links to other reports in
the EFS, and information about the broader study are available at www.nrel.gov/efs.

 iii
This report is available at no cost from the National Renewable Energy Laboratory at www.nrel.gov/publications.
Acknowledgments
The Electrification Futures Study (EFS) is led by researchers at the National Renewable
Energy Laboratory (NREL) but relies on significant contributions from a large collaboration
of researchers from the U.S. Department of Energy (DOE), Evolved Energy Research, Electric
Power Research Institute, Lawrence Berkeley National Laboratory, Northern Arizona University,
and Oak Ridge National Laboratory. We would like to thank all contributors for useful analysis,
data, and input throughout the project.

A technical review committee of senior-level experts provided invaluable input to the overall
study, with some committee members sharing thoughtful comments to this specific report as
noted on the following page. Although the committee members offered input throughout the
study, the results and findings from this analysis and the broader EFS do not necessarily reflect
their opinions or the opinions of their institutions. The technical review committee is comprised
of the following individuals:

 Doug Arent (committee chair) Jonathan Hughes
 National Renewable Energy Laboratory University of Colorado Boulder
 Sam Baldwin Michael Kintner-Meyer
 U.S. Department of Energy Pacific Northwest National Laboratory
 Steve Brick John Larsen
 Clean Air Task Force Rhodium Group
 Steve Clemmer Bryan Mignone
 Union of Concerned Scientists ExxonMobil Research and Engineering Company
 Laura Cozzi Granger Morgan
 International Energy Agency Carnegie Mellon University
 Francisco de la Chesnaye Patrick Riley
 Electric Power Research Institute GE Global Research
 Keith Dennis Joan Ogden
 National Rural Electric Cooperative Association University of California Davis
 Carla Frisch Laurie ten Hope
 Rocky Mountain Institute California Energy Commission
 Arnulf Grübler Susan F. Tierney
 International Institute for Applied Systems Analysis Analysis Group, Inc.
 Howard Gruenspecht
 Massachusetts Institute of Technology

 iv
This report is available at no cost from the National Renewable Energy Laboratory at www.nrel.gov/publications.
This analysis benefited greatly from thoughtful comments and suggestions from several
colleagues who generously reviewed either the entire report or portions of it in draft form,
including:

 • Amanda Myers (Energy Innovation)
 • Wesley Cole, Stuart Cohen, Elaine Hale, and Jack Mayernik (NREL)
 • Youngsun Baek and Sandra Sattler (Union of Concerned Scientists)
 • Monica Neukomm, Sam Baldwin, and Jonah Steinbuck (U.S. Department of Energy)
 • Jim McFarland (U.S. Environmental Protection Agency)
Special thanks go to Ryan Jones (Evolved Energy Research) for all the data support from and
explanations on the EnergyPATHWAYS model. We also thank the following NREL staff: Mike
Meshek and Devonie McCamey for editing and support. Of course, any errors and omissions are
the sole responsibility of the authors.

Primary funding support for the EFS is provided by the DOE Office of Energy Efficiency and
Renewable Energy Office of Strategic Programs. We especially thank Paul Donohoo-Vallett
(DOE) and Steve Capanna (formerly DOE) for their support and leadership throughout the
EFS and for this report.

 v
This report is available at no cost from the National Renewable Energy Laboratory at www.nrel.gov/publications.
List of Acronyms
AEO Annual Energy Outlook
BA balancing area
CBECS Commercial Buildings Energy Consumption Survey
DOE U.S. Department of Energy
EFS Electrification Futures Study
EIA U.S. Energy Information Administration
ENC East North Central
HOGR high oil and gas resource
HVAC heating, ventilation, and air conditioning
LNG liquefied natural gas
LOGR low oil and gas resource
MTN Mountain census division
NEMS National Energy Modeling System
NG-CC natural gas-combined cycle
NG-CT natural gas combustion turbine
NREL National Renewable Energy Laboratory
ORNL Oak Ridge National Laboratory
PRM planning reserve margin
ReEDS Regional Energy Deployment System model
SCE Southern California Edison
SIC Standard Industrial Classification
VRE variable renewable energy
W watt

 vi
This report is available at no cost from the National Renewable Energy Laboratory at www.nrel.gov/publications.
Abstract
The Electrification Futures Study (EFS) was designed to analyze the potential impacts of
electrification, accounting for the complex dynamics between different segments of the U.S.
energy system. The EFS uses several complementary modeling and analysis tools, and it relies
on an overarching scenario analysis approach. Previous EFS reports defined a range of future
cost and performance trajectories for electric end-use technologies (Jadun et al. 2017), which
informed a variety of electrification scenarios (Mai et al. 2018). These “demand-side” scenarios
are defined by different electric end-use technology adoption rates and, in turn, different levels
and patterns of electricity demand. Comparison across these scenarios reveals alterations in the
temporal and spatial patterns of electricity consumption, such that the magnitude and timing of
peak demand are impacted in meaningful ways. Moreover, electrification expands opportunities
for demand-side flexibility, which would further change the shape of electricity demand. In
addition, increasing electrification also drives a reduction in end-use natural gas consumption
which, in turn, influences the price of natural gas.

Assessing how these alterations in demand sectors would influence the corresponding buildout
of the power system under widespread electrification requires their explicit representation in
long-term planning models. The purpose of the present report is to document and demonstrate
model development efforts we engaged in to improve our ability to represent interactions
between electricity supply and demand under widespread electrification. These improvements
were designed for and implemented in the National Renewable Energy Laboratory’s Regional
Energy Deployment System (ReEDS) model, which is a capacity expansion model that simulates
the evolution of the U.S. electricity system through 2050.

This report summarizes three primary improvements that were implemented in ReEDS. First,
we improved the representation of load shapes and peak demand to better capture how regional
interactions—such as resource sharing between regions—could be impacted under widespread
electrification. Second, we represented how changes in direct end-use natural gas consumption
could impact the economics of natural gas-fired generation, through price elasticity effects.
Third, we implemented a new model representation of flexible load that is dispatched
endogenously within the model.

These improvements to ReEDS are intended to be employed in follow on work that will fully
explore the impact of electrification on the power sector evolution. However, the data and
methods documented in this report could also be adapted for other models with similar scopes
and limitations, to improve their ability to assess future electric system scenarios under varying
levels of electrification.

 vii
This report is available at no cost from the National Renewable Energy Laboratory at www.nrel.gov/publications.
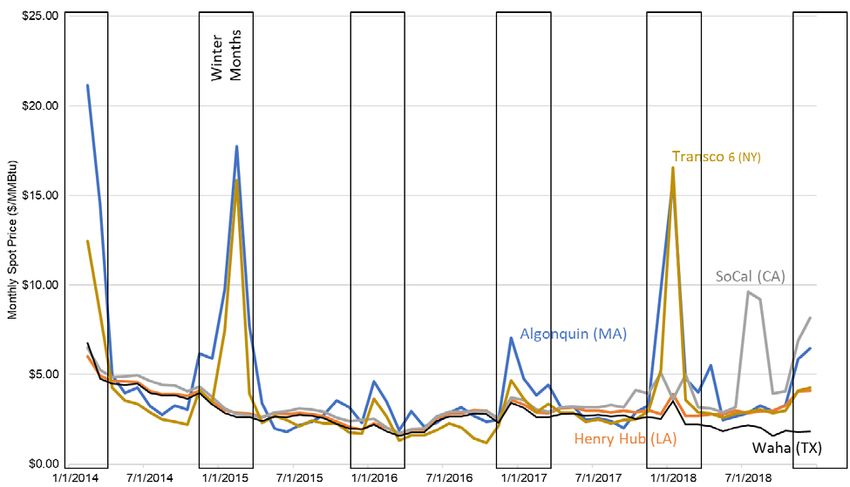
Table of Contents
1 Introduction ........................................................................................................................................... 1
 1.1 Overview of the Electrification Futures Study .............................................................................. 1
 1.2 Overview of the Model Structure .................................................................................................. 2
2 Regional Interactions ........................................................................................................................... 6
 2.1 Power System Regional Interactions............................................................................................. 6
 2.1.1 Review of Resource Sharing and Regional Interactions .................................................. 6
 2.1.2 Changing Regional Interaction Dynamics with Electrification........................................ 7
 2.2 Implementation in ReEDS ............................................................................................................ 9
 2.3 Scenario Results .......................................................................................................................... 11
 2.4 Limitations of Modeling Regional Interactions .......................................................................... 14
3 Natural Gas Price and Consumption Dynamics .............................................................................. 16
 3.1 Natural Gas Economics ............................................................................................................... 16
 3.2 Implementation in ReEDS .......................................................................................................... 19
 3.3 Scenario Results .......................................................................................................................... 23
 3.4 Limitations of Modeling Natural Gas Economics ....................................................................... 25
4 Demand-Side Flexibility ..................................................................................................................... 27
 4.1 Flexibility Potential ..................................................................................................................... 27
 4.1.1 Literature Review of Existing Demand Response Programs ......................................... 27
 4.1.2 Characterization of Demand-Side Flexibility................................................................. 29
 4.2 Implementation in ReEDS .......................................................................................................... 34
 4.3 Scenario Results .......................................................................................................................... 41
 4.4 Limitations of Modeling Demand-side Flexibility ...................................................................... 45
5 Conclusions ........................................................................................................................................ 48
References ................................................................................................................................................. 50
Appendix A. Methodology for Translating EnergyPATHWAYS Outputs to ReEDS ........................... 59
Appendix B. Natural Gas Supply Curves................................................................................................ 61
Appendix C. Seasonal Natural Gas Price Adjustments ........................................................................ 64
Appendix D. Demand-Side Flexibility Assumptions ............................................................................. 66

 viii
This report is available at no cost from the National Renewable Energy Laboratory at www.nrel.gov/publications.
List of Figures
Figure 1. Schematic of the ReEDS model structure ..................................................................................... 3
Figure 2. ReEDS spatial structure ................................................................................................................. 4
Figure 3. Peak load magnitude and seasonal timing by state for 2018 and 2050 for three electrification
 scenarios ................................................................................................................................... 8
Figure 4. Correlation coefficients in 2050 hourly load profiles for model BAs under (left) Reference and
 (right) High electrification scenarios ....................................................................................... 9
Figure 5. Planning reserve provision difference of seasonal PRM minus annual PRM in summer (left)
 and winter (right) under Reference (top) and High (bottom) electrification .......................... 12
Figure 6. Difference in 2050 time-slice generation with and without winter peaking time-slice under
 Reference (top) and High (bottom) electrification ................................................................. 13
Figure 7. Increase in long-distance transmission capacity from 2018 levels under Reference (left) and
 High (right) electrification ..................................................................................................... 14
Figure 8. U.S. dry natural gas production and consumption (left axis) and average delivered price for
 electricity sector consumers (right axis) ................................................................................ 17
Figure 9. Temporal and spatial variations in select natural gas prices........................................................ 19
Figure 10. National and regional natural gas inverse elasticity parameters under the Energy Sector-
 Wide Elasticity representation and Electric-Only Elasticity representation .......................... 21
Figure 11. Effective alpha values for AEO Low Oil & Gas Resource, AEO Reference, and AEO High
 Oil & Gas Resource scenarios (from left to right), with shaded areas showing the range
 of different regional values across years ................................................................................ 22
Figure 12. Natural gas delivered price to electric sector (top left), electric-sector natural gas consumption
 (top right), NG-CC generation (bottom left), and NG-CC capacity (bottom right) in Base
 Case scenarios, with Energy Sector-Wide Elasticity representation (in blue) and Electric-
 Only Elasticity representation (in gold) ................................................................................. 24
Figure 13. Difference in installed capacity when using the Energy Sector-Wide Elasticity method,
 as opposed to the Electric-only Elasticity method ................................................................. 25
Figure 14. Flow chart of assumptions used to determine final flexible load used in modeling .................. 30
Figure 15. Representative input hourly load profile from EnergyPATHWAYS (left), input time-slice
 and optimized time-slice profile in ReEDS (right) ................................................................ 35
Figure 16. Total flexible load (left) and flexible load share of total load (right) ........................................ 38
Figure 17. Flexible load by top subsectors for Reference electrification and Base flexibility in 2050 as
 a percentage of the total subsector load (left) and total flexible load across all subsectors
 (right) ..................................................................................................................................... 39
Figure 18. Flexible load by top subsectors for High electrification and Base flexibility in 2050 as a
 percentage of the total subsector load (left) and total flexible load across all subsectors
 (right) ..................................................................................................................................... 40
Figure 19. Flexible load by duration for Reference (left) and High electrification (right) with Base
 flexibility in 2050 ................................................................................................................... 41
Figure 20. Difference in 2050 capacity (left) and generation (right) of Enhanced flexibility from Base
 flexibility for Reference and High electrification .................................................................. 42
Figure 21. Difference in 2050 time-slice generation (Enhanced flexibility less Current flexibility) for
 High electrification for select census divisions ...................................................................... 44
Figure A-1. Flow chart of assumptions used to determine load profiles used in modeling ........................ 60
Figure B-1. The nine census divisions defined by EIA .............................................................................. 61
Figure B-2. Beta values for census divisions .............................................................................................. 62
Figure C-1. Natural gas futures prices from the New York Mercantile Exchange for July 10, 2014 ......... 64
Figure C-2. Year-round natural gas futures prices from Figure C-1 separated by season .......................... 64

 ix
This report is available at no cost from the National Renewable Energy Laboratory at www.nrel.gov/publications.
Figure D-1. Flexible load by subsector for Reference electrification and Base flexibility in 2050 as a
 percentage of the total subsector load (left) and total flexible load across all subsectors
 (right) ..................................................................................................................................... 71
Figure D-2. Flexible load by subsector for Reference electrification and Enhanced flexibility in 2050 as a
 percentage of the total subsector load (left) and total flexible load across all subsectors
 (right) ..................................................................................................................................... 72
Figure D-3. Flexible load by subsector for High electrification and Base flexibility in 2050 as a
 percentage of the total subsector load (left) and total flexible load across all subsectors
 (right) ..................................................................................................................................... 73
Figure D-4. Flexible load by subsector for High electrification and Enhanced flexibility in 2050 as a
 percentage of the total subsector load (left) and total flexible load across all subsectors
 (right) ..................................................................................................................................... 74

List of Tables
Table 1. Demand-Side Flexibility Assumptions by End-Use Subsector .................................................... 32
Table 2. Assumed Flexible Load Customer Participation Rates for Current, Base, and Enhanced
 Flexibility Scenarios .............................................................................................................. 33
Table 3. Annual Load and the Peak Load for Electrification and Technology Advancement Scenarios ... 37
Table 4. Percentage of Sectoral and Total Load Assumed Flexible in 2050 By Flexibility Scenario ........ 38
Table 5. Percentage of Summer and Winter Super-peak Load Assumed Flexible in 2050 by Flexibility
 Scenario.................................................................................................................................. 39
Table D-1. Amount and Percentage of Flexible Load in 2050, by Sector and for Total Load ................... 66
Table D-2. Summary of Demand-Side Flexibility Assumptions for Residential End Uses ....................... 67
Table D-3. Summary of Demand-Side Flexibility Assumptions for Commercial End Uses...................... 68
Table D-4. Summary of Demand-Side Flexibility Assumptions for Industrial End Uses .......................... 69
Table D-5. Summary of Demand-Side Flexibility Assumptions for Transportation End Uses .................. 70

 x
This report is available at no cost from the National Renewable Energy Laboratory at www.nrel.gov/publications.
1 Introduction
Electrification is the shift from any non-electric source of energy to electricity at the
point of final consumption, and it is an emerging trend in energy markets around the world.
Depending on the magnitude and extent of electrification, such a transition could have important
implications for the future evolution of the power system. Alterations in the temporal and spatial
patterns of electricity consumption as well as the overall magnitude of demand growth represent
the primary impacts of electrification on bulk power system needs and economics. Such an
impact could affect regional interactions by changing power transfers, influencing transmission
expansion decisions, and potentially raising opportunities for capacity resource sharing between
regions. Another potential impact of electrification is the reduction in end-use natural gas
consumption, which could improve the economics of natural gas-fired power generation. Finally,
demand-side flexibility could impact power system evolution and these impacts could vary with
different level of electrification.

Given the interconnected nature of the U.S. energy sector, these direct effects of electrification
in demand sectors would also influence the future evolution of the power system. Therefore,
simulating electrification scenarios in power system models requires an explicit representation
of how changes in the demand sectors would translate to different input assumptions for the
power sector. The purpose of this report is to document model improvements that were designed
and executed in the National Renewable Energy Laboratory’s (NREL’s) Regional Energy
Deployment System (ReEDS) model in order to facilitate power sector analysis of electrification
scenarios as part of the broader Electrification Futures Study (EFS). This section presents
overviews of both the EFS and ReEDS, to provide context for the model development efforts
that are detailed in Sections 2–4 of this report.

1.1 Overview of the Electrification Futures Study
The EFS is a multiyear research effort to explore the implications of increasing electrification
on the U.S. energy system. 1 The study relies on a scenario analysis approach. The current report
builds on prior EFS reports by beginning to extend the scenario analysis to the “supply-side” of
the electricity system.

The primary purpose of this report is to present the methodological approaches applied to
National Renewable Energy Laboratory’s (NREL’s) Regional Energy Deployment System
(ReEDS) capacity expansion model in order to improve its ability to reflect electrification-related
impacts on power system planning. 2 Given the methodological focus of this report, it should be
viewed as a complement to the main ReEDS model documentation presented by Cohen et al.
(2019). Section 1.2 provides an overview of the ReEDS model with particular emphasis on
aspects of the 2018 final release version of the model prior to changes described in the latter
sections of this report. Although this report focuses on modifications to the ReEDS model, the
methods represented may also apply to other long-term power system planning models.

1
 For more information, see “Electrification Futures Study,” NREL, https://www.nrel.gov/analysis/electrification-
futures.html.
2
 See “Regional Energy Deployment System Model,” NREL, https://www.nrel.gov/analysis/reeds/.

 1
This report is available at no cost from the National Renewable Energy Laboratory at www.nrel.gov/publications.
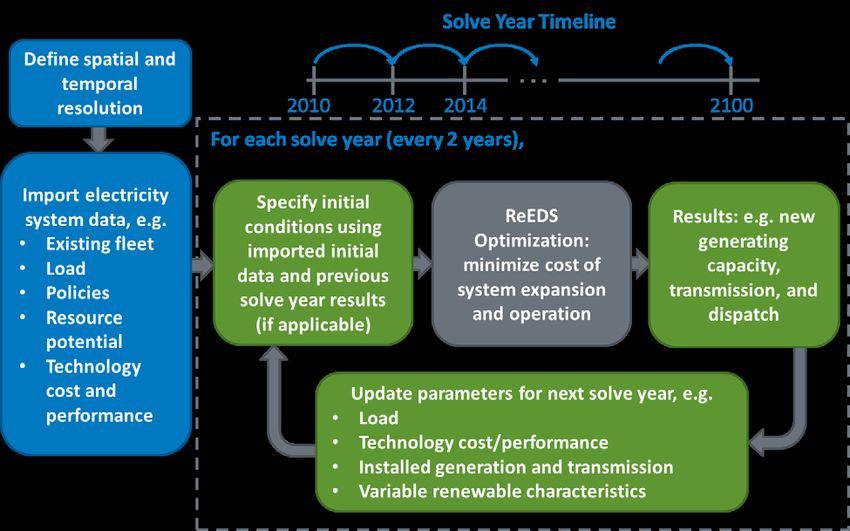
Note that this report focuses narrowly on the modeling methodological development and as such
does not examine the impact of electrification on the power sector more broadly. Demand side
electrification scenarios used here to test the methods are derived from Mai et al. (2018). Future
supply-side electrification scenario analysis will rely on the model methods presented in the
current report. Planned work will more comprehensively address major trends for the future U.S.
electricity system and how these trends might impact—or might be impacted by—increased
electrification; such impacts may include future capacity and generation mixes, associated
infrastructure development, electric and energy system expenditures, fossil fuel and energy use,
and air emissions.

1.2 Overview of the Model Structure
The ReEDS model (Cohen et al. 2019; Cole et al. 2018) serves as the analytic backbone of the
EFS supply-side analysis. 3 ReEDS is a capacity planning and dispatch model that uses system-
wide least-cost optimization to develop long-term electricity supply scenarios. The version of
ReEDS used for our analysis models the power system in the contiguous United States through
2050. 4 Because ReEDS models the U.S. electricity system only, it relies on exogenously
specified inputs for certain parameters that are affected by global dynamics and factors outside
the bulk power system. Most notably, to inform its capacity expansion and dispatch decisions,
ReEDS relies on exogenous assumptions for electricity demand and natural gas resource and
pricing 5—two factors that are influenced by the extent of end-use demand electrification.
Because of these interactions and the model’s scope, methodological developments were needed
to improve ReEDS’ ability to assess the impacts of electrification on power demand and natural
gas power generation economics.

ReEDS is a sequential optimization model where the least-cost solution is found during every
two-year solve period through 2050 (Figure 1). In each solve period, ReEDS finds the lowest-
cost portfolio of generation, transmission, and storage options that meet numerous constraints,
including grid requirements (e.g., electricity supply-demand balance, and reserves), policy
requirements (e.g., state renewable portfolio standards), and resource constraints (e.g.,
geothermal resources, hydropower sites, and suitable land areas for wind and solar
development). Investment in new capacity and the utilization of all (existing and new) capacity
are endogenously co-optimized in the model based on the present value of electric system
expenditures over a financial evaluation period (e.g., 20 years). Between each solve period,
parameters are updated based on exogenous assumptions and decisions from the previous
optimization; such parameters include technology cost and performance, fuel prices, demand
growth, grid requirements, policy changes, and calculations and parameters associated with

3
 Consistent with Cole et al. (2018), we use the 2018 final release version of ReEDS as the starting-point version
of the model. This report describes the deviations to this version for the EFS. In addition to ReEDS, the Distributed
Generation (dGen) model (Sigrin et al. 2016) is used to generate the rooftop PV adoption levels assumed in our
scenarios. No other distributed generation technologies are represented.
4
 This version includes simplified representation of net imports from Canada and Mexico. Other versions of ReEDS
include explicit representation of the full North American power system and can be used to develop scenarios
through 2100.
5
 As we describe below and in Section 3, ReEDS represents supply curves for natural gas that reflect the elasticity
of prices and demand rather than fixed prices.

 2
This report is available at no cost from the National Renewable Energy Laboratory at www.nrel.gov/publications.
integration of variable renewable energy (VRE) technologies (namely capacity credit and
curtailment of VREs). 6

 Figure 1. Schematic of the ReEDS model structure
 Although the ReEDS model allows for simulations of the power system through 2100,
 the present analysis only explores power system evolution through 2050.

 Source: Cohen et al. 2019

Uniquely, ReEDS has higher spatial resolution than other leading national-scale capacity
expansion models (Cole et al. 2017). Figure 2 shows a map of the model’s spatial structure,
which includes 134 model balancing areas (BAs) 7 and 356 renewable resource regions. The
primary network structure in ReEDS is comprised of the BAs and the transmission lines
connecting them. The model transmission lines shown in Figure 2 reflect the existing
transmission interface capacities between BAs. Balancing areas are also where the aggregate
capacity for each technology category is modeled. Renewable regions specify the amount and
quality of developable wind and concentrating solar power resource. Other regional layers are
used to specify other local constraints and requirements that impact the system-wide optimal
solution. These larger regions are comprised of a collection of BAs to represent states and model
regional transmission organization boundaries. For example, renewable portfolio standards and
other state policies are modeled for states that possess such policies, and operating reserve

6
 Unless otherwise specified, the scenarios modeled include current policies as of spring 2018 only, including any
legislated changes to the policy (e.g., expiration of federal renewable energy tax credits).
7
 Model BAs do not align with actual balancing authority area boundaries.

 3
This report is available at no cost from the National Renewable Energy Laboratory at www.nrel.gov/publications.
constraints are assumed for each of 18 model regional transmission organizations. 8 Overall, the
highly disaggregated spatial structure in ReEDS allows us to assess the degree of trading—of
multiple grid services including energy, capacity, and reserves—between regions.

 Figure 2. ReEDS spatial structure
ReEDS’ investment and dispatch decisions are also affected by the temporal structure of the
model. The 2018 final release of ReEDS relies on 17 time-slices to reflect seasonal and diurnal
variations in load and VRE production in the reduced-form dispatch decisions and power
generation economics considered by the model. 9 For the EFS, we add a time-slice to better
capture generation decisions during peak winter load hours. Furthermore, ReEDS has
traditionally included an annual planning reserve constraint designed to enforce resource
adequacy requirements for the system, which, for most regions, ensures sufficient installed
capacity to meet summer peak demand hours. As electrification could change the timing of peak
demand, we alter the model to consider seasonal planning reserve requirements, which improves
ReEDS’ ability to model the potential for sharing planning reserve provision resources between
regions. Section 2 provides details about these model improvements.

8
 Regional transmission organizations in the model closely overlap the actual footprints of regional transmission
organizations and independent system operators where they exist, and they represent fictitious reserve-sharing
groups for regions without restructured markets (see Cohen et al. 2019).
9
 As described in the ReEDS documentation (Cohen et al. 2019), the model includes additional calculations and
parameters to capture intra-time-slice variations in load and VRE production.

 4
This report is available at no cost from the National Renewable Energy Laboratory at www.nrel.gov/publications.
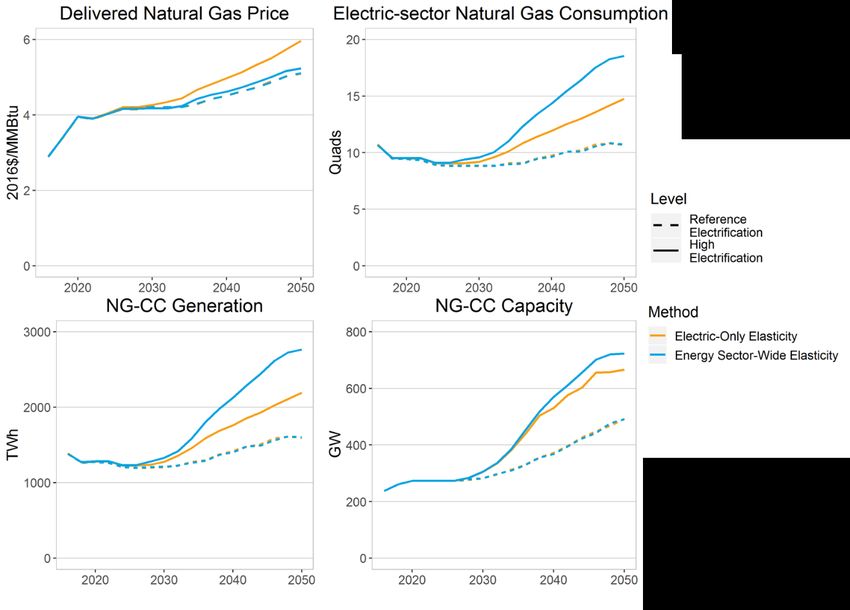
Fuel prices and demand growth are two parameters that are heavily impacted by electrification.
ReEDS relies on exogenous and fixed-price trajectories for coal and uranium but represents
natural gas pricing using supply curves (Cole, Medlock, and Jani 2016). 10 The slope of the
supply curves reflect the inverse price elasticity of demand (e.g., how an increase in electric
sector consumption of gas would increase delivered prices for natural gas-fired generation), but
in the 2018 final release version of ReEDS, they implicitly assume the same amount of gas is
consumed outside the power sector across scenarios. 11 Seasonal patterns in natural gas prices
are also reflected in ReEDS. Section 3 presents updates that were made to the representation of
natural gas economics to better capture impacts of regional changes in non-electric natural gas
consumption.

For demand growth, the 2018 final release version of ReEDS applies an annual load growth
factor to each census division based on the U.S. Energy Information Administration’s (EIA’s)
Annual Energy Outlook (AEO) 2018 reference case (Cole et al. 2018; EIA 2018a). This
implementation assumes the intra-annual load shapes 12 remain constant over time, and it
assumes annual demand in all states within a census division grow at the same rate. In this
analysis, to better reflect potential changes in electricity consumption patterns driven in part by
electrification trends envisioned in the EFS, we incorporate into ReEDS state-specific annual
and hourly consumption from the demand-side scenarios reported in Mai et al. (2018) (see
Appendix A) 13. Demand-side participation can also impact electric system operation, and
the impacts would become more significant with increasing electrification. To capture the
potentially extensive interaction of demand-side participation and electrification, we include a
new representation of demand-side flexibility based on the incorporated consumption profiles
in ReEDS. Section 4 documents the data assumptions and modeling methodology used to
represent different levels of flexible load with electrification.

In the EFS, we use the ReEDS model—including model developments presented in this report—
to simulate a variety of scenarios of the contiguous U.S. electricity system through 2050. In this
report, we only present select scenario results that highlight the effects of our methodological
developments in ReEDS (documented here), without emphasis on the potential impacts of
electrification on the bulk power system. Unless otherwise noted, the scenarios presented here
use Base Case assumptions that are largely consistent with the Mid-Case of the 2018 Standard
Scenarios Report (Cole et al. 2018).

10
 Biomass feedstock supply curves are also used. The same biomass supply curves are used in all scenarios.
11
 This representation considers changes in non-power gas consumption over time as modeled in the AEO scenarios.
12
 The 2018 final release version of ReEDS relies on consumption patterns from 2012 for all years.
13
 The BA level consumption in ReEDS is adjusted using the corresponding state-specific consumption patterns.

 5
This report is available at no cost from the National Renewable Energy Laboratory at www.nrel.gov/publications.
2 Regional Interactions
The U.S. electricity system can be subdivided into several geographical levels representing
differences between regions (Denholm, Sun, Mai 2019). These regional differences and the
interconnection—both physical and institutional—between regions require power system models
to account for interactions between regions. For example, regional coordination often refers to
cooperation between BAs or other regional entities to perform consolidated operation of their
joint assets through reserve sharing and coordinated scheduling (Greening the Grid 2015), and
the model needs to reflect such practices. For the purpose of this report, and given the long-term
modeling framework used, we describe how the model represents coordination and interactions
in investment and utilization decisions relevant to all grid services, including energy as well
as planning and operating reserves. Electrification can impact bulk power system needs and
economics through alterations to the temporal and spatial patterns of electricity consumption, as
well as the overall magnitude of demand growth. Such impacts could affect regional interactions
by changing power transfers, influencing transmission expansion decisions, and potentially
raising opportunities for capacity resource sharing between regions.

In this section, we briefly discuss regional interactions in electricity systems and how they could
be impacted by electrification. We also present the model updates in ReEDS that are intended to
improve the temporal representation of both energy and capacity resource sharing, especially
with respect to peak demand. Scenario results are included to show the individual and combined
impacts of these two updates on overall model results. Finally, we conclude the section with a
discussion of limitations in our modeling methods.

2.1 Power System Regional Interactions
2.1.1 Review of Resource Sharing and Regional Interactions
Resource sharing and interregional coordination can yield economic benefits in planning and
reliable operations of power systems. The value of sharing resources across larger geographic
boundaries mainly comes from the geospatial diversity of both electricity demand and supply.
This combination is also known as net-load diversity (Figueroa-Acevedo 2017). Electrical load
varies across locations due to weather, time zone, behavior, and technological differences in
consumption (e.g., use of electric heating systems). Supply also varies geographically, due to
generation characteristics and system constraints, especially if VRE is largely deployed. These
differences lead to opportunities to use a shared pool of resources to balance the system-level
supply and demand or meet reserves rather than rely on only local resources.

These regional interactions, including resource sharing and interregional coordination, occur
during both planning and operations of power systems. During power system planning processes,
interregional coordination can help system planners make generation and transmission capacity
expansion decisions with lower overall infrastructure and operating costs while achieving the
same or even greater levels of reliability. Moreover, trading planning reserve provision resources
between regions helps different regions meet their resource adequacy requirements (i.e., planning
reserve margin [PRM] requirement) in a more economical way. During power system operations,
energy resource sharing allows different regions to the meet supply-demand balance and
essential reliability services (e.g., operating reserves) requirements, with resources that are less
expensive than local ones.

 6
This report is available at no cost from the National Renewable Energy Laboratory at www.nrel.gov/publications.
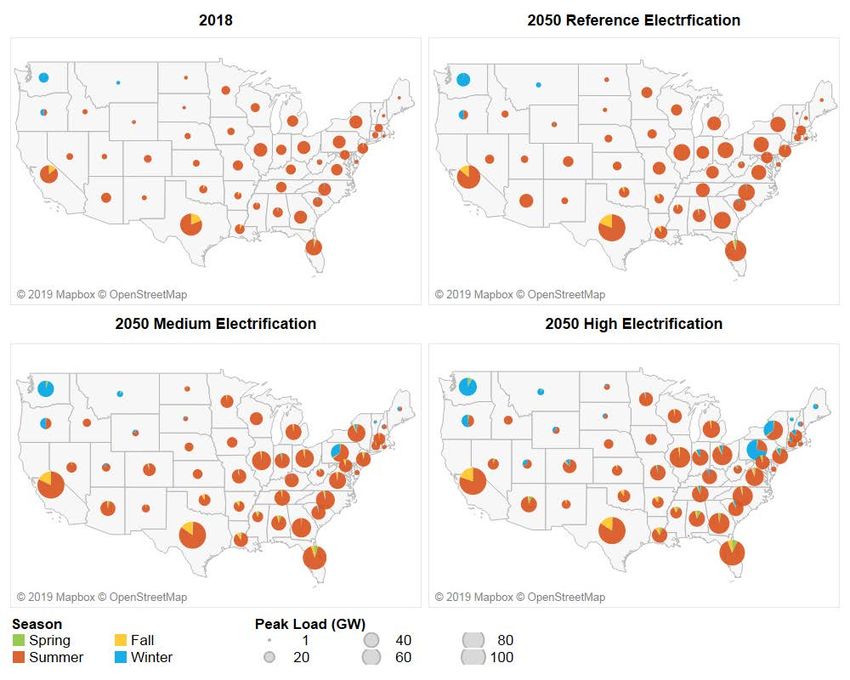
Coordination across regions can be especially important for integrating VREs into the grid
and maximizing their value. The sharing of reserves and energy can increase operational
efficiency, improve system reliability, reduce system costs, and maximize the utilization of VRE
generation (Greening the Grid 2015; Li and McCalley 2015; GMLC n.d.; GE Energy 2010,
Bloom et al. 2016; NREL 2012; Milligan and Kirby 2007; Cochran et al. 2012). However, it is
important to note that the benefits of regional coordination extend beyond VRE integration and,
in fact, some degree of resource sharing has existed since the beginning of the modern power
system when generation from VRE technologies was negligible. Furthermore, regional
coordination would require a shift away from local control and would likely require greater
complexity in managing the interactions between regional entities. Below, we describe how
electrification might affect regional interactions and how the ReEDS model captures them.

2.1.2 Changing Regional Interaction Dynamics with Electrification
Electrification changes the temporal and spatial patterns of electricity consumption and the
overall magnitude of demand growth; in turn, the opportunities for and value of resource sharing
and regional interactions could be impacted by electrification.

Potential impacts of electrification on regional peak demand include increases in peak demand
magnitude and shifts in the peak demand season from summer to winter in some regions. For
example, Figure 3 shows the estimated peak demand magnitude and seasonal timing in the
contiguous United States under different electrification scenarios of Mai et al. (2018). In cold
climate regions such as the Northeast, winter peaks (blue wedges) increase with electrification
due to increasingly electrified space heating. These electrification-induced impacts on regional
peak demand raise regional PRM requirements and therefore require attention during the
generation and transmission capacity planning process. The increased magnitude of peak demand
during the winter season also suggests a growing potential for the beneficial sharing of both
capacity and energy resource between interconnected regions with non-coincident peaks.

 7
This report is available at no cost from the National Renewable Energy Laboratory at www.nrel.gov/publications.
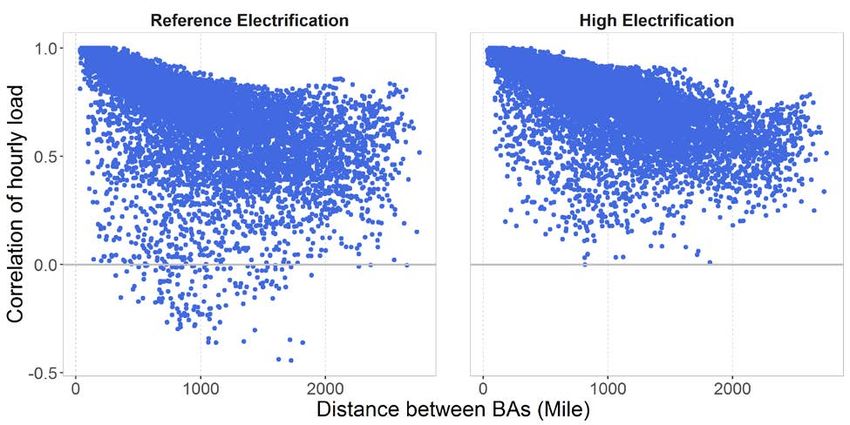
Figure 3. Peak load magnitude and seasonal timing by state for 2018 and 2050 for three
 electrification scenarios
 The size of the circles represents the total electricity demand in gigawatts (GW) during the top load
 hour of the year. The wedges of each pie show the seasonal distribution of the top 100 hours with
 the highest demand by state. Seasons are defined as follows: summer includes June, July, and
 August; fall includes September, October, and November; winter includes December, January, and
 February; and spring includes March, April, and May. Data shown for 2018 are based on modeled
 estimates. The peak load shown does not include demand-side flexibility; see Section 4 for a
 discussion of the potential impact of demand-side flexibility on peak load.

Electrification also affects regional load shapes, requiring changes in regional interactions in a
broader area. For example, Figure 4 shows load correlation coefficients between all pairs of 134
model BAs as a function of distance between BAs. The correlation coefficient is calculated for
each pair of model BAs using their estimated hourly load profile in 2050. Correlations are shown
for both the Reference (left) and High (right) electrification scenarios. The scatterplots show how
correlations between load profiles typically decline with distance, thereby offering opportunities
for resource sharing when proper transmission is available. In addition, the generally more-
correlated profiles under High electrification, as shown by the shallower slope on the right
scatterplot relative to the left one, suggest that to achieve the same degree of geospatial diversity
in consumption patterns might require coordination over even greater distances in scenarios with
widespread electrification.

 8
This report is available at no cost from the National Renewable Energy Laboratory at www.nrel.gov/publications.
One reason for the greater correlations under the High electrification scenario is the influence
that building electrification has on load profiles. In particular, Mai et al. (2018) assume that (1) a
greater shift toward electric heat pumps for space heating under the High electrification scenario
and (2) heating demands are well correlated in both spatial and temporal dimensions.
Furthermore, because the operational efficiency of heat pumps declines with temperature, the
correlated space heating-induced electricity consumption can lead to stresses on broad areas
in the system during extreme cold weather periods.

Figure 4. Correlation coefficients in 2050 hourly load profiles for model BAs under (left) Reference
 and (right) High electrification scenarios
 Each dot represents a certain pair of model BAs across all 134 BAs; the x-axis shows the distance between the
 centroid point of the pair of BAs.

Higher demands from electrification could raise operating reserve requirements, which could
require additional headroom and associated costs, but could also signal additional value for
coordinated operations. The same effects apply to greater planning reserve requirements induced
by electrification-driven higher peaks, but the magnitude of these effects can be even greater
given their relevance to avoiding new capacity construction. Finally, if the electrified load is met
with an increased contribution from VREs, higher levels of regional interactions may be cost-
effective to help integrate VREs, as discussed in Section 2.1.1.

2.2 Implementation in ReEDS
Using a system-wide optimization modeling framework, ReEDS finds the lowest-cost portfolio
of generation and transmission investment options (and the utilization of existing and new assets)
that meets all grid and policy requirements for the system as a whole. This perspective reflects a
system with full coordination and cooperation between regions. 14 The high spatial resolution of
the model allows ReEDS to consider regional differences in load profiles, VRE profiles, reserve

14
 Note this system-perspective of full coordination in planning and operation is not consistent with current practice.

 9
This report is available at no cost from the National Renewable Energy Laboratory at www.nrel.gov/publications.
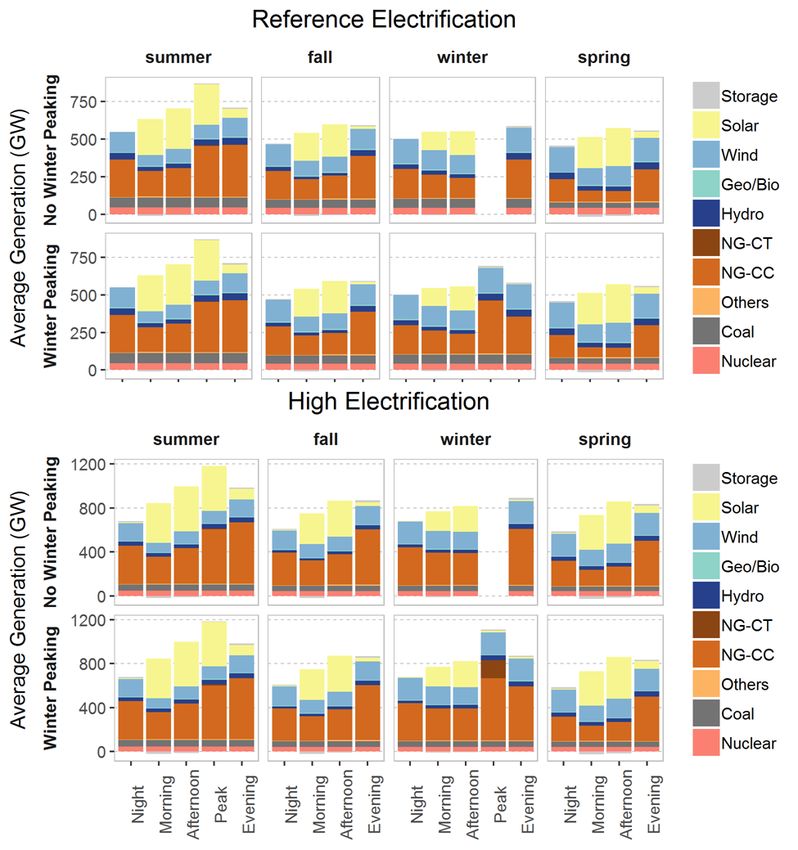
requirements, transmission limits, and capital and fuel costs in its least-cost investment and
dispatch decisions.

ReEDS models regional interactions for both planning and operations simultaneously. When
making investment decisions, ReEDS co-optimizes generation and transmission capacity
investments. ReEDS also allows regional planning reserve provision contracts to meet PRM
requirements. When modeling operation and dispatch, ReEDS models transmission flows to
meet the supply-demand balance requirement within each balancing area. In short, the ReEDS
model weighs the cost and benefit of local resources to meet grid system needs with resources
of distant regions, and it can thus be used to demonstrate how regional interactions might change
with electrification.

The modeled level of regional interactions highly depends on the temporal structure of the model
and the method used to model load and VRE profiles. Finer temporal representation provides
better evaluation of regional interactions because of load and generation profile diversity. To
better represent the regional interactions with higher levels of electrification, two major model
updates have been made to improve the temporal representation of both energy and capacity
resource sharing, especially with respect to peak demand: (1) considering seasonal PRM
instead of annual PRM and (2) directly modeling the winter peak for operations decisions. These
improvements allow the model to better assess the impacts of electrification on the power
system.

The 2018 final release version of ReEDS includes an annual planning reserve constraint
designed to enforce resource adequacy requirements for the system, which ensures sufficient
installed capacity to meet summer peak demand hours. However, this annual representation does
not capture the seasonal timing changes of peak demand with higher levels of electrification.
Therefore, we alter the model to consider seasonal planning requirements, based on the regional
peak demand for each of the four seasons modeled in ReEDS. Specifically, we update the
resolution of the following parameters from an annual to a seasonal level: regional peak load,
VRE capacity credit, and planning reserve provision trading between regions. 15 This
representation improves ReEDS’ ability to model the potential for sharing planning reserve
provision resources between regions, especially those that have different peaking seasons.

Furthermore, the 2018 final release version of ReEDS relies on 17 time-slices to reflect seasonal
and diurnal variations in load and VRE production in the reduced-form dispatch decisions and
power generation economics considered by the model. The model considers a representative day
for each season (summer, fall, winter, spring) and four periods within each day (morning,
afternoon, evening and night), plus a summer peaking time-slice that represents the 40 individual
hours with highest load in summertime. Such a temporal modeling structure captures major load
and generation features in the current, primarily summer-peaking U.S. system, but it fails to
account for the effect of the increased magnitude and more frequent occurrence of winter peaks
under widespread electrification. For this study, we add a time-slice to represent the 40

15
 Planning reserve provision requirements are applied at the level of the 134 model BAs, and the model (both the
2018 final release version and the one used for the EFS) allows planning reserve provision trading between BAs.
However, the 2018 final release version is more constrained in how it represents these reserve requirements since it
only has a single annual level.

 10
This report is available at no cost from the National Renewable Energy Laboratory at www.nrel.gov/publications.
individual hours with highest load in winter. 16 The new time-slice better captures generation and
dispatch decisions during peak winter load hours, and it allows the model to better evaluate
energy resource sharing opportunities between regions with non-coincident peaks.

2.3 Scenario Results
The two modeling updates (winter peaking time-slice and seasonal PRM requirement) allow
ReEDS to better capture energy and capacity needs—as well as the potential for resource sharing
to meet these needs—especially in scenarios where winter peak demands become more common.
This section summarizes the impacts of each model change on the modeling results considering
different electrification levels using Base Case assumptions. 17

From a capacity perspective, changing from an annual to a seasonal planning reserve constraint
helps the model more precisely represent the capacity needs of the system, as well as planning
reserve provision trading between regions. With seasonal planning reserve requirements and
planning reserve provision trading, the model is better able to capture how capacity from a single
power plant can serve resource adequacy needs of multiple regions when the regional peak loads
are imperfectly correlated and there is sufficient transmission capacity between regions. Under
these conditions, the effective stringency of the planning reserve or resource adequacy
requirements declines (compared to the case when only an annual requirement is represented),
which would reduce overall capacity needs. Figure 5 shows that planning reserve provision
needs decrease when changing from annual to seasonal PRM requirements.

Applying seasonal requirements results in about 131 GW in net summer planning reserve
provision 18 reductions in 2048 19 under High electrification compared to when an annual planning
reserve requirement is used, and the net reduction is 224 GW in winter. The results suggest
seasonal planning reserve provision trading helps reduce capacity needs during non-correlated
peaks. During the summer, some of the decline in natural gas-fired planning reserve provision is
compensated by additional planning reserve provision from solar photovoltaics (PV). Because
PV has a lower capacity credit than non-variable generators, installed capacity of PV is higher
than its planning reserve provision. In winter, this additional installed PV capacity does not
provide planning reserve provision services, as PV has near-zero capacity credit at these times
when the solar resource is more limited and peak loads may occur during non-daylight hours. In
fact, we find an overall reduction in planning reserve provision needs in winter with the seasonal

16
 We assume the top 40 hours occur in the evening and correspond to the period with the highest proportion of
top load hours: in 2020, 70% of the top 100 winter load hours occur in the evening, and under high electrification,
the proportion increases to 95% in 2050. However, it is important to note that there is significant uncertainty about
the timing of this electrification-induced winter electricity consumption.
17
 The scenario results in this section are only used to demonstrate the impacts of certain model changes; they do
not indicate any specific impacts of electrification.
18
 Planning reserve provision is defined as the installed capacity multiplied by the seasonal capacity credit for a
certain technology. ReEDS assumes a capacity credit of 100% for all non-variable technologies and endogenously
calculates the capacity credit for VRE technologies.
19
 Results shown here are modeled 2048 results, because planning reserve provision values are calculated after the
solve year and 2050 results are not available in scenarios that run through 2050.

 11
This report is available at no cost from the National Renewable Energy Laboratory at www.nrel.gov/publications.
You can also read