ENERGY
TRANSITION
OR ENERGY
  EXPANSION?
←
→
Page content transcription
If your browser does not render page correctly, please read the page content below
ENERGY
TRANSITION
 OR ENERGY
EXPANSION?
ENERGY TRANSITION OR ENERGY EXPANSION?
Energy Transition or Energy Expansion?
Published by the Transnational Institute (TNI) and Trade Unions for Energy Democracy (TUED)
New York and Amsterdam
October 2021

Researchers
  Sean Sweeney (TUED)
  John Treat (TUED)
  Daniel Chavez (TNI)

Editors
  James Angel
  Denis Burke

Contents of the report may be quoted or reproduced for non-commercial purposes, provided that the source
of information is properly cited. TNI and TUED would appreciate receiving a copy or link of the text in which
this document is used or cited.

www.tni.org
unionsforenergydemocracy.org
CONTENTS

Executive summary                                                   1

1 Introduction                                                      5
        Rising “ambition”, weak action                              6
        Energy transition or energy expansion?                      7
        Goals and structure of the report                           8

2 Covid-19 and the energy system                                    9
        A pandemic silver-lining?                                  10
        Resuming business as usual                                 10
        Sector-specific analyses                                   11
               Coal                                                11
               Oil                                                 13
               Gas                                                 15
               Renewables                                          16
        Summary                                                    17

3 Unpacking failure: where neoliberal energy policy went wrong     19
        Neoliberal climate policy                                  20
        Sticks and carrots                                         21
                Carbon pricing                                     21
                Incentivizing renewables                           22
                Why comparing “installed capacity” is misleading   23
                The investment deficit in renewables               25
        The falling costs fallacy                                  25
                Questioning the tipping point                      26
                Profitability crisis                               27
        The utility “death spiral”                                 29
                Storage and expansion of the grid                  31
                Flexibility investment crisis                      32
                Demand side response                               33
        Summary                                                    34

Conclusion                                                         35

Notes                                                              39

Acronyms and abbreviations                                         45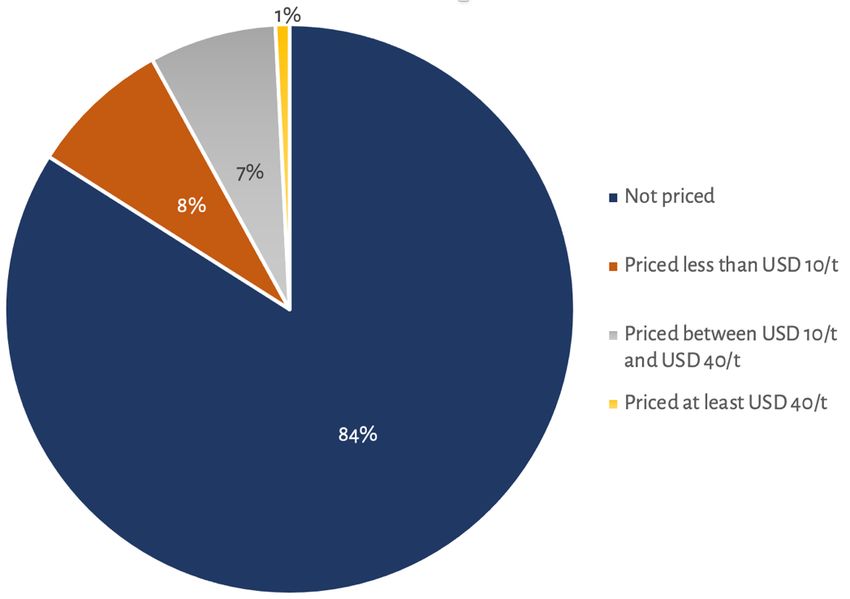
EXECUTIVE
SUMMARY
F
      rom politicians to corporate executives, media commentators to
      environmental campaigners, narratives evoking the “unstoppa-
      ble” progress of a global transition from fossil fuels to renewable
energy have grown increasingly commonplace.
   However, in reality, the global shifts in energy production, energy us-
age and greenhouse gas emissions we urgently need are not happening:
•   In 2019, over 80% of global primary energy demand came from fossil
    fuels, with global greenhouse gas emissions at record levels.1
•   In 2020, wind and solar accounted for just 10% of global electricity
    generated.2
•   Despite stories of its decline, coal-fired power generation continues
    to rise globally. In 2020, global efforts to decommission coal power
    plants were offset by the new coal plants commissioned in China
    alone, resulting in an overall increase in the global coal fleet of 12.5
    GW.3
    Recently, some have argued that the Covid-19 pandemic and subse-
quent contraction in economic activity signal a turning point. Indeed,
global energy demand fell by nearly 4% in 2020, while global energy-re-
lated CO2 emissions fell by 5.8% — the sharpest annual decline since the
second world war.4
   Despite these short-term shifts, the pandemic has failed to result in
any significant long-term changes for the energy sector or associated
emissions:
•   Global energy-related CO2 emissions are projected to grow by 4.8%
    in 2021, the second highest annual rise on record.5
•   Demand for all fossil fuels is set to rise in 2021.6 A 4.6% increase in
    global energy demand is forecast for 2021, leaving demand 0.5%
    higher than 2019 levels.7
•   By the end of 2020 electricity demand had already returned to a level
    higher than in December 2019, with global emissions from electric-
    ity higher than in 2015.8
•   By the end of 2020, global coal demand was 3.5% higher than in the
    same period in 2019.9 A 4.5% rise in coal demand is forecast for 2021,
    with coal demand increasing 60% more than all renewables growth
    combined and undoing 80% of the 2020 decline.10
•   Oil demand is forecast to rebound by 6% in 2021, the steepest rise
    since 1976.11 By 2026, global oil consumption is projected to reach
    104.1 million barrels per day (mb/d), an increase of 4.4 mb/d from
    2019 levels.12
   As such, an energy transition with the depth and speed necessary for
meeting the 2015 Paris Agreement shows no sign of materializing. In-
deed, most of the world’s major economies are not on track to reach their
Nationally Determined Contributions (NDCs) on emissions reductions.13
  These facts point to a clear conclusion: the dominant, neoliberal cli-
mate policy paradigm, which deploys a “sticks and carrots” approach that

2                                                                    ENERGY TRANSITION OR ENERGY EXPANSION?
attempts to disincentivize fossil fuels through carbon pricing, while pro-
moting low-carbon investment through subsidies and preferential contrac-
tual arrangements has been completely ineffective. This policy paradigm po-
sitions governments as guardians and guarantors of the profitability of pri-
vate actors, thus preventing them from addressing social or environmental
challenges head-on. The results have been disastrous:
• 15 years after on the establishment of the European Union’s flagship
Emissions Trading System, the vast majority of global emissions (84%)
are still not priced at all, and the share of emissions that are priced high
enough to be potentially effective remains well below 1%.14 The Interna-
tional Monetary Fund (IMF) estimates that the global average carbon
price is a mere one-twentieth of the absolute minimum price it consid-
ers necessary.15
• Although renewables have increased their global share of energy usage,
this growth has been outstripped by rising electricity demand. The
global electricity system has been expanding at an annual rate of nearly
300 GW per year in recent years, but renewable capacity only grew by
198 GW in 2020, and the rate of increase year-on-year has been slow over
the past decade: an average of just 11 GW per year.16 Worse still, the rate
of growth for renewable energy deployment has almost halved in the
past five years.17
Today the growth of renewables is being impeded by an investment cri-
sis, and investment levels will need to increase dramatically in order to reach
climate goals:
• China, responsible for 40% of renewables investment in 2017, reduced
its renewables investment by 38% in 2018, with investments falling a fur-
ther 8% in 2020 to the lowest figure since 2013.18
• Investment in new renewable power generation capacity (mainly wind
and solar) needs to total USD 22.5-trillion by 2050.19 That equates to
around USD 662-billion each year, every year — roughly double the levels
of investment seen in recent years, which have averaged around USD
300-billion.
Furthermore, the current policy does not adequately account for the im-
pact of “variable renewable energy” (VRE):
• There is a risk that power utilities are increasingly unable to keep oper-
ating the “baseload” fossil fuel plants still relied upon across much of the
world. As such, governments are currently stepping in to subsidize the
fossil fuel industry, at the cost of the taxpayer or consumer.
• The technologies required to integrate renewable energy into electricity
grids are themselves facing significant obstacles. For example, accord-
ing to the IEA, under 2% of the global potential for demand-side flexibil-
ity is currently realized.20
In sum, the current policy is incapable of delivering the energy transition
urgently required. It relies on failed “market mechanisms” (“sticks and car-
rots”); suffers from a massive investment, deficit, and has failed to deal with
the technical challenges posed by variable renewable energy.
EXECUTIVE SUMMARY 3We need an alternative paradigm. As we have seen with the pandemic, addressing complex global problems in short timescales calls for govern- ment planning and coordination. A TUED-PSI-FNME-CGT joint report on Public Energy Futures to be released at COP 26 will set out an agenda for democratically controlled public ownership and management of the en- ergy sector. A truly public approach to energy transition is necessary for lim- iting climate change and avoiding the worst climate impacts. 4 ENERGY TRANSITION OR ENERGY EXPANSION?
1
INTRODUCTION
We see the energy transition is in full swing, with the highest capacity of
          renewables financed ever. Meanwhile, the fossil fuel sector has been hit hard by
        the Covid-19 crisis, with demand for coal- and gas-fired electricity down in many
                                                        countries, and oil prices slumping.
    Nils Stieglitz, President, Frankfurt School of Finance & Management, 2020.21

     The recent [emissions] trends show that the gap between where we are and where we
       should be is not decreasing but widening. We are heading in the wrong direction.
                         International Renewable Energy Agency (IRENA), 2021.22

F
      or more than a decade, mainstream policy institutions, analysts
      and commentators have advanced some version of the claim that
      the transition to a sustainable, low-carbon future energy system is
already underway and accelerating, even “inevitable” or “unstoppable.”
   Such a transition has long been recognized as central to the struggle
to minimize the risk of dangerous climate change by limiting greenhouse
gas (GHG) emissions, nearly three-quarters of which come from energy
use.
   According to the neoliberal "green growth" vision, the transition to
low-carbon energy is being driven by two kinds of policy interventions.
The first involves putting a price on CO2 and other greenhouse gases. Ac-
cording to this theory, if emitters had to pay for their emissions (the “pol-
luter pays” principle), then they would either make investments to reduce
emissions from existing activities or begin to redirect investment into
less carbon-intensive activities. This thinking has informed the develop-
ment of various carbon pricing mechanisms, such as emissions trading
schemes and carbon taxes.
   The second kind of intervention is aimed at incentivising private-sec-
tor investment in renewable energy, green technologies, and other low-
carbon solutions. Incentives include direct subsidies, preferential or con-
cessionary financing and favourable long-term contracts.
    This mixture of disincentives and incentives has been described as a
"sticks and carrots" approach whereby governments send signals to pri-
vate investors and energy users.23 Adopted by almost all of the world’s
major economies, these interventions were expected to both "unlock" and
redirect private sector investment, to unleash new markets and foster
unlimited opportunities for sustainable prosperity.

RISING “AMBITION”, WEAK ACTION
However, it is today quite clear that most of the world’s major economies are
not on track to reach their Nationally Determined Contributions (NDCs) on
emissions reductions. While a number of governments have adopted “net-
zero” emissions targets, these targets, according to the United Nations En-
vironment Programme (UNEP), “highlight the vast discrepancy between the
ambitiousness of these goals and the inadequate level of ambition in the
NDCs for 2030”.24

6                                                                                ENERGY TRANSITION OR ENERGY EXPANSION?
In other words, the distance between ambition and action has widened
considerably. The result, in the terms of the Intergovernmental Panel on Cli-
mate Change (IPCC) August 2021 report, is that climate change is “rapid, wide-
spread and intensifying”.25
The main features of neoliberal climate policy have been dominant for
almost 30 years now, during which time emissions from fossil fuel use have
continued to rise. Emissions rose 61% between 1990 and 2014 — a period that
roughly coincides with the adoption of the UN Framework Convention on
Climate Change (UNFCCC) and the late-stage negotiations that led to the
Paris Agreement.26 Global CO2 emissions levelled off from 2014-2016 but
then rose again in 2017, by 2%, and an additional 1.7% in 2018.27 Annual emis-
sions in 2019 remained at record levels, and more than 80% of total primary
energy demand came from fossil fuels: oil, gas, and coal.28 While emissions
fell in 2020 when the outbreak of the Covid-19 pandemic brought a major
global economic slowdown, recent data indicates that emissions may soon
return to 2019’s record-breaking levels.29
ENERGY TRANSITION OR ENERGY EXPANSION?
The growing gap between ambition and action has been a source of growing
anxiety for the scientific community and some political leaders. But this has
not led to any serious interrogation of the neoliberal “sticks and carrots” ap-
proach.
Proponents of this approach argue that any issues with the pace and
depth of the transition highlight only that neoliberal policies are not being
pursued aggressively or consistently enough. What they mean by this is: pri-
vate investors need to be given more incentives; carbon pricing schemes
must proliferate and become more robust in their impact on polluters; sub-
sidies for fossil fuels must be removed as quickly as possible; and energy
market liberalization and privatization must be pursued more aggressively
than ever. Because the need for climate action is so pressing, neoliberal in-
stitutions also propose that public money should be used to further “lever-
age,” “unlock” and “de-risk” private investment, so that new markets can be
created and new industries may begin to flourish.
This report will show that neoliberal climate and energy policy has failed.
The energy transition is not happening. Neoliberal institutions are unwill-
ing to take responsibility for the fact that their broader agenda — trade lib-
eralization, privatization, strengthening the power of private corporations,
financial deregulation, etc. — is helping to drive energy use and emissions
ever higher. In keeping with IMF and World Bank orthodoxy, the spokesper-
sons of neoliberal policy uncritically endorse endless economic growth and
capitalist accumulation. They are quick to emphasize the need to “decouple”
growth from rising emissions — something that has demonstrably failed to
occur — but have shown little or no willingness to acknowledge that meeting
the Paris targets is simply incompatible with the neoliberal “green growth”
agenda.
INTRODUCTION 7This helps to explain the fact that, in recent decades, what we have
witnessed is not an energy transition, but an energy expansion. Despite
some changes in the fuel mix in some places and some sectors, overall
energy demand has continued to rise even faster than the deployment of
new, “clean” energy sources. As a result, nearly all forms of energy have
grown alongside each other. Renewable sources have been a significant
contributor to that overall growth — particularly in the power sector —
but this has not resulted in any significant displacement of fossil-based
energy.
GOALS AND STRUCTURE OF THE REPORT
In the pages that follow, we document three specific failures of neoliberal
climate and energy policy.
The first failure is “carbon pricing”, which has not remotely ap-
proached the breadth or levels required in order to be effective.
The second failure is that efforts to “incentivize” private investment
to decarbonize energy supply have not produced the levels of investment
required.
The third failure is that the neoliberal “energy-for-profit” paradigm
has not only failed to drive the transition, but actually stands in the way
of it. Here we focus on how the current approach to energy transition
has: (1) created a chaotic “energy war” between competing for-profit
companies; (2) led to the proliferation of profit guarantees (“subsidies for
all”); and (3) neglected some serious technical challenges associated with
the “variability” of renewable energy.
Following this introductory first chapter, Chapter 2 looks at the cur-
rent state of energy and emissions in the context of the Covid-19 pan-
demic. It shows that, contrary to the claims of some, the pandemic has
not fundamentally disrupted longer-term trends of increasing energy
use and rising emissions. Chapter 3 takes a wider view of neoliberal en-
ergy and climate policy, drawing attention to the specific failures men-
tioned above, and why these failures occurred. Chapter 4 concludes the
report, highlighting the need for an alternative approach to climate and
energy policy premised upon public goods and public ownership.
8 ENERGY TRANSITION OR ENERGY EXPANSION?2
COVID-19 AND
THE ENERGY SYSTEMS
ome commentators have claimed that the Covid-19 pandemic
marks a significant turning point for the energy sector. Indeed,
the sudden decline in economic activity at the start of the pan-
demic did usher in a temporary reduction in global energy use and green-
house gas emissions. However, by December 2020, electricity demand
had already returned to a higher figure than in December 2019.
Meanwhile, fossil fuel usage is once again on the rise and overall en-
ergy consumption continues to grow at a rate that outpaces renewables
investment. As such, despite some initial signs of hope, the pandemic
shows no sign of having disrupted business as usual in the long-term.
A PANDEMIC SILVER-LINING?
It is by now widely recognized that the pandemic set in motion a chain
of events around the world that led to a record annual fall in global energy
use and emissions. According to the latest statistics from the Interna-
tional Energy Agency (IEA), global energy demand fell by nearly 4% in
2020, while global energy-related CO2 emissions fell by 5.8% — the sharp-
est annual decline since the second world war.30 According to the Inter-
national Energy Agency’s (IEA’s) World Energy Outlook 2020:
The Covid-19 pandemic has caused more disruption to the energy sector
than any other event in recent history, leaving impacts that will be felt for
years to come.31
Consumption fell across all forms of energy — down 5.3% overall. —
except for renewables, according to the IEA; meanwhile, global invest-
ment in energy fell by a staggering 18%.32
The sharp drop in consumption of all fossil fuels during 2020 brought
a record annual fall in emissions. Early in the pandemic, an analysis pub-
lished in Nature Climate Change had found that global emissions in early
April were down 17% compared to one year earlier, roughly the same as
the emissions levels of 2006.33 According to this study, emissions from
road transport fell by 36%, with emissions from the power sector falling
by 7.4%, and emissions from industry falling by 19%.
While some of these reductions were temporary, and partially re-
versed later in the year as restrictions eased, by the end of the year overall
global carbon dioxide (CO2) emissions were still expected to be down by
7%— the largest absolute decrease in annual emissions ever recorded,
and the largest relative decrease since the second world war.34
RESUMING BUSINESS AS USUAL
Emissions declines were largest in the richest countries; according to the
IEA, averaging declines of almost 10%. Emissions from the so-called
“emerging markets” and “developing economies” contracted by 4% from
2019 levels.35 Emissions were down for all of the world’s major emitters:
12% for the United States (US), 11% for the European Union (EU), 9% for
India and 1.7% for China.36
10 ENERGY TRANSITION OR ENERGY EXPANSION?The unprecedented contraction in energy consumption and the fall in
emissions unleashed by the pandemic initially sparked hope of a turning
point, away from ever-escalating energy use and emissions. But similar
hopes were expressed following the financial crisis and economic crash of
2008-9 — and then quickly dashed as energy use and emissions rapidly re-
turned to pre-crash levels.37 Indeed, economic chaos caused by the response
to one emergency is hardly a strategy for dealing with another. Far from
helping catalyse systemic change towards a low-carbon future, the pan-
demic crisis has thrown the lives of most working people into chaos, and in
many instances undermined the capacity of public authorities to respond
either to the immediate health crisis, or to the larger ecological crisis lurking
behind it. In the words of the IEA Executive Director, Fatih Birol:
The economic downturn has temporarily suppressed emissions, but low eco-
nomic growth is not a low-emissions strategy — it is a strategy that would
only serve to further impoverish the world’s most vulnerable populations. Only
faster structural changes to the way we produce and consume energy can break
the emissions trend for good.38
Indeed, the pandemic has had little sustained impact on the prospects of
low-carbon energy transition. The IEA projects that global energy-related
C02 emissions will grow by 4.8% in 2021, the largest annual increase since
the financial crisis that hit more than a decade ago and the second highest
annual rise on record.39 It also forecasts a 4.6% increase in global energy de-
mand for 2021, a rise higher than the 2019 4% contraction that would leave
demand at 0.5% higher than 2019 levels.40 Demand for all fossil fuels is set to
rise in 2021.41 Electricity demand is also set to rise quicker this year than any
point over the past decade — by 4.5%, five times the 2020 contraction.42 By
the end of 2020 global emissions from electricity had already returned to
levels higher than in 2015, when the Paris Climate Agreement was adopted.
By December 2020, electricity demand had already returned to a level higher
than those of December 2019, with India up by 5%, the EU by 2%, Japan by
3%, South Korea by 2%, and the US by 2%.43
The disruptions caused by the pandemic have also set back efforts to im-
prove access to electricity, reversing several years of prior progress. For ex-
ample, the number of people without electricity access in sub-Saharan Af-
rica will likely rise in 2020, according to the IEA’s World Energy Outlook
2020.44
The fact that global energy systems have not been fundamentally altered
by the pandemic disruptions and are likely soon to return to something like
“business as usual,” should draw fresh attention to the overall challenge.
SECTOR-SPECIFIC ANALYSES
This section of the report offers a sector-specific analysis of the impacts of
the pandemic on the energy sector.
COAL
Global coal consumption fell by 4% in 2020. But most of that decline oc-
curred in the first few months of the year. Coal use by the end of 2020
COVID-19 AND THE ENERGY SYSTEM 11was 3.5% higher than in the same period in 2019, helping to usher in a
return to growing global CO2 emissions.45
The IEA forecasts a 4.5% rise in coal demand for 2021, with coal de-
mand increasing 60% more than all renewables growth combined and
undoing 80% of the 2020 decline. On this projection, by the end of the
year global coal demand would rise to higher than 2019 levels and return
to its 2014 peak.46
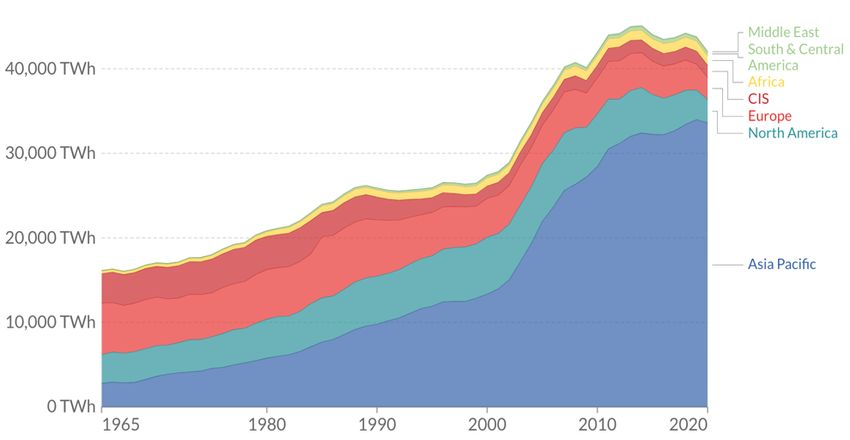
Figure 1: Coal consumption by region
Annual coal consumption, measured in equivalents of terawatt-hours (TWh) per year
Source: BP (2021) Statistical Review of World Energy, available at: https://www.bp.com/en/global/corpo-
rate/energy-economics/statistical-review-of-world-energy.html.
Looking ahead, the IEA projects that growth in demand for coal may
“flatten” by 2025 or so. But that still means continuing consumption of
roughly 7.4 billion tonnes per year.47 In rich economies where coal use for
power generation has declined, it has mainly been replaced by gas rather
than by renewables. Coal and gas have essentially swapped places in the
electricity generation mix in the US over the past decade: from 45% for
coal and 23% for gas in 2009, to 24% and 38% respectively in 2019.48 Eu-
rope saw a similar reversal, with the respective shares of coal and gas in
the EU’s power generation mix shifting from 31% for coal and 16% in
2009, to 15% and 22% respectively for 2019.49
Coal remains a major fuel for key countries of the South, particularly
in Asia (see Figure 1), most importantly China and India. Vietnam and
Indonesia have also seen dramatic growth in coal use in recent years: 30%
and 20% respectively during 2019 alone.50
China is already responsible for roughly one-quarter of annual global
GHG emissions, largely due to its vast fleet of coal-fired power stations,
which continues to expand rapidly. Indeed, the 38.4 GW of new coal
plants commissioned by China in 2020 – equivalent to over one new coal
plant per week – offset the year’s record global coal power station retire-
ments, resulting in an overall increase in the global coal fleet of 12.5 GW.51
Chinese power companies submitted proposals for 73.5 GW of new coal-
fired power in 2020 — more than five times the 13.9 GW initiated in the
rest of the world combined. Also, in 2020, Chinese provincial authorities
12 ENERGY TRANSITION OR ENERGY EXPANSION?granted approval to build 36.9 GW of coal power projects — more than triple
the capacity approved the year before.52
After China, India remains by far the largest user of coal in the Asia, with
coal usage growing quickly. The pandemic and lockdowns led to a dramatic
fall in India’s coal consumption during 2020. But speculation that this fall
represents “the beginning of the end of coal in India” seems premature.53 As
with China, India’s response to the pandemic is expected to reinforce Prime
Minister Modi’s reliance on coal to stimulate a pandemic recovery, including
over USD 6billion earmarked for coal transport infrastructures.54 Mean-
while, the output target for India’s state-owned coal company — the world’s
largest miner of coal — was raised 18% for the year, to 710 million tons.55
In contrast, several other Asian countries announced cancellations or de-
lays of planned coal power projects during 2020. Indonesia, Bangladesh, the
Philippines, and Vietnam cancelled 62.0 GW of planned coal capacity, leav-
ing an estimated 25.2 GW in the pre-construction planning pipeline across
these four countries. This amounts to an 80% decline from the 125.5 GW
planned there five years earlier.56 These cancellations have been attributed
to a combination of lower demand due to the pandemic, greater difficulty
securing financing, and falling costs for wind and solar.
Yet such developments hardly mean that coal’s fate in Asia is sealed. As
the IEA points out in a December 2020 commentary:
India, Pakistan, Bangladesh and Southeast Asian countries currently con-
sume the same amount of electricity annually for a population of 2.4 billion
people as the European Union does for a population of 450 million. The task of
scaling up those Asian energy systems to meet rising demand without increas-
ing coal consumption is possible, but it also represents a significant chal-
lenge.57
One crucial difference between the OECD and some of the major non-
OECD countries like China and India concerns the age of their generation
capacity. The declining role of coal in the OECD’s power sector is being
driven by the fact that many coal-fired power stations are reaching the end
of their life. This capacity is being replaced by wind, solar, biomass, and
some gas-fired capacity.58 By contrast, many of the coal-fired power stations
in Asia are relatively new, and thus have a long “useful” life ahead of them.
While the average age of a coal plant in the US is 39 years,59 for China this
figure is just 14 years.60
OIL
Oil consumption saw the sharpest fall among the major fossil fuels during
2020. In the early months of the pandemic, the contraction in oil consump-
tion led some analysts and commentators to suggest that the long-predicted
“peak oil demand” may have finally arrived.61
The unprecedented collapse in demand has had a clear impact on up-
stream investment in the sector, which fell by roughly one-third compared
to stated plans at the start of the year.62 Due to the “price war” between Saudi
Arabia, Russia and the US, upstream investment had already fallen sharply
COVID-19 AND THE ENERGY SYSTEM 13from the levels of 2012-2013, but prior to the pandemic had shown signs
of a recovery.63
Figure 2: Oil demand forecast, 2010-2026, pre-pandemic and in Oil 2021
Source: IEA (2021), available at: https://www.iea.org/data-and-statistics/charts/oil-demand-forecast-
2010-2026-pre-pandemic-and-in-oil-2021.
However, although the growth in global demand for oil has been im-
pacted by the pandemic, the IEA acknowledges that, in the absence of
more radical change, “longer-term drivers of growth will continue to
push up oil demand” (see Figure 2).64 Indeed, oil demand is forecast to
rebound by 6% in 2021, faster than any other fossil fuel and the steepest
rise since 1976.65
According to OPEC, global demand for oil, “is expected to increase by
4.2 million barrels a day in 2022 to 100.8 million barrels a day, 980,000
barrels a day higher than last month’s estimate and exceeding pre-pan-
demic levels.”66
The IEA projects that, by 2026, global oil consumption will reach 104.1
million barrels per day (mb/d) — and an increase of 4.4 mb/d from 2019
levels. It writes: “In the absence of major policy changes from govern-
ments and more rapid changes in behaviour, global oil demand is set to
increase for years to come.”67
One major source of rising demand for oil is the continuing growth of
consumer demand for larger personal vehicles — especially SUVs (see
Figure 3). According to an IEA commentary in early 2021, energy-related
carbon emissions declined across all sectors in 2020 except for SUVs.68 In
late 2019, the Financial Times reported that electric vehicle (EV) sales were
being outpaced by SUVs, which at that time accounted for 45 per cent of
new car sales in the US, 42 per cent in China, 34 per cent in Europe, and
23 per cent in India — and this share has steadily risen across all major
economies for the past decade.69
The consequences of this steady growth in SUV sales are hard to over-
state. For one thing, the reduction in oil demand from that higher share
of EVs in the overall car market — roughly 40,000 barrels of oil per day
— was outpaced by the growth in SUV sales within the same time pe-
riod.70
14 ENERGY TRANSITION OR ENERGY EXPANSION?Figure 3: Share of SUVs in total car sales in key markets, 2010-2019
— United States — Europe — China — India — South Africa — Global
Source: IEA (2021), available at: https://www.iea.org/data-and-statistics/charts/share-of-suvs-in-total-car-
sales-in-key-markets-2010-2019.
GAS
Globally, demand for gas has roughly doubled since 1990 and is expected to
continue its rapid rise in the years ahead, absent a major shift in policy.71
According to the IEA’s Global Energy Review 2020, published during the
very early days of the pandemic (April 2020), mild weather in Europe drove
down demand for gas by roughly 2.6% during the first quarter of 2020 com-
pared to one year earlier. Over the same time scale, demand for gas in the
US fell by roughly 4.5%, while Japan’s LNG imports fell by 3%. Demand in
China remained essentially flat but grew in India at nearly 8% compared
with one year earlier.72 By the end of the year, global demand for natural gas
had fallen by 3% overall.73 These disruptions have caused significant uncer-
tainty for gas markets and producers and may result in regional shifts in
production and distribution, and even some issues for security of supply.
Figure 4: Global natural gas by scenario, 2010-2030
Source: IEA (2021), available at: https://www.iea.org/data-and-statistics/charts/share-of-suvs-in-total-car-
sales-in-key-markets-2010-2019.
But despite even these considerable disruptions, the ongoing rise in over-
all demand is expected to continue. As the IEA projects on its “Stated Policies
COVID-19 AND THE ENERGY SYSTEM 15Scenario,”74 gas will recover quickly, rising by 3.2% in 2021, and then ris-
ing steadily to 14% above 2019 levels by 2030, with most of that growth
taking place in Asia (see Figure 4).75
Gas is often presented as a “bridge fuel” in many decarbonization sce-
narios and is frequently the preferred fuel to replace coal in power gen-
eration. Carbon dioxide (CO2) emissions associated with burning natu-
ral gas are lower than those for coal — as are other damaging forms of
particulate air pollution. However, even small leaks of methane during
its extraction and processing can offset the effects of lower CO2 emis-
sions. A major 2018 study found that methane leakage in the US is 60%
higher than previous estimates — enough to erase the greenhouse warm-
ing advantage from using methane rather than coal.76
RENEWABLES
The year 2020 saw renewables reportedly “defying the odds,” compared
to the impact the pandemic crisis had on other forms of energy. For 2020,
the amount of all new net installed renewable capacity grew by roughly
4% for the year, to reach nearly 200 GW in total.77 Overall, renewable ca-
pacity additions accounted for nearly 90% of the year’s total increase in
global power generation capacity. Net solar capacity increased by 107GW,
wind by 65GW; and hydropower by 18GW.78 The amount of electricity
generated from all renewable sources rose nearly 7% in 2020 compared
to the year before. Renewables demand grew 3% in 2020 and the IEA fore-
cast increase renewables demand across electricity, heat, transport and
industry for 2021.79
According to the IEA, both China and the US saw substantial gains in
both wind and utility-scale solar PV during 2020. China alone accounted
for nearly half of onshore wind capacity last year (adding around 29 GW)
and more than half of global growth in offshore wind (adding 2.6 GW).80
Meanwhile, the US added 12 GW of onshore wind capacity — nearly a
third more than during 2019, despite the Covid-19 lockdowns.
But in both China and the US, the gains made by renewables in 2020
were largely the result of developers “rush[ing] to complete projects be-
fore changes in policy take effect”81 — that is, before key subsidies and
tax credits expired. More generally, the growth in renewables seen dur-
ing 2020 was helped along by existing long-term contracts, guarantees
for priority access to the grid, and ongoing completion of projects already
in the pipeline.82
Similarly, for the current year (2021), the IEA anticipates that Europe
and India will “lead a renewables surge,” producing a “record expansion”
of renewable capacity additions of nearly 10%. But, again, this expected
“record expansion” turns out to be largely due to the completion of pro-
jects that were delayed during 2020, either by the pandemic or by various
contractual or legal issues.83 In other words, the expected record growth
for 2021 includes a significant “catch-up” factor following slowdowns in
2020.
16 ENERGY TRANSITION OR ENERGY EXPANSION?Even beyond 2021, the IEA’s assessment reveals that the deployment of
renewables in major economies will continue to be tied to subsidies. The IEA
notes that accelerating deployment of wind power in the years ahead “will
require the enhancement of policy support schemes, more investment in
grids, eradication of social acceptance and permitting challenges, faster ex-
pansion of corporate PPAs and alleviation of regulatory uncertainties and
off-taker risks in emerging markets.” As expiration deadlines for existing
subsidies or other supports are approached, developers rush to hit key pro-
ject milestones for eligibility and lock in those supports. Once the supports
have expired, deployment stalls.84
Crucially, despite the considerable level of policy support provided to
date, the growth of renewables has struggled to keep up with rising electric-
ity demand. Prior to the pandemic, annual increases in demand had aver-
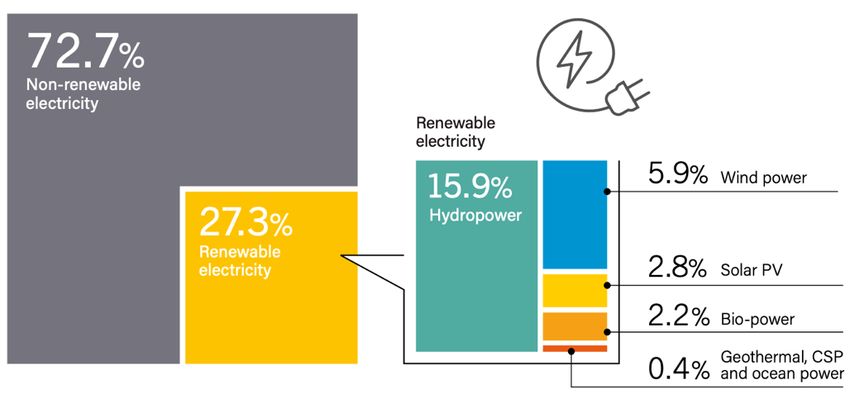
aged between 2% and 3%. Thus, although renewables (including large hydro-
electric systems) met nearly 28% of global electricity generation in the first
quarter of 2020,85 coal and gas still provided more than 70% of global elec-
tricity supply at the end of 2019 (see Figure 5). According to the World Eco-
nomic Forum, “even after a decade of sustained capital investment and a
policy environment conducive to renewable energy sources, renewable en-
ergy supply (solar photovoltaic and onshore wind) amounts to only 1.6% of
global primary energy supply.”86
Figure 5: Estimated Renewable Energy Share of Global Electricity Production, End-2019
Source: REN21 (2020) Renewables 2020 Global Status Report, available at: https://www.ren21.net/wp-content/up-
loads/2019/05/gsr_2020_full_report_en.pdf.
Equally concerning, demand for energy beyond the power sector is also
growing steadily, especially in the transport sector. This is led by the global
south, where a combination of rapid urbanization and inadequate public
transport systems is driving demand for private automobiles and other
forms of mechanized personal mobility.
SUMMARY
This brief survey of the energy sector after a year of Covid-19 illustrates that,
without major changes to the infrastructures on which our economies de-
pend — for mobility, for heating and cooling, for industrial processes, and
more — demand for fossil fuel energy will continue at levels that will make
COVID-19 AND THE ENERGY SYSTEM 17the Paris targets impossible to reach. The pandemic has done nothing to al- ter this. Globally, demand for all forms of energy continues to rise, renewa- bles cannot keep pace, and emissions have risen accordingly. 18 ENERGY TRANSITION OR ENERGY EXPANSION?
3
     UNPACKING FAILURE:
WHERE NEOLIBERAL ENERGY
    POLICY WENT WRONG
T
his chapter takes a wider view of neoliberal energy and climate
policy, beginning by discussing the two main pillars of this policy
paradigms: carbon pricing and renewable investment incentives.
Both of these approaches are shown to have decisively failed: carbon pric-
ing schemes have been set by loopholes and the vast majority of global
emissions remain priced, while the growth of renewable energy lags sig-
nificantly behind growing global energy demand. The chapter then
moves on to discuss a range of converging challenges that threaten to
compound the crisis facing the renewables sector, resulting from the
contradictions and limitations of dominant market approaches.
NEOLIBERAL CLIMATE POLICY
Neoliberalism came to dominate economic thought and discourse (and
most national economies) following the election of Margaret Thatcher in
the UK in 1979 and Ronald Reagan in the US in 1980. Where neoliberalism
departs from the “laissez faire” approach of classical liberalism is in its
embrace of state-driven interventions aimed at constructing, enforcing
and managing markets, in order — among other things — to ensure
profitability to major private sector interests.
The United Nations Framework Convention on Climate Change (UN-
FCCC) was established in 1992 at the height of the “triumph of the mar-
ket”, following the collapse of the former Soviet Union and Eastern Eu-
rope. The three “Kyoto mechanisms” proposed to facilitate emissions re-
ductions bear the clear mark of neoliberal thinking: carbon trading
alongside two carbon offsetting schemes named the Clean Development
Mechanism (CDM) and Joint Implementation (JI).
Mainstream climate policies that have followed echo a core claim of
the broader project of neoliberalism: governments are neither competent
nor financially capable of tackling societal challenges and should instead
be put in service of guaranteeing the profitability of markets for private
interests. In relation to decarbonization, this means that governments
should aim to unlock private-sector innovation and capital.
This “green growth” vision of decarbonization and the energy transi-
tion informs the landmark 2006 Stern Review on the Economics of Climate
Change, lead-authored for the UK Government by former World Bank
economist Nicholas Stern.87 The Stern Review famously labelled climate
change “the greatest market failure ever seen” and insisted both that “sta-
bilisation of greenhouse gas concentration in the atmosphere is feasible
and consistent with continued growth,” and that the transition to a low-
carbon economy would “bring challenges for competitiveness but also
opportunities for growth.”
In his own terms, Stern adopted a “sticks and carrots” approach to cli-
mate policy.88 This relies on disincentivizing fossil fuels, while incentiv-
izing low-carbon energy technologies. This approach is analysed in fur-
ther detail below.
20 ENERGY TRANSITION OR ENERGY EXPANSION?STICKS AND CARROTS
CARBON PRICING
The main “stick” for mainstream policy has been carbon pricing, either
through carbon taxes or carbon trading. Carbon trading schemes are based
on pollution credits issued by governments and then traded through an ex-
change. The value of these credits increases over time as the space to pollute
created by the credits shrinks relative to emissions.
The flagship example of carbon pricing has been the EU’s “Emissions
Trading System” (ETS). Launched in 2005, the ETS has been plagued from
its inception by serious problems. In its early days, far too many permits
were issued, which kept prices low and left companies with no real incentive
to curb emissions. Permits were also allocated according to performance
“benchmarks”, designed by the very companies that were supposed to be
regulated and thus very weak. Power companies and energy intensive indus-
tries gained billions in windfall profits during the early years of the scheme
— profits that mostly turned into shareholder dividends, with little invested
in new clean energy infrastructure.89
After years of tinkering, the past two years have finally seen the price of
carbon on the EU ETS starting to rise.90 But the EU accounts for roughly 10%
of the world GHGs and the EU ETS covers roughly 40% of the EU’s economy,
or roughly 4% of the world’s GHGs. And the current EUR40 per ton price,
while still below the desired levels, stands in contrast to what is happening
globally.
Although it has been over 15 years since the 2005 launch of the EU ETS,
the vast majority of global emissions (84%) are still not priced (see Figure 6)
at all, and the share of emissions that are priced high enough to be poten-
tially effective remains well below 1%.
Figure 6: Global Carbon Pricing, 2019
Source: World Bank (2020) State and Trends of Carbon Pricing 2020, available at: https://openknowledge.
worldbank.org/handle/10986/33809.
UNPACKING FAILURE: WHERE NEOLIBERAL POLICY WENT WRONG 21Indeed, in 2018, the Global Commission on Economy and Climate
acknowledged that carbon prices “are still too low to have meaningful im-
pact”. They suggested that a global carbon price of USD 40-USD 80 per
ton was needed by 2020, rising to USD 50-USD 100 by 2030. 91 As of No-
vember 2020, however, only 9 gigatons of “CO2 equivalent” emissions
were covered by any carbon pricing scheme at all — equivalent to just 16
percent of global emissions.92 Roughly half of covered emissions are
priced at less than USD 10/tCO2e — a negligible amount — and less than
5 percent of covered emissions have a price within the range considered
effective. The IMF estimates that the global average carbon price is just
USD 2/tCO293 — a mere one-twentieth of the absolute minimum price con-
sidered necessary by 2020 in order for the policy to be working.
Large sections of business accept the need for carbon pricing — at
least in theory. In practice, however, individual corporations undermine
its application by demanding free pollution permits or, in the case of en-
ergy-intensive manufacturers, by threatening to close operations and re-
locate to less “carbon constrained” economies. Otherwise, they do their
utmost to politically defeat efforts to introduce a price in the first place.
In early 2015, BP’s Chief Economist, Spencer Dale, described how,
over the next twenty years, the use of oil and gas would grow 25 percent
and, therefore, climate goals could not be reached. Dale suggested that,
given this worrying situation, “Policy makers may wish to impose addi-
tional policies,” principal among them being a “meaningful global price
for carbon.”94 Three years later, in 2018, the same corporation spent $12
million dollars in an effort to defeat a ballot initiative in Washington
State that would have introduced a relatively modest pollution fee.95
INCENTIVIZING RENEWABLES
As the other key element of its “sticks and carrots” approach to driving
the transition, mainstream policy has relied on various subsidies and in-
centives aimed at encouraging investment in “low-carbon” technologies
— the “carrots.”
Over the past decade, deployment of new renewable generation ca-
pacity has been on an upward trajectory (see Figure 7). Net capacity ad-
ditions for wind and solar have outstripped those for coal and gas. From
2009 to 2019, solar added 638GW of capacity, while wind added 487GW.96
2020 saw the addition of another 107GW of net solar capacity and 65GW
of wind — roughly 172 GW together.97 Meanwhile, net coal capacity in-
creased by just 12.5 GW in 2020, while natural gas capacity grew by
roughly 40 GW.98 Since 2009, then, an additional 1297GW of wind and
solar capacity have been gained, almost 300GW more than the 1017.5GW
of coal and gas added.
When viewed in isolation, the growth of renewables has been impres-
sive. But growth alone does not mean the current investor-focused poli-
cies are succeeding in displacing fossil fuel energy (see Figure 8).
According to the United Nations Environment Programme (UNEP)
and Bloomberg New Energy Finance (BNEF):
22 ENERGY TRANSITION OR ENERGY EXPANSION?Even though there was a lot of solar and wind capacity installed in the lat-
est decade, its impact on the electricity mix has been gradual, not dra-
matic.99
And even after roughly two decades of these “gradual” gains, the share of
global electrical power generated during the first half of 2020 by wind and
solar capacity was just 10%.100 In 2016, global installed power capacity (from
all sources) stood at 6,473 GW and was growing at around 4% annually
(roughly 265 GW that year). By 2019, total installed power capacity had risen
to 7247 GW.101 In other words, the overall global power system has been
steadily expanding, by nearly 300 GW per year in recent years.
Figure 7: Annual net renewable capacity additions, 2000-2020
GW
Source: Original chart, based on IEA data.
WHY COMPARING “INSTALLED CAPACITY” IS MISLEADING
At first glance, these figures suggest that, although the contribution of wind
and solar is growing only slowly, they are winning the race with coal and gas
in terms of new capacity additions. When measured in this way, over the last
decade renewables were ahead of fossil-based power by a considerable mar-
gin (roughly 158 GW). If this trend continues, then the energy transition will,
it seems, happen eventually.
But how much electricity is actually generated by the different technolo-
gies? Any serious effort to answer this question can only lead to one conclu-
sion: in terms of actual generation, newly installed wind and solar is still
trailing behind the power generated by newly installed coal and gas. This is
because, over the course of a year, power stations using coal, gas, and nu-
clear energy generally produce far more electricity per GW of installed ca-
pacity than is typically produced by renewable sources. Coal, gas, and nu-
clear energy are not dependent on the weather. They can generate electricity
around the clock, 365 days a year (sometimes referred to as “24/365
power”).102
In other words, different sources of electrical power have varying “capac-
ity factors.” A “capacity factor” is the percentage of nameplate electricity that
is expected to be produced over the course of a year (or some other time pe-
riod) for a specific technology in a specific location. For example, a 5 MW
UNPACKING FAILURE: WHERE NEOLIBERAL POLICY WENT WRONG 23wind turbine situated in a wind corridor off the coast of Denmark might
produce at 40% of its “nameplate” capacity. If the wind blew hard and
constantly for “24/365” the capacity factor would be close to 100%. But be-
cause wind is highly variable, the capacity factor is going to be less than
the 100% maximum. The same is true in the case of solar. Solar panels
generate no electricity at night, limited electricity on cloudy days, and
more on long sunny days in summertime.
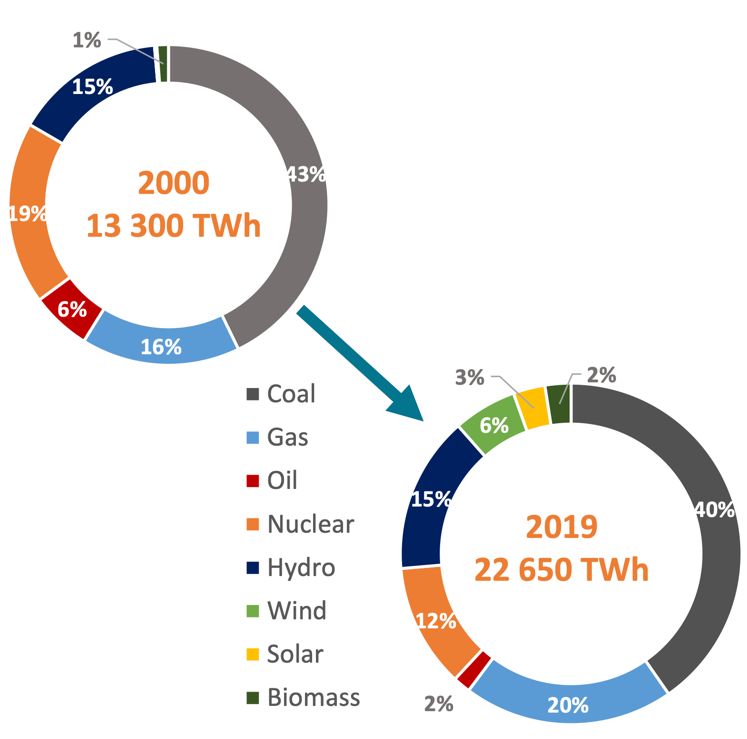
Figure 8: G20 Power Mix – 2000 vs 2019
Source: Enerdata (2020). Global Energy Trends 2020, available at https://www.enerdata.net/publica-
tions/reports-presentations/world-energy-trends.html.
It must be emphasized that capacity factors vary significantly and in
general vary much more substantially for renewable technologies than
for fossil fuel-based generation. This is because the amounts of wind and
solar available for capture and conversion to electricity vary by location,
whereas differences in fossil fuel types (for example, due to the thermal
quality of different grades of coal) are not linked in the same way to the
location of the generation assets.
Globally, the “capacity factor” of solar PV is in the 11-35% range. The
capacity factor for wind power is usually 20-40%, although some offshore
wind installations in the North Sea have an annual capacity factor above
40% for the newer and larger turbines.103 However, the capacity factor for
a new coal-fired power station can be as high as 80%, although even new
coal plants are seldom utilized at this level. The capacity factor for gas-
fired power is normally 50-60%, and nuclear at around 80%.
Based on crude averages, 1GW of new coal capacity (assuming a ca-
pacity factor of 60%, which is on the low end of the global average for coal-
fired power) will out-produce 1GW of wind (with a 30% capacity factor)
at a 2:1 ratio over the course of a year. And 1GW of new gas capacity (at a
50% capacity factor) will generate more power than 1GW of new solar (at
a 25% capacity factor) by a similar ratio.
24 ENERGY TRANSITION OR ENERGY EXPANSION?Capacity factors for both wind and solar are improving, so the next gen-
eration of solar and wind installations could be accompanied by considera-
bly higher capacity factors. But these improvements are likely to be incre-
mental (at current rates of improvement, roughly 1% annually for wind, and
0.5% annually for solar PV).
The point is this: as a general rule, in order to generate comparable
amounts of electricity in a given time period, far higher amounts of wind
and solar capacity must be installed than might be the case for coal or gas.
THE INVESTMENT DEFICIT IN RENEWABLES
The issue of “capacity factors” also drives home the importance of the short-
fall of investment in renewable generation.
Despite the commitment of huge amounts of public money to incentivize
private investment, there is growing concern that both renewable energy
and decarbonization more broadly are facing a serious and growing invest-
ment deficit. According to the IEA’s 2019 assessment:
There are few signs of the major shift of capital towards efficiency, renew-
ables and innovative technologies that is needed to turn emissions
around…. Investment and financing decisions are shaped by policies: to-
day’s frameworks are not yet equipped to avoid multiple risks for the fu-
ture.104
According to IRENA, investment in new renewable power generation ca-
pacity (mainly wind and solar) needs to total USD 22.5-trillion by 2050.105
That equates to around USD 662-billion each year, every year — roughly dou-
ble the levels of investment seen in recent years, which have averaged
around USD 300-billion.
Even more concerning, in their latest report, UNEP-BNEF note that in-
vestment commitments for the decade look “modest compared to the $2.7
trillion invested” during the past decade.106 According to the report, the com-
mitments will add an estimated 826GW of additional non-hydro renewable
power capacity — roughly one third less than the 1,213 GW installed in the
period 2010-2019.107
With overall demand for electricity still expanding, the growth in the
share of power being generated from wind and solar is still not sufficient to
reduce the volume of fossil fuels being burned. In other words, although the
growth of renewables is chipping away at the share of fossil fuels in the
power generation mix, it is not yet reducing their quantity — and even this
limited progress looks set to slow in the years ahead.
THE FALLING COSTS FALLACY
Despite the prevalence of claims around the “unstoppable” growth of renew-
ables, the evidence above suggests that investment and deployment are not
happening at anything approaching the scale or speed necessary.
However, according to one popular narrative, technological improve-
ments and economies of scale are driving down the costs of wind, solar and
storage technologies. For Bloomberg New Energy Finance, the experience of
Germany and the United Kingdom suggest that these cost reductions will
UNPACKING FAILURE: WHERE NEOLIBERAL POLICY WENT WRONG 25lead to a series of “tipping points,” as wind and solar become cheaper op-
tions than various incumbent generation technologies. Might falling
costs, then, result in the dramatic spike in renewables investment we
need? There are serious grounds to think not, as explained below.
QUESTIONING THE TIPPING POINT
Advocates of the “tipping point” view typically draw on a method of com-
paring costs among different generation technologies known as the “lev-
elized cost of electricity” (LCOE). LCOE is not a measure of what end us-
ers pay for electrical power. Rather, LCOE represents the cost per unit of
electricity associated with procuring and operating a power plant, over
an assumed lifetime for that plant. In theory, LCOE is supposed to pro-
vide a “neutral” or “objective” basis for comparing value for money across
all generation technologies.108
Box 1: Europe as a world leader in renewable energy?
Even in Europe, where “out of market” protections for private renewable
power companies have caused significant changes to electricity systems,
a serious shift from fossil fuels to renewables has not materialized.
For the EU, the share of fossil fuel generation (lignite, coal, gas and oil)
decreased from 53.6% in 2008 to 45.5% in 2018. During the same 11-year
period, the share of renewables (including wind, solar, hydro and bio-
mass) increased from 16.6% to 28.5%.109 The relatively fast growth of re-
newables in electricity generation helped establish Europe as the world
leader in renewable energy.
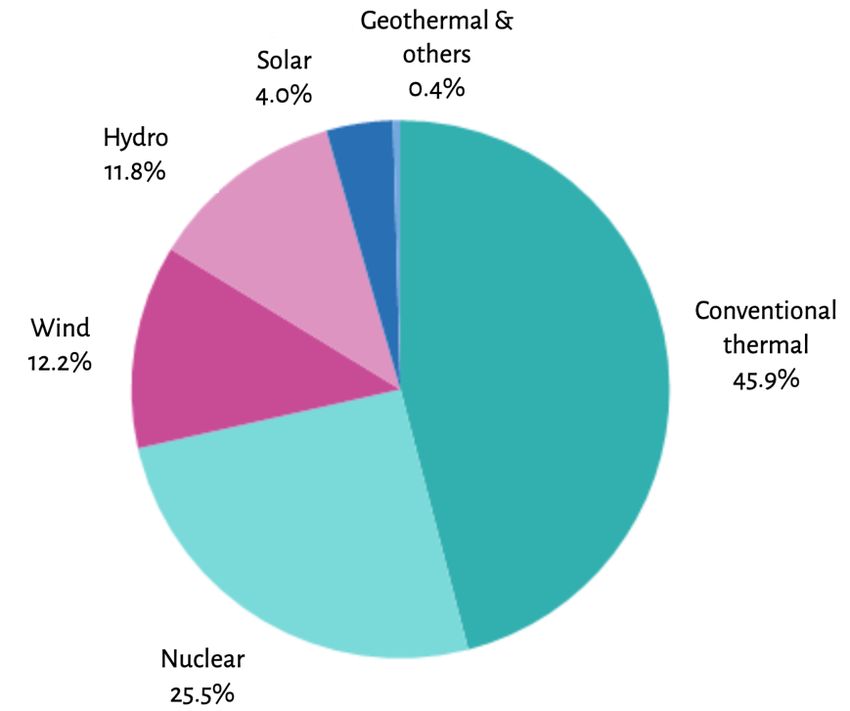
But as of 2019, wind and solar together still provided just over 17% of
the EU28’s electrical power.110 While this was well above world regional
averages, Europe’s power system is currently still largely dependent on
coal, gas and nuclear -- taken together, these sources supply nearly
three-quarters of the bloc’s electricity.111 Public hydroelectric systems
contribute an additional 12.2% -- such systems are considered “renewa-
ble power” but, in most instances, they were built decades ago, and have
relatively little scope for expansion.
The IEA observed in mid-2020 that the EU was “not yet on track” to-
wards achieving its targeted increase of the renewables share in power
generation to 32% (which was at just 18% in 2018), nor of energy effi-
ciency gains of 32.5% by 2030. As the IEA states:
Today’s 2030 targets will require a significant system transformation,
even more so with the announced enhanced targets under the EGD [i.e.,
the European Green Deal].112
Globally, the average LCOE of power generated by solar photovoltaics
(PV) dropped 88% between 2009 and 2019, while the figure for wind fell
69%.113 Figures such as these are often cited to support the claim that
building wind and solar PV capacity is now cheaper than new (and pos-
sibly even existing) coal capacity.114
There are, however, significant problems with this “tipping point” ar-
gument. LCOE ignores crucial differences between electricity and other
energy sources. Unlike most other economic goods, electricity cannot
26 ENERGY TRANSITION OR ENERGY EXPANSION?simply be “stored” in a warehouse or transported on trucks or ships. Elec-
tricity must either be used to do work (to power a refrigerator, a bus or what-
ever else) or converted into another form of energy (chemical, potential, ki-
netic, etc.) in the same instant in which it is generated.
Figure 9: Electricity production by source, EU28, 2018 (%)
Source: Eurostat (2018), available at: https://ec.europa.eu/eurostat/statistics-explained/index.php?ti-
tle=File:Electricity_production_by_source,_EU-28,_2018_(%25).png.
Because of these physical constraints, it matters exactly when, where and
how electricity is generated and supplied to the grid. Whatever other differ-
ences there might be among different kinds of electricity sources (including
price differences), the “variable renewable energy” (VRE) supplied by a wind
or solar farm is not a perfect substitute for the comparatively constant (and
controllable) electricity supplied by a coal, gas or nuclear plant (sometimes
called “baseload” or “firm” power). The price of electricity generated from
variable renewable energy sources fluctuates dramatically in ways that
LCOE fails to capture. As such, LCOE makes for a biased and inaccurate unit
for comparing the costs of renewables and fossil fuels – the “tipping point”
argument ends up exaggerating the declining costs of solar and wind.115
PROFITABILITY CRISIS
Typically, the main driver of renewables cost reductions has been the intro-
duction of competitive, auction-based systems, usually following a period of
often quite generous public subsidies. But this shift to competition has pro-
duced a similar set of outcomes in country after country: a loss of investor
interest and stalling growth in deployment.
Endeavours to incentivise renewables in Europe – echoed by similar ef-
forts in other contexts – initially took the form of a system of Feed-in Tariffs
(FiTs). FiTs are a guaranteed subsidy, paid to anyone who can install renew-
able generation capacity and feed power into the grid. This system led to a
dramatic rise in deployment of new generation capacity — so dramatic, in
UNPACKING FAILURE: WHERE NEOLIBERAL POLICY WENT WRONG 27You can also read