Attractions Industry Outlook for 2021 - COVID-19 Recovery Preparedness Research - CT.gov

Page created by Derek Mccoy
 
CONTINUE READING
Attractions Industry Outlook for 2021 - COVID-19 Recovery Preparedness Research - CT.gov
Attractions      Industry
        BRANSON, MISSOURI
            Outlook
COVID-19 Recovery         for 2021
                    Preparedness    Research
                Update
               Prepared August 2020

H2R MARKET RESEARCH | BRANSON LAKES CONVENTION & VISITORS BUREAU
      JERRY HENRY & ASHLEY GAROUTTE   ●   H2R MARKET RESEARCH
Attractions Industry Outlook for 2021 - COVID-19 Recovery Preparedness Research - CT.gov
Research consultancy that specializes in
          travel and tourism.
Attractions Industry Outlook for 2021 - COVID-19 Recovery Preparedness Research - CT.gov
COT Market Research Investments
Attractions Industry Outlook for 2021 - COVID-19 Recovery Preparedness Research - CT.gov
HOPE
Attractions Industry Outlook for 2021 - COVID-19 Recovery Preparedness Research - CT.gov
Northeast Consumers
                   Vaccination Update

Vaccine News is
Encouraging.
Attractions Industry Outlook for 2021 - COVID-19 Recovery Preparedness Research - CT.gov
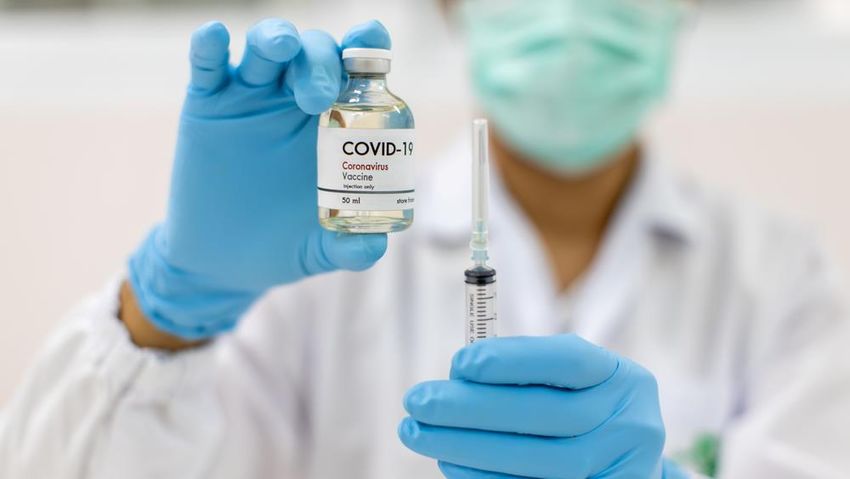
A significant acceleration in vaccinations has contributed to
the positive momentum in consumers’ attitudes toward dining
   out, seeing live performances and attending indoor events.

         Percent of Population Needing Vaccine to Feel Comfortable
                              % Already Comfortable
Attractions Industry Outlook for 2021 - COVID-19 Recovery Preparedness Research - CT.gov
Pent-up demand is sizable. Unconverted intent (ratio of unfulfilled
intentions) increased significantly from 46% in 2019 to 65% in 2020.
Highest among Theme Parks, Water Parks and Aquariums.
                                                                       Unconverted Intent by Attraction Sector
                                                                  Theme Parks                                                             37%

                                                                   Water Parks                                                      29%
           Unconverted Intent
                                                                    Aquariums                                                      28%

                                                              History Museums                                                      28%

                                                                      Theaters                                                     28%

                                                                          Zoos                                               26%

                                                                  Art Museums                                          23%
                           35%                             Children's Museums                                    21%

                                 Converted Intent                           FEC                             20%

                                 Unconverted Intent          History Landmarks                             19%

                                                             Sightseeing Tours                             19%

                                                            Botanical Gardens                        16%

                                                          Brewery/Winery Tours                 14%
     65%
                                                               Dinner Theaters                 13%

                                                      Large-Format Screen Thrs                 13%

                                                              Science Centers                 13%

                                                                    Old Homes                 13%

                                                                   Art Galleries              13%

                                                           National/State Parks          5%

                                                              Natural Wonders      -2%
Attractions Industry Outlook for 2021 - COVID-19 Recovery Preparedness Research - CT.gov
The intent to participate in leisure activities over the next several
months also continues to surge upward each month as we head into
summer.
        % Probably/Definitely Will Visit Restaurants, Hotels, Attractions, Events or Travel
                               for Leisure in the Next 6 Months
Attractions Industry Outlook for 2021 - COVID-19 Recovery Preparedness Research - CT.gov
Furthermore, more than three-quarters of consumers plan to engage in
significantly more travel and entertainment activities this year than
they did last year.
        % Will Engage in Travel & Entertainment Activities Somewhat or Much More in
                                   2021 compared to 2020
Attractions Industry Outlook for 2021 - COVID-19 Recovery Preparedness Research - CT.gov
Intent to visit outdoor attractions still out-paces intent to visit indoor,
but all attractions are seeing similar intent to visit scores for the
summer.
           % Probably/Definitely Will Visit Each of the Following Attraction Types
Wise to Optimize
   for 2021
Recovery will not likely be
a binary event.
RISK TOLERANCE
Know how COVID-19
changed your target market
✓
✓
✓
✓
✓
✓
✓

                                               Key Insight
                             Don’t just know your customer will be different—change
                             your marketing and messaging tactics to reach these
                             consumers so they will choose you when they begin to
                                                      travel.
Actions That Would Increase
Intent to Visit Attractions

As of March, consumers still want to know that
the staff at attractions they are visiting are
being vaccinated. This, along with socially
distanced outdoor events are the actions most
favorably looked upon when deciding to visit an
attraction.
Travelers expect their next leisure trip to occur in about 7 months
  (late June). However, those who visited Children’s Museums,
  Science Centers and Dinner Theaters plan to travel much sooner.
                                                                                       Average Time to Next Trip by Attraction (Months)
                                                                                      Children's Museum(s)                          4.6
      Timing of Next Leisure Trip (Months)                           Science Center(s)/Science Attraction(s)                              5.2
                                                                                    Dinner Theaters/Cruises                               5.2
                                                                                              Water Park(s)                                5.3
       9%         12%                                                         Large-Format Screen Theaters                                  5.4
                                                                                     Old homes/Mansion(s)                                   5.5
                               Within the next 30 days (Dec 2020)        Theme Park(s)/Amusement Park(s)                                    5.5
                                                                             Family Entertainment Center(s)                                      5.7
                               Within the next 3 months (Feb 2021)
26%                     20%                                                           Brewery/Winery Tours                                       5.8
                               Within the next 6 months (May 2021)                              Art Galleries                                     5.9
                                                                                         Sightseeing Tour(s)                                       6.0
                               Within the next 12 months (Nov 2021)                            Aquarium(s)                                         6.0
                                                                                        Botanical Garden(s)                                            6.1
                               12+ months (Dec 2021 or later)
                                                                                             Art Museum(s)                                             6.1
                                                                                           Natural Wonders                                             6.2
            33%                                                                       National/State Park(s)                                            6.2
                                                                                         History Museum(s)                                              6.2
                                                                                 Zoo(s)/Animal Attraction(s)                                                 6.5
                                                                                  Historic Landmarks/Places                                                   6.7
                                                                                                 Theater(s)                                                        7.0
Cautiously
Optimistic
Outlook for
2021
Relative to 2019, quarterly
expectations for domestic
person-trips are expected to
steadily improve until we
reach 2019 levels in Q2 of
2022.

For total trips, including
international, it will be Q4
of 2022.
U.S. Hotel Room Demand is expected to take a bit longer to return to
2019 levels. In 2021, returning to 75.8% and in 2022 to 94.9%.
THANK YOU

GET IN TOUCH
WITH US
You can also read