AUGUST 2021 - IIFL Mutual Funds
←
→
Page content transcription
If your browser does not render page correctly, please read the page content below

AUGUST 2021

MONTHLY MARKET UPDATE

 Macro Economy & Event Update

 •      Global equity markets witnessed a mixed performance during          Event Update
        the period under review. Equity markets in U.S. and Europe          India’s retail inflation slowed to 6.26% in Jun 2021
        rose after the central banks at the respective regions              •   Government data showed that the Consumer Price Index based
        maintained an accommodative stance on the monetary policy.              inflation (CPI) slowed to 6.26% in Jun 2021 from 6.30% in May
        However, market sentiment remained subdued in Asia amid                 2021. Inflation, based on CPI, has breached the RBI's target range
        concerns over regulatory fusillade in China against everything
                                                                                for the second consecutive month in Jun. The Consumer Food
        starting from internet technology firms to education and real
                                                                                Price Index also rose to 5.15% in Jun 2021 from 5.01% in the
        estate sector thus wiping out billions of dollars from stocks
        listed in China and Hong Kong. Persisting concerns over COVID-          previous month. CPI inflation for oils and fats stood at 34.78% in
        19 pandemic also added to the losses.                                   Jun as against 30.84% in May. CPI inflation in fuel and light rose
                                                                                12.68% in Jun as against 11.58% in the previous month.
 •      U.S. equity markets rose during the period under review as          India’s Index of Industrial Production (IIP) witnessed a
        upbeat corporate earning numbers for the quarter ended Jun          growth of 29.3% in May 2021
        2021 indicated recovery from the doldrums of the COVID-19           •   Government data showed that the Index of Industrial Production
        crisis. Market participants also grew optimistic after the U.S.         (IIP) witnessed a growth of 29.3% in May 2021 as compared to
        Federal Reserve kept interest rates on hold and added that              growth of 134.6% in the previous month and a contraction of
        more progress needed to me made on the employment before
                                                                                33.4% in the same period of the previous year. The manufacturing
        it considers normalization of monetary policy through rate
                                                                                sector witnessed a growth of 34.5% in May 2021 as compared to
        hikes and tightening of its bond purchase program.
                                                                                a contraction of 37.8% in the same period of the previous year.
 •      European equity markets too moved north after the European              The mining sector grew 23.3% in May 2021 as compared to a
        Central Bank kept its monetary policy unchanged and pledged             contraction of 20.4% in the same period of the previous year and
        to maintain a “persistently accommodative” stance until its             the electricity sector witnessed a growth of 7.5% in May 2021 as
        inflation target is met consistently. Upbeat quarterly earning          compared to a contraction of 14.9% in May 2020.India's
        numbers too added to the gains.                                         Consumer Price Index based inflation (CPI) rose to 6.30% in May
                                                                                2021
 •      In Asia, the continued crackdown by the Chinse government on        India’s trade deficit widened to $9.37 billion in Jun 2021
        big tech giants, real estate and education sector wreaked havoc     •   Government data showed that India’s trade deficit widened to
        on the market sentiment.                                                $9.37 billion in Jun 2021 from a surplus of $0.79 billion in Jun
                                                                                2020. Exports grew 48.34% on a yearly basis to $32.5 billion in
 •      Back home, domestic equity markets managed to eke out some              Jun 2021 from $21.91 billion in the same period of the previous
        gains after witnessing considerable volatility during the month
                                                                                year. Imports rose 98.31% over the year to $41.87 billion in Jun
        under review. Domestic equity markets remained under
                                                                                2021 from $21.11 billion in the same period of the previous year.
        pressure as market participants apprehended the possibility of
                                                                                Oil imports in Jun 2021 stood at $10.68 billion which was higher
        a third wave of the COVID-19 pandemic which may result in
        renewed lockdowns and restrictions. However, losses were                by 116.51% in dollar terms compared to Jun 2020. Non-oil
        made good after the U.S. Federal Reserve kept interest rates on         imports were estimated at $31.20 billion in Jun 2021 which was
        hold and pledged to keep it as it is for an elongated period of         92.77% higher in dollar terms compared to the same period of the
        time till the time it sees satisfactory improvement on the              previous yearIndia’s trade deficit widened to $6.28 billion in May
        employment front.                                                       2021 from May 2020
                                                                            Fiscal deficit from Apr to Jun of 2021 at 18.2% of the budget
 •      In the domestic debt market, bond yields rose for the second        estimate for FY22
        consecutive month after the Reserve Bank of India (RBI) sold        •   India’s fiscal deficit for the period from Apr to Jun of 2021 came in
        the much-awaited new 10-year bond at a higher-than-expected
                                                                                at Rs. 2.74 lakh crore or 18.2% of the budget estimate for FY22 as
        yield of 6.10%. Higher global crude oil prices also weighed on
                                                                                compared to 83.2% in the corresponding period of the previous
        the market sentiment.
                                                                                year. Revenue deficit came in at Rs. 1.70 lakh crore or 14.9% of the
 •      Moving ahead, the developments surrounding the COVID-19                 budget estimate for FY22 as compared to 94.8% of the budget
        crisis will remain in sharp focus. The COVID-19 vaccination has         estimate in the corresponding period of the previous year. Total
        picked up pace and sooner the country is able to vaccinate its          receipts stood at Rs. 5.47 lakh crore or 27.7% of the budget
        entire population, the better it is for the growth prospects for        estimate for FY22 as compared to 6.8% of the budget estimate in
        the Indian economy. Retail inflation will also be closely watched       the corresponding period of the previous year. Total expenditure
        as an increase in retail inflation may nudge the monetary policy        stood at Rs. 8.22 lakh crore or 23.6% of the budget estimate for
        committee to change their accommodative stance on the                   FY22 as compared to 26.8% of the budget estimate in the
        monetary policy.                                                        corresponding period of the previous year.
                                                                            India’s Index of eight core industries rose 8.9% YoY in Jun
     Key Economic Indicators
                                                                            2021
     Indicators                               Current        Previous
                                                                            Index of eight core industries rose 8.9% YoY in Jun 2021 as against
     WPI (Jun-21)                             12.07%          12.94%
     IIP (May-21)                             29.30%         134.60%        growth of 16.3% in May 2021 and a contraction of 12.4% in Jun 2020.
     CPI (Jun-21)                              6.26%          6.30%         The steel sector witnessed growth of 25% in Jun followed by natural
     Source: Refinitiv                                                      gas sector and coal that grew 20.6% and 7.4% respectively. Only crude
                                                                            oil sector witnessed a contraction of 1.8% in Jun.

August 2021                    Mutual Fund investments are subject to market risks, read all scheme related documents carefully.              Page | 1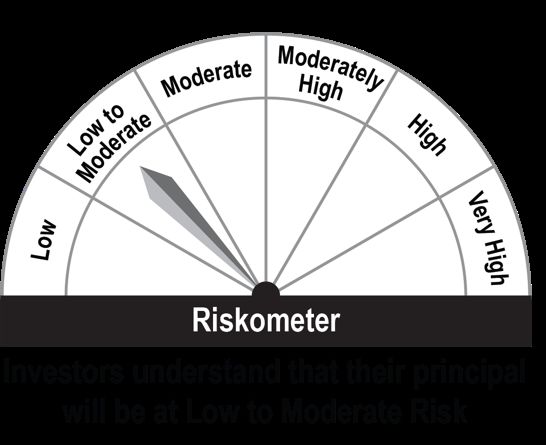
MONTHLY MARKET UPDATE
Equity Market
• Indian equity markets eked out small gains after witnessing Domestic Indices Performance
considerable volatility during the month. Initial positive vibes Indicators 30-Jul-21 30-Jun-21 Chg. % YTD
generated from decline in COVID-19 cases in India, coupled with
easing of curbs and surge in vaccination, was largely erased by S&P BSE Sensex 52,587 52,483 0.20 10.13
outbreak of highly contagious Delta variant coronavirus. Mixed Nifty 50 15,763 15,722 0.26 12.74
global cues too restricted gains as dovish comments from U.S. Fed S&P BSE 200 6,879 6,824 0.81 16.45
Chief in the latest FOMC meeting was neutralized by recent
crackdown by Chinese government on education, property, and Nifty Midcap 100 27,815 26,971 3.13 33.45
tech sectors. Weak economic growth outlook too downplayed Nifty Dividend
3,403 3,346 1.71 19.09
market sentiments. Opportunities 50
S&P BSE Small cap 26,787 25,232 6.16 48.01
• On the BSE sectoral front, S&P BSE Realty was the top gainer, up Source: Refinitiv
16.12%, followed by S&P BSE Metal and S&P BSE Capital Goods Global Indices Performance
which rose 12.57% and 3.15% respectively. Realty stock surged 30-Jun-
as the second wave of the COVID-19 pandemic and the Global Indices 30-Jul-21 Chg. % YTD
21
continuance of Work-From-Home (WFH) policies ensured a rise Dow Jones 34,935 34,503 1.25 14.14
in demand as home buyers are looking to upgrade for the need of FTSE 7,032 7,037 -0.07 8.85
an extra room to suit the requirement of home-office. Metal sector CAC 6,613 6,508 1.61 19.12
surged amid earnings announcements and improved business
Hang Seng 25,961 28,828 -9.94 -4.66
outlook for the sector. According to media reports, China is
Shanghai 3,397 3,591 -5.40 -2.18
considering imposing more restrictions on steel products and
raise export tariffs, which is expected to help Indian steelmakers Source: Refinitiv
gain in terms of market share and profits. The Chinese
government recently announced imposing a tax on steel exports Sectoral Performance (Monthly Returns %)
to cool export, and domestic steel prices. Se
S&P BSE Auto -5.40%
• U.S. markets edged up with investors reacting to upbeat earnings S&P BSE Power -5.04%
reports from some prominent European and U.S. companies. S&P BSE Oil & Gas -4.54%
Investors also took positive cues from the U.S. Federal Reserve S&P BSE PSU -0.44%
Monetary Policy Review where the U.S. central bank kept interest
S&P BSE Bankex -0.41%
rates on hold. Nonetheless, gains were largely restricted by
S&P BSE FMCG -0.27%
increased concerns over the delta variant of COVID-19 which kept
investors wary S&P BSE Teck 1.90%
S&P BSE Healthcare 2.22%
• European markets closed in the green, following dovish S&P BSE CD 2.28%
comments from the European Central Bank, and some S&P BSE IT 2.36%
encouraging earnings announcements. The U.S. Fed meeting also S&P BSE CG 3.15%
contributed to the gains. However, gains were capped amid S&P BSE Metal 12.57%
worries over tensions between China and Britain following S&P BSE Realty 16.12%
reports that the British government is considering removing a Source: Refintiv
China's state-owned nuclear energy company from all future ctoral Performance (Monthly returns %)
Source: Refintiv
power projects in the U.K.
Nifty EPS
• Asian equity markets closed in red amid concerns over COVID-19
delta variant breakout fears. The persisting anxiety and concerns 700 619
over the resilience of the economic recovery also impacted 600
482 447
investor sentiment across the region. Markets were dragged by 500 404 387 378 416 407 390
concerns over China's crackdowns on industries from tech to real 400 320 345 355
284
300 244 257
estate and education firms which overshadowed optimism over
200
economic and earnings growth. 100
0
• Domestic equity market continued to take support from ongoing
FY08
FY09
FY10
FY11
FY12
FY13
FY14
FY15
FY16
FY17
FY18
FY19
FY20
FY21
FY22
corporate earnings season. This has helped the market to
withstand headwinds of a possible third COVID wave, commodity
led inflation and volatility around the U.S. Fed taper talk. Institutional Flows (Equity) As on July 30, 2021
Meanwhile, the recent crackdown by Chinese government on
(INR Cr) Purchases Sales Net YTD
education industry pose opportunity in disguise for India. After
the restriction, investors who have put money into China's edu- FII Flows 132,481 143,790 -11,308 49,034
tech sector may see India as a land of opportunities in this sector MF Flows 84,824 69,387 15,437 3,311
and may have added advantages for Indian edu-tech startups. DII Flows 131,002 109,547 21,455 13,796
Besides, the direction of foreign fund flows, will also impact Source: NSDL, NSE & SEBI
investors' sentiments.
* As on July 29, 2021
August 2021 Mutual Fund investments are subject to market risks, read all scheme related documents carefully. Page | 2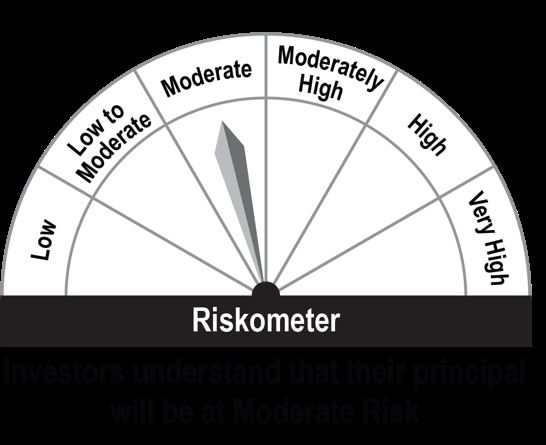
MONTHLY MARKET UPDATE

 Debt Market

 •   Bond prices for the benchmark fell over the month as eventually         10-Year Benchmark Bond (06.10% GS 2031) Movement
     RBI gave-up the obsession of holding 10-year benchmark yield by
                                                                                            6.25
     giving in 15 bps in the new 10-year benchmark paper while other
     maturity benchmarks yields edged higher in a small range for the

                                                                               Yield ( %)
     close of the month. The new 10-year benchmark closed the month
     at 6.20% before getting auctioned at 6.10 in the first auction                         6.10
     round. Bond investor traded on slide lines for the month due to
     lack of major triggers apart from range-bound bond prices
     reacting to U.S yields and crude oil movements.
                                                                                 5.95
 •   Banking and system liquidity increased from last month’s average               30-Jun-21                     10-Jul-21          20-Jul-21               30-Jul-21
     (Bloomberg Indian banking liquidity Index) 5.60 to 6.60 lakh crore       Source: Refinitiv
     pushing money market rates lower by 5-8 bps during the month.
     Corporate bonds outperformed gilts specially the 3-5-year               Spread Movement
     segment by 5 bps while the SDLs kept trading at attractive spreads
                                                                              Spreads                  Maturity                         AAA          AA            A
     vis-vis AAA corporate bonds across the yield curve due to fear of                                  Period
     heavy supply. The uneven structure of the curve (G-sec & SDLs)           30-Jul-21                    1 Yr                          51          211          1657
     could persist unless there are more evenly distributed
     interventions, across the curve, through G-SAP, OMOs, Operation                                       3 Yr                          71          234           74
     Twists by the central bank.                                                                           5 Yr                          60          196           --
                                                                              30-Jun-21                    1 Yr                          70          188          2317
 •   RBI revised the Q2FY22 indicative budgeted SDL borrowing
     calendar upwards by ~13% to ~INR 1.92tn from ~INR1.70tn                                               3 Yr                          35          238          -92
     announced earlier. The market borrowings of the state                                                 5 Yr                          48          270           --
     governments so far in FY22 has been 10% less than that in the            Source: Refinitiv
     comparable period of FY21 this is reflective of the lower
     expenditure being undertaken by states relative to their receipts.
                                                                              Yield (%)                                                  30-Jul-21         30-Jun-21
     With the second wave of the pandemic affecting the revenues of
     states since the onset of the current financial year, many states        10 Year G-Sec                                                6.20                  6.05
     have been curtailing their non-essential/ developmental                  5 Year G-Sec                                                 5.73                  5.72
     expenditure. With vaccination drive getting stronger and growth          Certificate of Deposit
     returning, revenues generation and closure of big-ticket dis-
                                                                              3-Month                                                      3.41                  3.45
     investments are likely to give fiscal concerns a respite thereby
     bond supportive.                                                         6-Month                                                      3.70                  3.62
                                                                              9-Month                                                      3.88                  3.91
 Currency and Commodity
                                                                              12-Month                                                     4.02                  3.83

 •   The Indian rupee fell marginally following worries over slowdown         Commercial Papers
     in the pace of economic recovery and concerns over the rapid             3-Month                                                      3.70                  3.62
     spread of the delta coronavirus variant in the Asian region.             6-Month                                                      3.95                  4.00
     However, losses were restricted on hopes that the U.S. Federal
     Reserve will maintain an accommodative stance on its monetary            12-Month                                                     4.40                  4.50
                                                                              Source: Refinitiv
     policy for a longer period of time.

 •   Brent crude prices fell amid speculation that a negotiation deal         Treasury Bill                                             30-Jul-21          30-Jun-21
     between leading OPEC producers will inject a sharp increase of oil       91 Days                                                      3.38                  3.41
     supply into an extremely tight market. Oil prices were further hit
     by weak demand outlook as the COVID-19 curve is on rise after            364Days                                                      3.66                  3.85
     months of decline trend. Some countries are tightening the               Source: Refinitiv

     restrictions as the delta variant is spreading fast across the globe.
                                                                             Event Calendar
                                                                              Release              Event                                                  Country
                                                                              5-Aug-21             Bank of England Monetary Policy                        U.K.
                                                                              6-Aug-21             Nonfarm Payrolls (Jul)                                 U.S.
                                                                              12-Aug-21            Gross Domestic Product (QoQ)(Q2) PREL                  U.K.
                                                                              18-Aug-21            FOMC Minutes                                           U.S.
                                                                              26-Aug-21            Durable Goods Orders (Jul)                             U.S.
                                                                              Source: FXSTREET, Daily FX

August 2021                 Mutual Fund investments are subject to market risks, read all scheme related documents carefully.                                     Page | 3
IIFL FOCUSED EQUITY FUND
(An open ended equity scheme investing in maximum 30 multicap stocks)
Investment Objective Portfolio as on July 31, 2021 Sector Allocation^^
The investment objective of the scheme is to % to Net
Company Name Sector SCDV
Assets
generate long term capital appreciation for Equity & Equity Related Total
investors from a portfolio of equity and equity ICICI Bank Limited FINANCIAL SERVICES C 9.42%
related securities. However there can be no Infosys Limited IT D 6.92%
assurance or guarantee that the investment Axis Bank Limited FINANCIAL SERVICES S 4.96%
objective of the scheme would be achieved. Larsen & Toubro Limited CONSTRUCTION C 4.72%
Crompton Greaves Consumer
CONSUMER GOODS S 4.15%
Electricals Limited
Fund Manager Mr. Mayur Patel
HDFC Bank Limited FINANCIAL SERVICES S 4.02%
Mr. Mayur Patel has 14 years of work experience CONSUMER
Zomato Limited V 3.95%
including investment management and research SERVICES
experience of more than 10 years. Prior to joining State Bank of India FINANCIAL SERVICES V 3.86%
Bharti Airtel Limited TELECOM V 3.74% Sector allocation as per AMFI classification
^^
IIFL, he managed equity portfolios of DSP
BlackRock Equity Savings Fund and MIP Fund at INDUSTRIAL
SRF Limited
MANUFACTURING
S 3.70% Market Capitalisation wise Exposure^
DSP BlackRock Investment Managers (a joint
Bajaj Finance Limited FINANCIAL SERVICES S 3.50%
venture between BlackRock and the DSP Group in Divi's Laboratories Limited PHARMA D 3.28%
India). Mr. Patel joined DSP BlackRock in 2013 as Cyient Limited IT S 3.28%
an Equity Analyst responsible for origination and Apollo Tricoat Tubes Limited Miscellaneous S 3.25%
dissemination of ideas across energy, industrials Larsen & Toubro Infotech
IT S 3.22%
and utilities sectors. Earlier he was associated Limited
with Spark Capital as Lead Analyst, Energy in their Bharat Petroleum Corporation
OIL & GAS D 3.13%
Institutional Equities division and has also Limited
worked with Tata Motors and CRISIL. He is a Mahindra & Mahindra Limited AUTOMOBILE V 3.01%
Sona BLW Precision Forgings a. Large Cap Companies: 1st -100th company in terms of full market capitalization
Chartered Accountant and a CFA charter holder. AUTOMOBILE S 2.58% b. Mid Cap Companies: 101st -250th company in terms of full market capitalization
Limited c. Small Cap Companies : 251st company onwards in terms of full market capitalization The
Dr. Reddy's Laboratories consolidated list of stocks in terms of full market capitalization is as per the list uploaded by AMFI, in
PHARMA S 2.41%
Limited terms of SEBI circulars dated October 6, 2017 and December 4, 2017.
Fund Details CCL Products (India) Limited CONSUMER GOODS D 2.32% ^
As of July 31, 2021
Date of Allotment : October 30, 2014 Muthoot Finance Limited FINANCIAL SERVICES S 2.12%
Bloomberg Code : IIFGRRG IN Tata Communications Limited TELECOM V 1.97% NAV Movement (Since Inception) Rebased to 100
Mahanagar Gas Limited OIL & GAS D 1.95%
Benchmark Index : S&P BSE 200 TRI
Tata Motors Limited AUTOMOBILE C 1.84%
Plans Offered : Regular & Direct Aavas Financiers Limited FINANCIAL SERVICES S 1.83%
Options Offered : Growth & IDCW Asian Paints Limited CONSUMER GOODS D 1.59%
Minimum : Kajaria Ceramics Limited CONSTRUCTION S 1.54%
Application ICICI Lombard General
FINANCIAL SERVICES D 1.45%
New Purchase : ₹5,000 and in Insurance Company Limited
multiples of ₹100 INDUSTRIAL
EPL Limited V 1.18%
thereafter MANUFACTURING
Additional : ₹1,000 and in Procter & Gamble Health
PHARMA D 1.08%
Limited
Purchase multiples of ₹100
Sub Total 95.97
thereafter
TREPS## 3.88
Monthly SIP Option : ₹1,000 per month for a Net Receivables / (Payables) 0.15
minimum period of 6 Portfolio Total 100
months
Quarterly SIP : ₹1,500 per quarter for
Option a minimum period of 4 Scheme Performance
quarters 31-Jul-20 to 31-Jul-18 to 31-Jul-16 to Since
Scheme / Benchmark PTP (₹) PTP (₹) PTP (₹) PTP (₹)
Entry Load : NIL 31-Jul-21 31-Jul-21 31-Jul-21 Inception
Exit Load : 1% - if IIFL Focused Equity Fund - Reg - Growth 59.71% 15971 23.05% 18632 17.67% 22577 16.36% 27821
redeemed/switched IIFL Focused Equity Fund - Dir - Growth 61.55% 16155 24.74% 19412 19.24% 24126 17.84% 30297
out, on or before 12 Benchmark* 49.60% 14960 13.60% 14661 14.66% 19836 12.76% 22501
months from the date Additional Benchmark** 41.41% 14141 13.14% 14484 14.73% 19896 11.58% 20955
Past performance may or may not be sustained in future. Different plans shall have different expense structure. Point to Point (PTP) returns in ₹ is based on standard investment of ₹10,000; Since
of allotment w.e.f April Inception date is 30 October 2014; *S&P BSE 200 TRI; **S&P BSE Sensex TRI; Managed by the fund manager since 11 November 2019. The performance of the scheme is benchmarked to the
02, 2019. Total Return variant of the Index.
Dematerialization : D-Mat Option Available
Portfolio Turnover : 0.40 times
Ratio (based on 1
SIP - If you had invested ₹10,000 every month
year monthly data) 31-Jul-20 to 31-Jul-18 to 31-Jul-16 to Since
Scheme / Benchmark
31-Jul-21 31-Jul-21 31-Jul-21 Inception
Total Amount Invested (₹) 1,20,000 3,60,000 6,00,000 8,00,000
Total Value as on July 31, 2021(₹) 1,54,613 5,79,470 10,65,564 15,86,800
NAV as on July 31, 2021 Returns 58.08% 33.59% 23.21% 20.28%
Regular - Growth : ₹ 27.8214 Total Value of Benchmark: S&P BSE 200 TRI (₹) 1,46,789 5,13,117 9,31,394 13,65,226
Regular - IDCW : ₹ 24.6142 Benchmark: S&P BSE 200 TRI 44.28% 24.49% 17.65% 15.81%
Direct - Growth : ₹ 30.2967 Total Value of Benchmark: S&P BSE Sensex TRI (₹) 1,41,239 4,92,424 9,20,500 13,42,844
Direct - IDCW : ₹ 29.9874 Additional Benchmark: S&P BSE Sensex TRI 34.71% 21.50% 17.17% 15.32%
(Inception date :30-Oct-2014) (First Installment date :01-Dec-2014)
Source: MFI Explorer; Above returns are calculated assuming investment of ₹10,000/- on the 1st working day of every month. CAGR return are computed after accounting for the cash flow by
using XIRR method (investment internal rate of return) for Regular Plan -Growth option. The above investment simulation is for illustrative purposes only and should not be construed as a
AUM as on July 31, 2021 promise on minimum returns and safeguard of capital. Managed by the fund manager since November 11, 2019.
The performance of the scheme is benchmarked to the Total Return variant of the Index.
Net AUM : ₹ 2136.79 crore
Monthly Average : ₹ 2048.21 crore Dividend Details
AUM Cum Dividend NAV (₹) As
Record Date Face Value (₹) Dividend Per Unit
on Feb 15, 2017
Regular IDCW Plan 15 February 2017 10 12.7777 1.50
Total Expense Ratio Direct IDCW Plan 15 February 2017 10 13.0738 0.17
Dividend is gross dividend. Past performance may or may not be sustained in future. After payment of dividend the NAV has fallen to the extent of payout and distribution taxes if applicable.
Regular Plan : 2.04% p.a. Dividend is not assured and is subject to availability of distributable surplus.
Direct Plan : 0.90% p.a. Risk-O-Meter
Total Expense Ratio is as on the last business day of the month.
THIS PRODUCT IS SUITABLE FOR INVESTORS WHO ARE SEEKING*
Volatility Measures • Capital appreciation over long term;
Fund Benchmark • Investment predominantly in equity and equity related instruments.
Std. Dev * Investors should consult their financial advisers if in doubt about whether the product is suitable for them.
17.57% 17.46%
(Annualised) ##With effect from November 05, 2018, Triparty Repo has replaced CBLOs for all schemes with provisions to invest
Sharpe Ratio 0.77 0.54 in CBLO.
Portfolio Beta 0.94 1.00
R Squared 0.95 NA
Treynor 0.16 0.10
August 2021 Mutual Fund investments are subject to market risks, read all scheme related documents carefully. Page | 4
IIFL FOCUSED EQUITY FUND
    (An open ended equity scheme investing in maximum 30 multicap stocks)

 Fund Commentary

Dear investor,

Indian equity indices experienced a zig zag movement and ultimately ended the month flat with negligible gains. The benchmark indices, BSE-30 and Nifty-50 indices registered monthly gains
of 0.2% and 0.3% (over last month). The indices down the capitalization curve continued to outperform the benchmark indices with BSE Mid-cap and BSE Small-cap indices recording gains of
2.4% and 6.2% respectively. Amongst the sectoral indices, Realty stocks soared (BSE Realty 16.1%) on account of property sales gaining momentum due to lower interest rates and lower stamp
duty. Meanwhile, easing of lockdown restrictions and gradual opening up of economies across the globe has led to rise in the prices of commodities as well the industrial metal stocks (BSE
Metals up 12.6%). On the other hand, banks expressing concern over the rising stress in auto and CV loans weighed on the auto sector (BSE Auto down 5.4%). Meanwhile rise in inflation due to
spike crude oil price had a bearing on the power (BSE Power down 5.0%) and oil & gas stocks (BSE Oil & Gas down 4.5%).
FPIs turned net sellers of Indian equities to the tune of US$1.5 bn in July’21, reversing their last month trend. The YTD flows at US$7.0 bn continue to remain decent. As the global economy
recovers from the pandemic led slowdown, we believe there could be investor interest towards higher risk participation even though rising inflation and tapering of monetary stimulus from
central banks of a few major economies may have a bearing on investor sentiments.

Indian Equity Markets: Slow but steady!
The month started on a positive note with news regarding a steady decline in the Covid-19 cases, rise in the daily vaccinations and gradual easing of the pandemic related restrictions. However,
news regarding delta variant spreading in several countries, expectation of reduction in the stimulus programme by US Fed and inflation inching were some of the factors which contained the
rising trajectory, thereby leading nearly flat monthly gains. Amongst the key developments during the month, there was a major churn in the central government ministries, the IMF cut India’s
FY22 GDP forecast, ECB kept rates unchanged and the cabinet approved the PLI scheme for speciality steel which has an outlay of INR 63 bn for production during FY2023-27.
The manufacturing PMI which had contracted in June’21, was back in the expansionary zone – printing 55.3 in July’21 as some of the states relaxed localized restrictions, leading to an overall
improvement in the economic activity. Some of the other macroeconomic indicators such as power consumption, e-way bill collection and rail freight were robust for July’21 indicating a pick-
up in the economic activity. Power demand touched an all-time high ('Maximum All India Energy Met'- power supplied in a day) in July’21 and over 64.1 mn e-way bills were generated in July’21.
Even the railway network, achieved its highest incremental freight loading of 17.54 MT in the month of July’21.
India’s eight core sectors index increased by 8.9% in June’21. The production of Coal, Natural Gas, Refinery Products, Fertilizers, Steel, Cement and Electricity industries increased in June 2021
over the corresponding period of last year. Further, the merchandise exports strengthened in July’21 – highest ever monthly achievement and stood at US$35.2 bn, posting an increase of 47.9%
over July’20 figure. While India is a net importer in July’21 with a trade deficit of US$11.2 bn, as compared to trade deficit of US$5.3 bn in July’20, the exports during the April-July this year were
US$130.5 bn, up by 73.5% over the corresponding period in 2020. Simplification of compliance related procedures, make in India, make for world were some of the reasons which attributed to
the record performance of exports.
The IMF lowered India’s economic growth projection for FY22 to 9.5% from 12.5% (estimated in April), mentioning a slow recovery in consumer confidence on account of the fierce second
wave of the pandemic and a delayed vaccination programme. Even globally, renewed waves experienced by some countries—notably India, will have an impact on the global economic recovery.
The IMF cited that the growth prospects in India have been downgraded on account of the severe second wave and hence expected slow recovery in confidence from that setback.
There are a few risks in the near to medium term which market participants should closely watch out for
             (1) High spatial and temporal distribution of monsoon which could pose a risk for food inflation
             (2) Spread of new strain of virus along with lower pace of vaccination could put pressure on the health infrastructure
             (3) High valuations along with lower than expected earnings growth, could cap the upside from equity markets

When the fog of pandemic lifts, the path will be clear again!
With WPI in double digits and retail inflation above the stipulated range, there are concerns with regards to economic recovery. However, it is important to note that the rise in inflation was on
account of global commodity price boom and supply side bottlenecks. We believe that the recent decrease in global oil prices, could provide some relief. Also, there were apprehensions regarding
the monsoon deficit and uneven distribution, however, the monsoon rainfall improved to normal levels towards the second half of July’21, which led to improvement in sowing in some of the
key states. On the positive note, the spike in the tax collection in April-June’21 period, especially in corporation tax shows an enhancement in corporate profitability. Further, improvement in
the personal income tax collection during the second wave is a testimony to the fact that the phased lockdowns did not have as adverse economic impact as last year. Even though the pandemic
is in the stage where ‘it is not over till it is over’, we believe that a rise in the inoculation drive (over 470 mn doses administered till July 30, 2021) along with acquired immunity could probably
serve as a cushion for any subsequent waves. We believe that increasing the pace of vaccination and a recovery in economic activity is likely to boost revenue, which could enable government
to spend more in the second half of the fiscal, and result in economic growth. A combination of these factors is likely to support the economic recovery and keep the markets buoyant in the near
to medium term.

Portfolio Positioning
With various parameters showing the economic impact of second wave lesser as compared to the first wave, we believe that cyclical recovery is underway. We believe that the earnings growth
recovery in the near to medium term is expected to be broad based in nature with potential winners across market capitalizations. The earnings growth for companies in Nifty and Sensex, is
likely to be strong for the next couple of years resulting in ROE expansion. All these factors are likely to bode well for markets in the near to medium term. We continue to focus on bottom up
security selection while having a positive bias towards cyclical recovery and taking tactical calls based on the market dynamics.

SCDV Investment framework

                                                                                                                 Sectors stated in SCDV investment framework are indicative and based on internal research.
                                                                                                                 The scheme may or may not hold the securities in all the sectors as mentioned in the investment
                                                                                                                 framework above. S- Secular – Companies with consistent ROE & PAT growth > 15%, C- Cyclical
                                                                                                                 – Companies with PAT growth > 15% but ROE < 15%, D- Defensive – Companies with ROE >
                                                                                                                 15% but PAT growth < 15%, V- Value Traps – Companies with both ROE & PAT growth < 15%.
                                                                                                                 The portfolio weights mentioned in SCDV investment framework are of IIFL Focused Equity
                                                                                                                 Fund as of July 30, 2021. The weights are rounded off to the nearest decimal.

 Disclaimer
 The above commentary/opinions/in house views/strategy incorporated herein is provided solely to enhance the transparency about the investment strategy / theme of the Scheme and should not be treated as endorsement
 of the views / opinions or as an investment advice. The above commentary should not be construed as a research report or a recommendation to buy or sell any security. The information / data herein alone is not sufficient
 and shouldn’t be used for the development or implementation of an investment strategy. The above commentary has been prepared on the basis of information, which is already available in publicly accessible media or
 developed through analysis of IIFL Mutual Fund. The information/ views / opinions provided is for informative purpose only and may have ceased to be current by the time it may reach the recipient, which should be taken
 into account before interpreting this commentary. The recipient should note and understand that the information provided above may not contain all the material aspects relevant for making an investment decision and the
 stocks may or may not continue to form part of the scheme’s portfolio in future. The decision of the Investment Manager may not always be profitable; as such decisions are based on the prevailing market conditions and the
 understanding of the Investment Manager. Actual market movements may vary from the anticipated trends. The statements made herein may include statements of future expectations and other forward-looking statements
 that are based on our current views and assumptions and involve known and unknown risks and uncertainties that could cause actual results, performance or events to differ materially from those expressed or implied in
 such statements. This information is subject to change without any prior notice. The Company reserves the right to make modifications and alterations to this statement as may be required from time to time. Neither IIFL
 Mutual Fund / IIFL Asset Management Ltd, its associates, directors or representatives shall be liable for any damages whether direct or indirect, incidental, punitive special or consequential including lost revenue or lost
 profits that may arise from or in connection with the use of the information.

August 2021                               Mutual Fund investments are subject to market risks, read all scheme related documents carefully.                                                                         Page | 5
IIFL DYNAMIC BOND FUND
(An Open Ended dynamic debt scheme investing across duration)
Investment Objective Portfolio as on July 31, 2021 Composition by Rating^
% to Net
The investment objective of the scheme is to Name of the Instrument Rating
Assets
generate income and long term gains by investing REIT/InvIT Instruments
in a range of debt and money market instruments
Powergrid Infrastructure Investment
of various maturities. The scheme will seek to Power 1.36
Trust
flexibly manage its investment across the Debt Instruments
maturity spectrum with a view to optimize the
Sovereign Securities 20.14
risk return proposition for the Investors.
9.15% GOVERNMENT OF INDIA SOVEREIGN 8.05
Fund Manager Mr. Milan Mody 7.84% STATE GOVERNMENT SECURITIES SOVEREIGN 3.83
Mr. Milan Mody has over 18 years of work 6.97% GOVERNMENT OF INDIA SOVEREIGN 3.01
experience in the Fixed Income market. Prior to
7.17% GOVERNMENT OF INDIA SOVEREIGN 2.26
Instrument Wise Composition^
joining IIFL Asset Management Limited, he was
associated with ITI Asset Management Limited as 6.79% GOVERNMENT OF INDIA SOVEREIGN 2.23
Fixed Income Fund Manager for three years. His 7.69% STATE GOVERNMENT SECURITIES SOVEREIGN 0.76
previous experience includes working
with Darashaw, Birla Sun-life Securities, Sahara Non-Convertible Debentures/Bonds 73.12
Life Insurance and Zyin Research Pvt. Ltd. He has 6.6861% MINDSPACE BUSINESS PARKS CRISIL AAA 10.13
done MBA Finance and B.Com.
7.17% POWER FINANCE CORPORATION
CRISIL AAA 7.50
LIMITED
8.9% STATE BANK OF INDIA* CRISIL AAA 6.20
Fund Details
9.15% ICICI BANK LIMITED* ICRA AA+ 6.03
Date of Allotment : June 24, 2013 ^
Bloomberg Code : IIFDBDBIN 5.85% REC LIMITED CRISIL AAA 4.29
Maturity Profile^
Benchmark Index : Crisil Composite Bond TATA CAPITAL HOUSING FINANCE
CRISIL AAA 3.77
Fund Index LIMITED
Plans Offered : Regular & Direct 8.99% BANK OF BARODA* CRISIL AA+ 3.76
Options Offered : Growth & IDCW 6.88% REC LIMITED CRISIL AAA 3.71
Minimum :
Application 7.25% Embassy Office Parks REIT CRISIL AAA 3.68
New Purchase : ₹10,000 and in multiples 6.75% Sikka Ports and Terminals Limited CRISIL AAA 3.64
of ₹100 thereafter
Additional Purchase : ₹1,000 and in multiples 7.6% Muthoot Finance Limited CRISIL AA+ 3.61
of ₹100 thereafter 5.78% Housing Development Finance
CRISIL AAA 3.57
Monthly SIP Option : ₹1,000 per month for a Corporation Limited
minimum period of 6 7.62% Export Import Bank of India CRISIL AAA 2.31
months 8.95% Jamnagar Utilities & Power Private
Quarterly SIP Option : ₹1,500 per quarter for a Limited
CRISIL AAA 2.30 ^ As of July 31, 2021
minimum period of 4 7.75% LIC Housing Finance Limited CRISIL AAA 2.29 NAV Movement (Since Inception) Rebased to 100
quarters
8.4% India Grid Trust InvIT Fund CRISIL AAA 2.23
Entry Load : NIL
Exit Load : NIL 8.55% ICICI Bank Limited* ICRA AA+ 1.50
The revised exit load as
8.5% State Bank of India* CRISIL AA+ 1.48
mentioned above shall be
applicable on a 8.85% India Grid Trust InvIT Fund CRISIL AAA 0.75
prospective basis and will 6.72% Power Finance Corporation Limited CRISIL AAA 0.37
be applicable to all
investments made on or TREPS## / Reverse Repo
after July 6, 2020 TREPS## 3.25
(''effective date'').
Dematerialization : D-Mat Option Available Net Current Assets 2.13
Asset Allocation : Portfolio Total 100.00
Debt Market : 0% to 100% * BASEL III Compliant
Money Market : 0% to 100%
Dividend Declared - Monthly IDCW Plan
REITs & InvITs : 0% to 10% Gross Dividend (₹) Regular Plan NAV Direct Plan NAV
Date Face Value (₹)
(Per Unit) (₹) (Ex-Dividend) (₹) (Ex-Dividend)
27-Jul-21 10 0.05 11.9942 12.655
NAV as on July 31, 2021 29-Jun-21 10 0.05 11.9569 12.6105
Regular Plan Growth : ₹ 17.3513 25-May-21 10 0.05 11.9934 12.6433
#Regular Plan Bonus : ₹ 17.3513
Regular Quarterly IDCW : ₹ 16.744 Quarterly IDCW Plan
#Regular Half Yearly IDCW : ₹ 16.744
04-Jun-15 10 0.40 11.4678 11.5708
#Regular Monthly IDCW : ₹ 12.0088
Direct Plan Growth : ₹ 18.127 HalfYearly IDCW Plan
Direct Monthly IDCW : ₹ 12.6707 04-Jun-15 10 0.40 11.4678
Dividend is gross dividend. To arrive at the net dividend payable for corporate and non-corporate investors applicable dividend distribution tax, if any, needs to be adjusted respectively. Past
#Note: Bonus plan and Monthly & Half yearly Dividend payout options
performance may or may not be sustained in future. After payment of dividend the NAV has fallen to the extent of payout and distribution taxes if applicable. Monthly Dividend is not assured and is
are discontinued no new investors can invest in the said option
subject to availability of distributable surplus.
,existing investors remain invested in the said options.
Scheme Performance
AUM as on July 31, 2021 31-Jul-20 to 31-Jul-18 to 31-Jul-16 to Since
Net AUM : ₹ 694.84 crore Scheme / Benchmark PTP (₹) PTP (₹) PTP (₹) PTP (₹)
31-Jul-21 31-Jul-21 31-Jul-21 Inception
Monthly Average AUM : ₹ 690.54 crore IIFL Dynamic Bond Fund - Reg – Growth 6.56% 10,654 7.28% 12,348 6.91% 13,975 7.04% 17,351
IIFL Dynamic Bond Fund - Dir - Growth 6.99% 10,697 7.89% 12,560 7.52% 14,375 7.62% 18,127
Benchmark* 3.90% 10,390 9.56% 13,153 7.96% 14,669 8.43% 19,263
Total Expense Ratio Additional Benchmark** 2.16% 10,216 8.75% 12,865 6.50% 13,708 6.74% 16,961
Regular Plan : 0.52% p.a. Past performance may or may not be sustained in future
Different plans shall have different expense structure
Direct Plan : 0.27% p.a. * Crisil Composite Bond Fund Index,** Crisil 10yr Gilt Index; Point to Point (PTP) returns in ₹ is based on standard investment of ₹ 10,000 made on the inception date; Inception date 24-June-2013;
Total Expense Ratio is as on the last business day of the month. Risk-O-Meter
Statistical Debt Indicators THIS PRODUCT IS SUITABLE FOR INVESTORS WHO ARE SEEKING*
• Income and long term gains
Macaulay Duration : 3.71 years • Investment in a range of debt and money market instruments of various maturities
Modified Duration : 3.52 years
Average Maturity : 4.62 years * Investors should consult their financial advisers if in doubt about whether the product is suitable for them.
Yield to Maturity : 6.23%
##With effect from November 05, 2018, Triparty Repo has replaced CBLOs for all schemes with provisions to invest
in CBLO.
August 2021 Mutual Fund investments are subject to market risks, read all scheme related documents carefully. Page | 6
IIFL DYNAMIC BOND FUND
     (An Open Ended dynamic debt scheme investing across duration)

  Fund Commentary

 Highlights for the month

 The central bank’s focus on prioritizing growth prevailed in this MPC policy (August’21) too. So did its position that inflation was transitory (raising estimate by 50 bps and keeping the growth
 estimate intact) and due to supply side disruptions. The RBI mentioned about conducting two auctions of Rs.25,000 crore each under the GSAP programme on 12 August and 26 August’21. The
 central bank has reiterated that although it remains mindful of anchoring inflation, a pre-emptive policy decision would kill the nascent recovery. In-order to prepare markets for the path of
 liquidity normalization we think that there was an intentional dis-agreement of vote (5:1) besides giving a staggered glide path to suck the excess liquidity up to 4 lakh crore till September’21.
 That said, the accommodative policy stance is likely to prevail at-least in this calendar year since amount accepted under the Variable Reverse Repo Rate (VRRR) window forms part of the
 liquidity. As such, we do not foresee a change in policy rates in 2021.

 Post policy and increase in VRRR, there could be some flattening of yield curve. Although global markets have witnessed significant flattening in the last few weeks, even RBI is likely to manage
 the yield curve actively by sucking excess liquidity in short-term and being supportive in the OMO purchases, operation twists etc, however supply concerns are likely to dominate the market
 sentiment. Considering the excess liquidity average of ~INR 8.5 lakh crore, taking into account government cash balances VRRR will not have big impact but will be an important signal to
 narrow the LAF corridor to 25 bps.

 The strong performance of US Treasuries dominated global fixed income returns for the month as the yield on the 10-year bond dropped to 1.22% (mid-February low) from 1.47% surprising
 all the reinflation trades thereby flattening the curve in last one month as concrete expectations over the short-term bullishness and substantial uncertainty over long-run prospects explain
 the recent curve flattening in U.S suggesting the peak in reflation trade is behind us and re-adjustment of expectations has started. The same theory cannot be co-related in the Indian markets
 but given the supply side inflation moderating in coming months along with incremental negative credit growth of 0.6% for FY21-22 with near record low 70.11% CD ratio is likely to put
 demand inflation levers lower, resulting in manageable inflation plus the statistical base effect however, MoM food prices remains the key driver in short-term. On the inflation front, the tussle
 between transitory and persistent is likely to continue across global markets.

 While the path of normalization is certain, subsequently upward movement of yield over a longer term is certain and thereby market is also pricing a relatively rapid path of adjustment ahead.
 It isn’t obvious that interest rate swaps are the best protection against the slow future policy normalization given the sizeable rate hikes that they are already pricing e.g. the 5-year OIS is
 discounting 40 bps in Dec and 50 bps in April (since this is acting as a consensus trade) plus along with the negative carry to the portfolio yield, makes the investment unattractive. While the
 longer curve looks attractive on historical valuation basis but will be subjected to higher volatility viz global rates, oil prices, RBI’s intervention from time to time and fiscal concerns versus the
 medium-term curve.

 The mid-duration curve (3-6 years) seem well positioned to benefit from carry plus roll down even in an environment of gently rising bond yields. The cost of holding cash is large and does not
 make sense given the extraordinary steepness specially in the mid-duration points. We maintain our cautiously positive constructive view in the short-to-medium-term yield curve deploying
 in high quality credits playing accruals with a horizon of three years. We expect the RBI to keep rates unchanged in the current fiscal year (both repo and reverse repo) and wait for more
 sustainable signals on growth recovery before moving the interest rate needle, also pace of using different monetary tools like OMO purchase, primary auction strategy, operation twist is likely
 to increase in coming months to control yield curve. We expect any increase in the reverse repo to be announced in Q4 FY22 or Q1 FY23 at the earliest.

  Disclaimer
  The above commentary/opinions/in house views/strategy incorporated herein is provided solely to enhance the transparency about the investment strategy / theme of the Scheme and should not be treated as endorsement
  of the views / opinions or as an investment advice. The above commentary should not be construed as a research report or a recommendation to buy or sell any security. The information / data herein alone is not sufficient
  and shouldn’t be used for the development or implementation of an investment strategy. The above commentary has been prepared on the basis of information, which is already available in publicly accessible media or
  developed through analysis of IIFL Mutual Fund. The information/ views / opinions provided is for informative purpose only and may have ceased to be current by the time it may reach the recipient, which should be taken
  into account before interpreting this commentary. The recipient should note and understand that the information provided above may not contain all the material aspects relevant for making an investment decision and the
  stocks may or may not continue to form part of the scheme’s portfolio in future. The decision of the Investment Manager may not always be profitable; as such decisions are based on the prevailing market conditions and the
  understanding of the Investment Manager. Actual market movements may vary from the anticipated trends. The statements made herein may include statements of future expectations and other forward-looking statements
  that are based on our current views and assumptions and involve known and unknown risks and uncertainties that could cause actual results, performance or events to differ materially from those expressed or implied in
  such statements. This information is subject to change without any prior notice. The Company reserves the right to make modifications and alterations to this statement as may be required from time to time. Neither IIFL
  Mutual Fund / IIFL Asset Management Ltd, its associates, directors or representatives shall be liable for any damages whether direct or indirect, incidental, punitive special or consequential including lost revenue or lost
  profits that may arise from or in connection with the use of the information.

August 2021                                Mutual Fund investments are subject to market risks, read all scheme related documents carefully.                                                                          Page | 7
IIFL LIQUID FUND
      (An Open Ended Liquid Scheme)

Investment Objective                                                                          Portfolio as on July 31, 2021                                                                                 Composition by Rating^
To provide liquidity with reasonable returns
                                                                                                                                                     % to Net
commensurate with low risk through a portfolio                          Name of the Instrument                                Rating
                                                                                                                                                      Assets
of money market and debt securities with
residual maturity of up to 91 days. However,
                                                                        Commercial Paper
there can be no assurance that the investment
objective of the scheme will be achieved.                               Reliance Industries Limited                        CRISIL A1+                 10.32%
Fund Manager                                 Mr. Milan Mody             Axis Finance Limited                               CRISIL A1+                  5.15%
Mr. Milan Mody has over 18 years of work
experience in the Fixed Income market. Prior to                         Sub Total                                                                       15.47
joining IIFL Asset Management Limited, he was
associated with ITI Asset Management Limited as
Fixed Income Fund Manager for three years. His                          Treasury Bill
previous     experience     includes     working
with Darashaw, Birla Sun-life Securities, Sahara                        364 DAYS TBILL                                    SOVEREIGN                   25.79%
Life Insurance and Zyin Research Pvt. Ltd. He has                       364 DAYS TBILL                                    SOVEREIGN                   25.78%
done MBA Finance and B.Com.                                                                                                                                                                            Instrument Wise Composition^
                                                                        Sub Total                                                                       51.57
Fund Details
Date of Allotment               : November 13, 2013                     TREPS## / Reverse Repo
Benchmark Index                 : Crisil Liquid Fund Index
Plans Offered                   : Regular & Direct
Options Offered                 : Growth & IDCW                         TREPS##                                                                         54.98
Minimum                         :
Application
New Purchase         : ₹5,000 and in multiples                          Sub Total                                                                       54.98
                       of ₹100 thereafter
Additional Purchase : ₹1,000 and in multiples                           Net
                                                                                                                                                      (22.02)
                       of ₹100 thereafter                               Receivables/(Payables)
Monthly SIP Option : ₹1,000 per month for a
                       minimum period of 6                              Portfolio Total                                                                100.00
                       months                                                                                                                                                  ^ As of July 31, 2021
Quarterly SIP Option : ₹1,500 per quarter for a
                       minimum period of 4
                       quarters                                        Scheme Performance
Entry Load           : NIL
Exit Load^           :
                                                                                                                        31-Jul-20 to                            31-Jul-18 to                            31-Jul-16 to                              Since
Investor exit upon     Exit load as a % of                            Scheme / Benchmark                                                        PTP (₹)                                PTP (₹)                                 PTP (₹)                               PTP (₹)
                                                                                                                         31-Jul-21                               31-Jul-21                               31-Jul-21                              Inception
Subscription           redemption proceeds
Day 1                : 0.0070%
Day 2                : 0.0065%
Day 3                : 0.0060%                                        IIFL Liquid Fund - Reg - Growth                        2.84%              10,283               4.61%              11,449              5.34%               12,977             6.28%              15,998
Day 4                : 0.0055%
Day 5                : 0.0050%
Day 6                : 0.0045%                                        IIFL Liquid Fund - Dir - Growth                        2.89%              10,288               4.66%              11,466              5.40%               13,009             6.33%              16,052
Day 7 Onwards        : 0.0000%
Dematerialization : D-Mat Option Available
Asset Allocation     :
Money market and : 0% to 100%                                         Benchmark*                                             3.67%              10,366               5.60%              11,775              6.12%               13,465             6.98%              16,833
debt instruments
with residual
maturity up to 91                                                     Additional Benchmark**                                 3.77%              10,376               6.41%              12,048              6.27%               13,555             6.93%              16,771
days
^The revised exit load as mentioned above shall be applicable on a
prospective basis to all fresh investments (purchase or switch-ins)   Past performance may or may not be sustained in future. Different plans shall have different expense structure. * Crisil Liquid Fund Index,** Crisil 1 Year T-Bill Index; Point to Point (PTP) returns in ₹ is
made on or after October 20, 2019 (Effective Date).                   based on standard investment of ₹10,000 made on the inception date 13-Nov-2013;
Redemption/Switch out of units would be done on First in First out
basis. Please refer addendum notice dated Oct 18, 2019 for more
details.

NAV as on July 31, 2021                                                                                 Maturity Profile^                                                            NAV Movement (Since Inception) Rebased to 100
Regular Plan Growth                             :   ₹ 1599.3763
Regular Plan Weekly IDCW                        :   ₹ 1005.1895
Regular Plan Daily IDCW                         :   ₹ 1000.0701
Direct Plan Growth                              :   ₹ 1605.5636
Direct Plan IDCW                                :   ₹ 1000.0427
Direct Plan Weekly IDCW                         :   ₹ 1005.2005

AUM as on July 31, 2021
Net AUM                                  : ₹ 96.89 crore
Monthly Average AUM                      : ₹ 101.21 crore

Total Expense Ratio
Regular Plan                      : 0.25% p.a.
Direct Plan                       : 0.20% p.a.
                                                                      ^ As of July 31, 2021
Total Expense Ratio is as on the last business day of the month.
                                                                                                                                                                                                                                            Risk-O-Meter
Total Expense Ratio                                                     THIS PRODUCT IS SUITABLE FOR INVESTORS WHO ARE SEEKING*
Macaulay Duration                        :   7.8 days                   • Income over short term horizon
Modified Duration                        :   7.5 days                   • Investments in money market and short term debt instruments, with maturity not exceeding days
Average Maturity                         :   7.2 days
                                                                        * Investors should consult their financial advisers if in doubt about whether the product is suitable for them.
Yield to Maturity                        :   3.31%
                                                                        ##With effect from November 05, 2018, Triparty Repo has replaced CBLOs for all schemes with provisions to invest
                                                                        in CBLO.

August 2021                                          Mutual Fund investments are subject to market risks, read all scheme related documents carefully.                                                                                                                 Page | 8
MONTHLY MARKET UPDATE
GLOSSARY OF TERMS
An employee of the asset management company such as a mutual fund or life insurer, who manages investments of
FUND MANAGER
the scheme. He is usually part of a larger team of fund managers and research analysts.
APPLICATION AMOUNT FOR
This is the minimum investment amount for a new investor in a mutual fund scheme.
FRESH SUBSCRIPTION
MINIMUM ADDITIONAL AMOUNT This is the minimum investment amount for an existing investor in a mutual fund scheme.
The Yield to Maturity or the YTM is the rate of return anticipated on a bond if held until maturity. YTM is expressed
YIELD TO MATURITY as an annual rate. The YTM factors in the bond's current market price, par value, coupon interest rate and time to
maturity.
SIP or systematic investment plan works on the principle of making periodic investments of a fixed sum. It works
SIP similar to a recurring bank deposit. For instance, an investor may opt for an SIP that invests ₹ 500 every 15th of the
month in an equity fund for a period of three years.
The NAV or the net asset value is the total asset value per unit of the mutual fund after deducting all related and
NAV permissible expenses. The NAV is calculated at the end of every business day. It is the value at which the investor
enters or exits the mutual fund.
A group of securities, usually a market index, whose performance is used as a standard or benchmark to measure
BENCHMARK investment performance of mutual funds, among other investments. Some typical benchmarks include the Nifty,
Sensex, BSE200, BSE500, 10-Year Gsec.
A mutual fund may have a sales charge or load at the time of entry and/or exit to compensate the
distributor/agent. Entry load is charged at the time an investor purchases the units of a mutual fund. The entry load
ENTRY LOAD
is added to the prevailing NAV at the time of investment. For instance, if the NAV is ₹ 100 and the entry load is 1 %,
the investor will enter the fund at ₹ 101.
Exit load is charged at the time an investor redeems the units of a mutual fund. The exit load is deducted from the
EXIT LOAD prevailing NAV at the time of redemption. For instance, if the NAV is ₹ 100 and the exit load is 1%, the redemption
price would be ₹99 per unit.
MODIFIED DURATION Modified duration is the price sensitivity and the percentage change in price for a unit change in yield.
Standard deviation is a statistical measure of the range of an investment's performance. When a mutual fund has a
STANDARD DEVIATION
high standard deviation, its means its range of performance is wide, implying greater volatility.
The Sharpe Ratio, named after its founder, the Nobel Laureate William Sharpe, is a measure of risk-adjusted
SHARPE RATIO
returns. It is calculated using standard deviation and excess return to determine reward per unit of risk.
Beta is a measure of an investment's volatility vis-a-vis the market. Beta of less than 1 means that the security will
BETA be less volatile than the market. A beta of greater than 1 implies that the security's price will be more volatile than
the market.
R-squared measures the relationship between a portfolio and its benchmark index. It measures the correlation of
R-SQUARED
the portfolio's returns to the benchmark's returns.
Developed by Jack Treynor, the Treynor ratio (also known as the "reward-to-volatility ratio") attempts to measure
TREYNOR RATIO how well an investment has compensated its investors given its level of risk. The Treynor ratio relies on beta, which
measures an investment's sensitivity to market movements, to gauge risk.
AUM or assets under management refers to the recent I updated cumulative market value of investments managed
AUM
by a mutual fund or any investment firm.
The holdings or the portfolio is a mutual fund's latest or updated reported statement of investments/securities.
HOLDINGS These are usually displayed in terms of percentage to net assets or the rupee value or both. The objective is to give
investors an idea of where their money is being invested by the fund manager.
The investment objective and underlying investments determine the nature of the mutual fund scheme. For
instance, a mutual fund that aims at generating capital appreciation by investing in stock markets is an equity fund
NATURE OF SCHEME
or growth fund. Likewise, a mutual fund that aims at capital preservation by investing in debt markets is a debt
fund or income fund. Each of these categories may have sub-categories.
Mutual funds invest in securities after evaluating their creditworthiness as disclosed by the ratings. A depiction of
RATING PROFILE the mutual fund in various investments based on their ratings becomes the rating profile of the fund. Typically, this
is a feature of debt funds.
Dividend option is renamed as Income Distribution cum Capital Withdrawal (IDCW) option for all Schemes effective
IDCW
from April 1, 2021
Note: SEBI, vide circular dated June 30, 2009 has abolished entry load and mandated that the upfront commission to distributors will be paid by the
investor directly to the distributor, based on his assessment of various factors including the service rendered by the distributor.
August 2021 Mutual Fund investments are subject to market risks, read all scheme related documents carefully. Page | 9You can also read