AUTORELACS: AUTOMATED GENERATION AND ANALYSIS OF ULTRA PARALLEL CHIP SEQ - NATURE
←
→
Page content transcription
If your browser does not render page correctly, please read the page content below
www.nature.com/scientificreports
OPEN AutoRELACS: automated
generation and analysis
of ultra‑parallel ChIP‑seq
L. Arrigoni1, F. Ferrari1,2, J. Weller1, C. Bella1, U. Bönisch1 & T. Manke1*
Chromatin immunoprecipitation followed by sequencing (ChIP-seq) is a method used to profile
protein-DNA interactions genome-wide. Restriction Enzyme-based Labeling of Chromatin in Situ
(RELACS) is a recently developed ChIP-seq protocol that deploys a chromatin barcoding strategy to
enable standardized and high-throughput generation of ChIP-seq data. The manual implementation of
RELACS is constrained by human processivity in both data generation and data analysis. To overcome
these limitations, we have developed AutoRELACS, an automated implementation of the RELACS
protocol using the liquid handler Biomek i7 workstation. We match the unprecedented processivity
in data generation allowed by AutoRELACS with the automated computation pipelines offered
by snakePipes. In doing so, we build a continuous workflow that streamlines epigenetic profiling,
from sample collection to biological interpretation. Here, we show that AutoRELACS successfully
automates chromatin barcode integration, and is able to generate high-quality ChIP-seq data
comparable with the standards of the manual protocol, also for limited amounts of biological samples.
Chromatin immunoprecipitation followed by sequencing (ChIP-seq) is a widely used method to study pro-
tein-DNA interactions genome-wide1. Despite the enormous contribution that ChIP-seq has brought to our
understanding of epigenetic and transcriptional control, the traditional ChIP-seq p rotocol2,3 presents various
limitations. For example, it requires substantial amounts of biological input material, which is often a limiting
factor in relevant clinical settings, and it is low-throughput, which prevents comprehensive epigenetic profiling.
Furthermore, the protocol is poorly standardized across cell types, resulting in a high degree of technical vari-
ability that hampers biological interpretation of the data.
Over the last ten years, much work has been devoted to address these and other shortcomings4–8. In line with
these efforts, we have recently developed Restriction Enzyme-based Labeling of Chromatin in Situ (RELACS),
a method that employs chromatin barcoding to enable high-throughput generation of ChIP-seq e xperiments9.
RELACS works reliably with low input material and can be used for quantitative ChIP-seq a nalysis9,10. The
method is highly standardized, and could potentially be scaled to profile hundreds of samples in parallel for tens
of DNA-binding proteins at once. Yet, the current manual implementation is limited by human processivity in
both data generation and data analysis.
To match the ideal potential of this methodology, we have implemented an automated version of the RELACS
protocol, named AutoRELACS, using the liquid handler Biomek i7 automated workstation (Beckman Coulter).
While other automated ChIP-seq implementations already e xist11,12, they still require a large amount of sample
material, and they do not utilize the enormous multiplexing potential of barcoded chromatin. The scope of these
methods is limited to data generation and the lack of an integrated bioinformatics workflow that streamlines
standard computational tasks (e.g. QC, DNA-mapping, peak calling). AutoRELACS, on the other hand, couples
the high-throughput generation of ChIP-seq data with the scalable and modular computational pipelines offered
by snakePipes13. From version 1.2.3, snakePipes’ DNA-mapping routine can handle RELACS data by perform-
ing demultiplexing of fastq files on RELACS adaptors and UMI-based deduplication. Together, AutoRELACS
and snakePipes build a continuous workflow that automates ChIP-seq data generation and analysis, allowing
for unprecedented processivity.
In this work, we test the performance of AutoRELACS by assessing (1) the scalability of the chromatin barcode
integration step, (2) the quality of the generated data in comparison to the benchmark set by the manual protocol,
and (3) the sensitivity of the automated method when working with low (≤ 25,000 cells/sample) and very low
1
Max Planck Institute of Immunobiology and Epigenetics, Freiburg, Germany. 2Faculty of Biology, University of
Freiburg, Freiburg, Germany. *email: manke@ie‑freiburg.mpg.de
Scientific Reports | (2020) 10:12400 | https://doi.org/10.1038/s41598-020-69443-8 1
Vol.:(0123456789)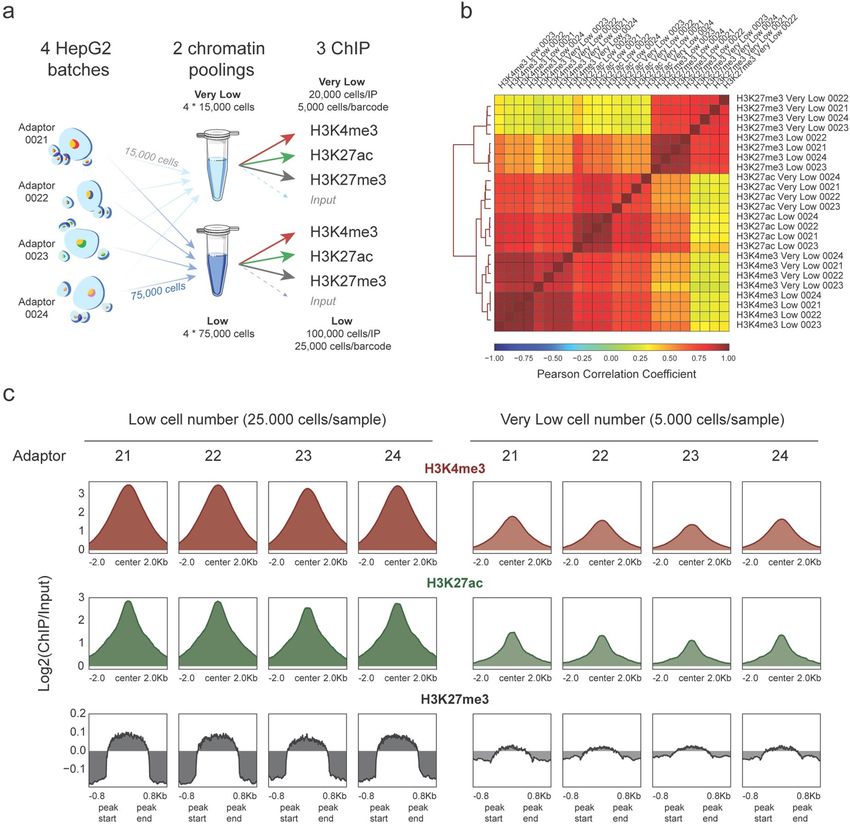
www.nature.com/scientificreports/
(≤ 5,000 cells/sample) cell numbers. We show that AutoRELACS is a scalable method that can generate high
quality ChIP-seq data, comparable with the standards of the manual protocol. We finally show that AutoRELACS
provides reliable epigenetic profiling also with limited input biological material.
Results
AutoRELACS is a scalable method for the generation and analysis of ultra‑parallelized
ChIP‑seq data. Restriction Enzyme-based Labeling of Chromatin in Situ (RELACS) is a method that ena-
bles the high-throughput generation of ChIP-seq experiments9. To increase the standardization and the scalabil-
ity of this approach, we have developed AutoRELACS, an automated implementation of the RELACS protocol
using the liquid handler Biomek i7.
The AutoRELACS workflow is conceptually divided in six parts: four fully automated (A) processes intermit-
ted by two manual (M) steps (Fig. 1a). First, cells are manually processed to isolate the nuclei14 and to digest the
chromatin within the nuclear envelope (step 1-M). Next, using the liquid handler Biomek i7, the chromatin from
each sample is barcoded and pooled into a unique masterbatch (step 2-A). Using focused sonication, nuclei are
lysed and the barcoded chromatin is released (step 3-M). The final three steps of the protocol have been fully
automated and require minimal human supervision. These include the chromatin immunoprecipitation (ChIP)
reactions and washing steps of beads-bound immunocomplexes (step 4-A), decrosslinking, DNA purification
and PCR amplification (step 5-A) and, after sequencing, barcode demultiplexing and bioinformatics analysis
with snakePipes (step 6-A)13.
The integration of sample-specific RELACS barcodes into the digested chromatin (Fig. 1a, step 2) is key to the
success of the method. To test the performance of automated and parallelized RELACS barcode integration, 60
custom barcodes were designed, each composed of a 4 nucleotide (nt)-long unique molecular identifier (UMI),
followed by a 8 nt-long barcode with 50% GC content (note that after combining forward and reverse reads,
each fragment is tagged by a 8-nt long UMI). These adaptors were used to label the chromatin of 60 batches of
S2 cells (Drosophila melanogaster) in duplicates using the Biomek i7 workstation (Fig. 1b). Results show that all
barcodes are present within the pooled chromatin in both replicates, with a distribution of barcode representation
equal to 1.64% ± 0.22% and 1.64% ± 0.35% for replicate 1 and 2 respectively, close to the uniform expectation of
1.667% (Fig. 1b, dashed line).
In summary, we show that AutoRELACS can be used to uniformly integrate multiple barcodes in a fully auto-
mated fashion, allowing for ultra-parallelized processing of a considerable number of samples in one single run.
The quality of AutoRELACS ChIP‑seq data is comparable with manual RELACS. Next, we test
the quality of the ChIP-seq data generated with AutoRELACS and we compare it with the results from the previ-
ously published manual RELACS protocol. To this end, we run in parallel a manual and an automated RELACS
experiment where we digest and barcode 28 batches of S2 cells and we immunoprecipitate against H3K4me3,
H3K27ac and H3K27me3.
The histone modification profiles generated with manual RELACS and with AutoRELACS are overall similar.
The variance present in the first two principal components of the normalized coverage matrix (computed on the
merged peaks set) discriminates between the three histone modifications, regardless of the method used (Fig. 2a).
Comparison of the metaprofiles of the merged scores over peaks shows identical signal for H3K4me3, while
H3K27ac and H3K27me3 present a slightly lower median coverage in AutoRELACS compared to the manual
procedure (Fig. 2b). Nevertheless, these differences do not impinge on the sensitivity of the assay. Visual inspec-
tion of the normalized coverage reveals high similarity between the two RELACS implementations (Fig. 2c), and
high pairwise correlation between demultiplexed samples (Supplementary Fig. 1).
To provide a global overview for all enriched regions, we cluster (k = 5) the signal of H3K4me3, H3K27ac and
H3K27me3 using the manual and the automated RELACS data on a common merged peaks set (Fig. 2d). We
do not observe any set of peaks that are specific to manual RELACS or AutoRELACS, which shows no obvious
implementation-specific biases.
Together, we show that AutoRELACS yields high quality ChIP-seq data that are overall comparable with the
manual RELACS protocol.
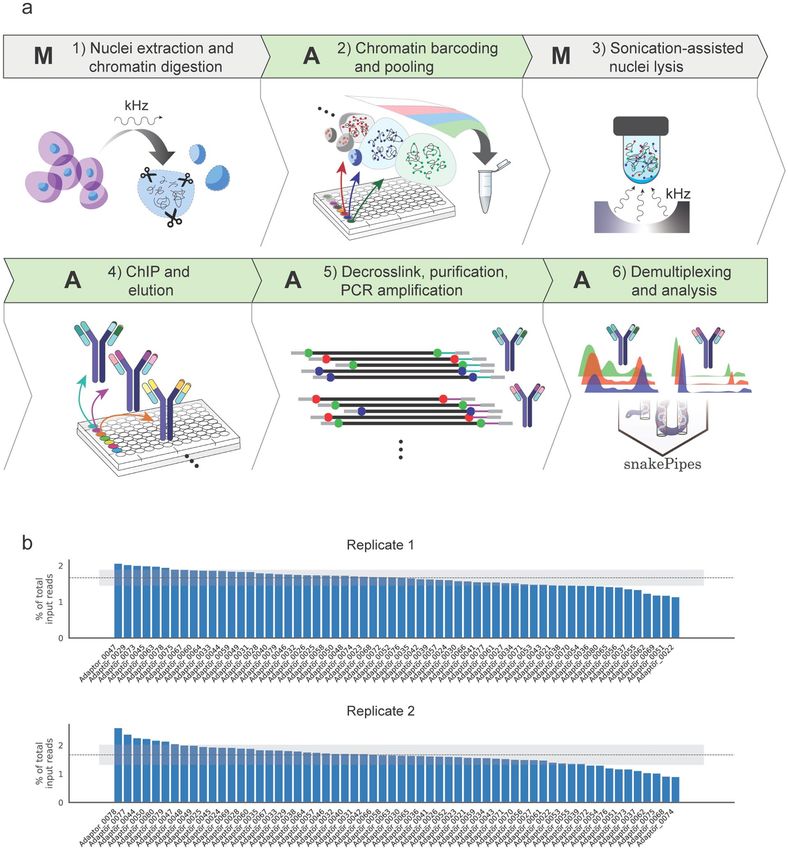
AutoRELACS works reliably with low cell numbers. RELACS can generate robust epigenetic profil-
umbers9. To test the sensitivity limits of AutoRELACS, we barcode 4 batches of HepG2 cells
ing with low cell n
and we aliquote the chromatin into two pools containing 4 × 15,000 and 4 × 75,000 cells respectively. We name
the former “Very Low” and the latter “Low” chromatin pool. Next, we divide each chromatin pool into three
equal aliquotes for immunoprecipitation against H3K4me3, H3K27ac and H3K27me3, while a small fraction of
each pool (~ 1 μL) is set aside as Input control. This setup results in three ChIP reactions with 5,000 cells/barcode
for the “Very Low” pool and three ChIP reactions with 25,000 cells/barcode for the “Low” pool (Fig. 3a).
The normalized genome-wide coverages coming from Low and Very Low experiments are highly correlated
within histone modifications groups, which indicates that the profiles generated with different amounts of input
material are overall similar (Fig. 3b). Although we observe a deterioration of the signal-to-noise ratio in the
Very Low group, the enrichment is preserved and, for narrow euchromatic marks, this is sufficient for robust
peak calling (Fig. 3c).
In summary, we show that AutoRELACS can be deployed for automated and parallelized profiling of histone
modifications genome-wide also for limited amounts of biological samples.
Scientific Reports | (2020) 10:12400 | https://doi.org/10.1038/s41598-020-69443-8 2
Vol:.(1234567890)
www.nature.com/scientificreports/
Figure 1. AutoRELACS workflow ensures comprehensive integration of RELACS barcodes. (a) Overview of AutoRELACS protocol.
(1-M) Nuclei of formaldehyde-fixed cells are extracted manually using adjusted u ltrasound14. The nuclear envelope is permeabilized,
and the chromatin digested in situ using a 4-cutter restriction enzyme (RE). (2-A) Digested chromatin from each sample is
automatically barcoded. Upon completion, the liquid handler pools all barcoded samples into a unique tube (Biomek i7 program:
“RELACS_Barcoding”). (3-M) Pooled samples are collected by the user and nuclei are lysed using focused sonication. (4-A) The
barcoded chromatin is aliquoted according to the number of required immunoprecipitation (IP) reactions into corresponding ChIP
reaction mixes. The ChIP reactions are carried out overnight in parallel at room temperature on the Biomek i7 workstation. Upon
completion, the ChIP-ped chromatin is sequestrated using beads and automatically washed 4 times at increasing stringency conditions
and finally eluted in the elution buffer (Biomek program: “RELACS_ChIP_Elution”). (5-A) Subsequently, the eluted chromatin is
decrosslinked and the DNA is purified. DNA is amplified via PCR using primers carrying Illumina dual indexes. Optionally, the
liquid handler performs multiple rounds of purification and size selection using Ampure XP beads (Biomek program: “RELACS_
Decrosslink_FinalLibraries”). A: Automated; M: Manual. Cells images in step1 were made by Freepick from www.flaticon.com. The
image was created using Adobe Inc. (2020). Adobe Illustrator. Retrieved from https://adobe.com/products/illustrator. (6-A) Libraries
are sequenced on Illumina’s sequencing devices. Upon completion of the sequencing run, bcl2 files are automatically converted to
fastq format and input into the fully automated ChIP-seq workflow available as part of the snakePipes s uite13. SnakePipes’ ChIP-seq
workflow performs demultiplexing of reads on RELACS custom barcodes, quality controls, mapping and filtering of duplicate reads
using unique molecular identifiers (UMI), and further downstream analysis like generation of input-normalized coverage tracks and
peak calling. (b) Distribution of RELACS barcodes in two independent input chromatin pools. 60 barcodes are integrated into the
digested chromatin of two independent batches of S2 cells. Sequencing of the input chromatin pool for replicate 1 (upper panel) and
replicate 2 (lower panel), reveals the percentage of input reads for each barcode used (y-axis). The ideal uniform distribution (100/60)
is represented as a dotted line. The shaded gray area shows one standard deviation from the mean of the observed distribution.
Scientific Reports | (2020) 10:12400 | https://doi.org/10.1038/s41598-020-69443-8 3
Vol.:(0123456789)www.nature.com/scientificreports/
Figure 2. AutoRELACS ChIP-seq data are comparable with the standards of the manual protocol. (a) Principal
component analysis (PCA) of the normalized coverage matrix computed on the merged peak set between
H3K4me3, H3K27ac and H3K27me3, as generated by AutoRELACS (Automated) and manual RELACS
(Manual). For each mark and protocol implementation, all 28 demultiplexed technical replicates are shown. The
10,000 most variable loci across all marks are input into the PCA. (b) Metaprofile of the median normalized
coverage computed over H3K4me3 (upper panel), H3K27ac (central panel) and H3K27me3 (lower panel)
peaks. Each panel shows the signal generated with AutoRELACS and manual RELACS from a merge of all 28
technical replicates. For H3K27ac and H3K27me3, we only observe a slight reduction in the signal-to-noise
ratio of the automated method. (c) Data tracks of the merged signal of the 28 technical replicates for H3K4me3
(red), H3K27ac (green), H3K27me3 (grey) and Input (cyan) on the dm6 locus chr2R:7,400,000–7,700,000. For
each mark, we show the profile generated by AutoRELACS (Automated) and manual RELACS (Manual) and the
merged set of peaks called in the two datasets (Merged Peaks). (d) Heatmaps showing the clustered signal (k = 5)
on a merged set of peaks, as identified in the AutoRELACS (Automated) and in the manual RELACS (Manual)
dataset, for H3K4me3 (left panel), H3K27ac (central panel) and H3K27me3 (right panel). The choice of colors
is the same as in (a–c) and the similarity between each pair of samples indicates that there are no obvious
implementation-specific clusters.
Scientific Reports | (2020) 10:12400 | https://doi.org/10.1038/s41598-020-69443-8 4
Vol:.(1234567890)www.nature.com/scientificreports/
Figure 3. AutoRELACS works with low cell numbers. (a) Overview of the experimental design used to test the
sensitivity limits of AutoRELACS. Four batches of HepG2 cells are barcoded and pooled into two chromatin
masterbatches, the first comprising 4 × 15,000 cells (Very Low input) and the second 4 × 75,000 cells (Low
Input). Each chromatin pool is evenly split into three ChIP reactions (H3K4me3, H3K27ac, H3K27me3), while
a small fraction (~ 1 μl) is set aside as Input control. For the Very Low pool, about 20,000 cells are used in each
ChIP, which corresponds to 5,000 cells/barcode. For the Low pool, about 100,000 cells are used in each ChIP,
which corresponds to 25,000 cells/barcode. Cells images were adapted from an flaticon by Freepick from www.
flaticon.com. The image was created using Adobe Inc. (2020). Adobe Illustrator. Retrieved from https://adobe
.com/products/illustrator. (b) Hierarchical clustering of HepG2 ChIP-Seq profiles of H3K4me3, H3K27ac and
H3K27me3, generated using Low and Very Low chromatin input, based on the pairwise Pearson Correlation
Coefficient (PCC). Each pairwise PCC is computed based on the binned coverage (bin width = 10 kb) over the
whole genome. (c) Metaprofile of the mean enrichment over Input of H3K4me3 (upper panel, red), H3K27ac
(central panel, green) and H3K27me3 (lower panel, grey), computed on a consensus set of peaks identified for
each mark separately, from the Low and Very Low input chromatin.
Discussion
In this work we present AutoRELACS, an automated implementation of the RELACS protocol9 that enables
the automated high-throughput generation of ChIP-seq experiments. AutoRELACS natively interfaces with
the computational pipelines offered by s nakePipes13, thus streamlining the generation and analysis of histone
modifications profiles at unprecedented scale.
RELACS can parallelize ChIP-seq data generation through in situ ligation of sample-specific barcodes into
the digested chromatin inside the nuclear envelope. Here, we show that AutoRELACS successfully integrates a
high number of barcodes in parallel, ensuring a balanced representation of each adaptor in the final chromatin
Scientific Reports | (2020) 10:12400 | https://doi.org/10.1038/s41598-020-69443-8 5
Vol.:(0123456789)www.nature.com/scientificreports/
pool. While we limit our test to 60 barcodes, a single AutoRELACS experiment can support the integration of
up to 96 barcodes. The resulting chromatin pool can be split into 96 ChIP reactions, leading to the generation
of up to 9,216 independent chromatin profiles in only 3 days. It should be noted that more imbalanced barcode
distributions within the final chromatin pool may still lead to a successful profiling, at the cost of increasing the
total sequencing depth. It is therefore suggested to perform a preliminary shallow sequencing of the chromatin
input to estimate the total sequencing depth needed to ensure a minimum coverage for all samples.
In our implementation we have used the Biomek i7 platform, but the protocol could be equally implemented
on any liquid handler that has an on-deck thermocycler, can handle magnetic beads and is able to work on mul-
tiple samples in parallel (for further details, we refer to the Supplementary Informations: Biomek i7 requirements
and consumables for automation).
AutoRELACS carries all advantages and limitations of RELACS. As with all automated protocols, the large
degree of standardization offered by AutoRELACS comes with reduced flexibility, which might be required for
individual samples in one batch. AutoRELACS defines batch-wide parameters (e.g. ChIP volumes, beads volume)
that can be adjusted by the user. Samples requiring distinct treatment should be processed in different batches.
The current AutoRELACS implementation has room for further improvements. To date, the method still
requires human intervention in the earliest stages of the protocol. Future developments might integrate the
use of focused sonicator platforms into the workflow of the liquid handler workstation, to further reduce user
intervention and enable a full walk-away automated solution. It should be noticed that our method, in contrast
to other sensitive ChIP-seq protocols5 employs a standard library preparation. We consider this an advantage,
but in future work one might want to combine improvements at both the sample preparation and the library
preparation steps.
Although in this work we have focussed on histone modifications, there is no fundamental limitation to
profiling also transcription factor binding sites. Depending on the specific factor or cofactor of interest, this may
require improved fixation conditions before the AutoRELACS protocol or variable ChIP conditions in step 4 of
the AutoRELACS protocol. Regardless of such optimizations and extensions, the current AutoRELACS protocol
defines a common set of standard operating procedures to generate high quality ChIP-seq data, comparable with
the standards of the manual implementation. Importantly, the method can be used for epigenetic profiling of low
cell numbers. Together, these features suggest AutoRELACS as a method of choice in various clinical applications,
potentially enabling comprehensive screening of epigenetic markers from small amounts of biological material.
Materials and methods
Cell culture. S2 cells were cultured in Express Five SFM (Thermo Fisher Scientific) supplemented with glu-
tamax, at 27 °C and were provided by Akhtar’s lab (MPI-IE). HepG2 liver hepatocellular carcinoma (ATCC,
HB-8065) were cultured in Eagle’s minimal essential medium (EMEM, Lonza, 06-174) supplemented with 10%
fetal bovine serum (Sigma), 2 mM l-glutamine (Lonza), 1.8 mM CaCl2, 1 mM sodium pyruvate (Lonza) and
penicillin–streptomycin mixture (100 units/mL, Lonza), at 37 °C at 5% C
O2 in 10 cm plates, up to 70–80%
confluency.
Cell fixation. HepG2 and S2 cells were fixed in 1% methanol-free formaldehyde (Thermo Scientific, 28,906)
in D-MEM (for HepG2 cells) or Express Five SFM (for S2 cells) for 15 min at room temperature under gentle
shaking. Formaldehyde was quenched for 5 min by adding 125 mM glycine final concentration. Cells were
rinsed twice with ice-cold PBS, harvested by scraping (HepG2) and pelleted (300 g, 10 min, 4 °C).
Detailed AutoRELACS workflow. The AutoRELACS protocol is divided into five main steps (as described
in Fig. 1).
A separated program file is provided for each automated section and is available for download at https: //githu
b.com/FrancescoFerrari88/AutoRELACS/tree/master/AutoRELACS_binaries_Biomek_i7.
1. Nuclei extraction and chromatin digestion (manual protocol). Nuclei are extracted from fixed cells, swollen,
digested, washed and counted as previously d escribed9. The resulting digested nuclei are resuspended in 10 mM
Tris–HCl pH 8 at the nuclei density of 500,000 nuclei/25 µL (Drosophila S2) and 500,000 nuclei/25 µL (HepG2)
for the following nuclei barcoding step.
2. Chromatin barcoding and pooling (automated, method file “RELACS barcoding.bmf ”). In this step chromatin
is barcoded inside the nuclei as previously d escribed9, but using automation. This method allows the processing
for a flexible number of nuclei samples, from 1 to 96.
Preparation of reagents: nuclei samples are aliquoted column-wise in a 96-wells PCR plate (25 µL of digested
nuclei per well), named “Nuclei Plate”. 2 µL of the desired RELACS barcode at 15 µM are aliquoted in each well
of a second 96-wells PCR plate, following the same coordinates of the respective nuclei aliquot (named “Index
Plate”). The following reagent mixes are positioned into 1.5 mL conical tubes on the Biomek deck in a cold Peltier
block: End Repair mix (ER), Ligation mix (LIG) and 3 M NaCl, following directions as highlighted in the “guided
instrument setup” (a screenshot of the deck is shown in Supplementary Fig. 2a).
Steps of the “RELACS barcoding” program: 5 µL of ER mix are added into each occupied well of “Nuclei
Plate”. The plate is mixed on the orbital shaker present on the deck and incubated into the integrated PCR cycler
for 30 min at 20 °C and for 5 min at 65 °C. End-repaired nuclei are transferred from “Nuclei Plate” to the “Index
Plate” containing RELACS barcodes. 15.5 µL of LIG mix are added into each occupied well. The “IndexPlate” is
shaken and transferred into the integrated PCR cycler for ligation incubation (15 min at 30 °C and for 15 min
at 20 °C). The ligation is inactivated adding 5 µL of 3 M NaCl into each occupied well of “Index Plate”. The plate
Scientific Reports | (2020) 10:12400 | https://doi.org/10.1038/s41598-020-69443-8 6
Vol:.(1234567890)www.nature.com/scientificreports/
is shaken and pooling is automatically performed by transferring samples from each occupied well of “Index
Plate” to 1.5 mL tubes positioned into the “Final Pool” rack. Wells containing barcoded nuclei can be pooled as
specified by the user, by indicating source and destination coordinates of “Index Plate” and “Final Pool” into the
.csv file “Nuclei_Pooling_Template.csv”.
3. Sonication‑assisted nuclei lysis (manual protocol). Tubes containing nuclei pools are manually collected. Bar-
coded nuclei are pelleted down (5,000 g for 10 min). Supernatants are discarded and pellets are resuspended into
the desired volume of Shearing buffer supplemented with Protease Inhibitor Cocktail (Roche, 11873580001) and
sonicated for 5 min in a Covaris E220 sonicator as described9.
4. ChIP and elution (automated, method file “RELACS ChIP‑Elution.bmf ”). The method allows for a flexible
number of ChIP reactions from 1 to 96 simultaneously. A screenshot of the overall organization of the deck is
shown in Supplementary Fig. 2b.
All reagents used and the procedure of ChIP largely overlap to the ones described in our former publication9,
with the relevant modifications highlighted here below. Preparation of ChIP plate (named “Sample Plate”): ChIP
reactions are carried out in a maximum volume of 150 µL instead of 200 µL used for manual RELACS. 75 µL of
chromatin prepared in step 3 are aliquoted column-wise into a 1.2 mL storage plate (Thermo Fisher, AB1127)
accordingly to the required number of ChIP. To equilibrate salts and detergents, 73 µL of 1X buffer iC1 (from
iDeal ChIP-seq kit for histones, Diagenode C01010173) supplemented with Protease Inhibitor Cocktail (Roche,
11873580001) and 2 µL of 5 M NaCl are added into each chromatin well. One µg per 100,000 cells of the desired
antibody (H3K4me3 C15410003, H3K27ac C15410196, H3K27me3 C15410195, all from Diagenode) is added
into each well. Remaining chromatins are set aside at 4 °C to prepare inputs. Please notice that input samples
will be manually added later on before the automated decrosslinking step.
Preparation of reagents: ChIP Wash buffers 1 to 4 (from iDeal ChIP-seq kit for histones, Diagenode
C01010173) are aliquoted into quarter module reservoirs divided by length. ChIP elution buffer (1% SDS,
200 mM NaCl, 10 mM Tris–HCl pH 8, 1 mM EDTA) is also aliquoted into the remaining well of the reservoir
as highlighted in the “guided instrument setup”. ChIP beads (Dynabeads protein A-conjugated magnetic beads,
Invitrogen) are washed twice with 1X buffer iC1 and aliquoted into two 1.5 mL conical tubes before placing
them on the deck.
Automated protocol: the program involves four main steps (antibody incubation, beads incubation, ChIP
washes, elution). Antibody incubation is performed by shaking the “Sample Plate” containing the ChIP reactions
on the orbital shaker, repeating this procedure 12 times: 20 min continuous shaking at 500 rpm, stop for 10 min.
In comparison to manual RELACS we carried out ChIP incubation for a total time of 6 h at room temperature
instead of 10 h at 4 °C as used in manual RELACS. Please notice that we did this modification to overcome
technical constraints that would have resulted in loss of samples when mixing by pipetting.
Beads incubation: beads placed on the deck are automatically mixed and 15 µL of beads are dispensed into
each ChIP reaction. “Sample Plate” is then transferred on the orbital shaker and mixed for a total time of 2 h at
room temperature (5 min continuous shaking at 500 rpm, stop for 5 min, repeated 12 times). In comparison to
the procedure used for manual RELACS, beads incubation time for AutoRELACS has been reduced by one hour.
ChIP washes: the following procedure is repeated for each of the four wash buffers. “Sample Plate” is trans-
ferred onto the magnetic rack and left for 5 min to reclaim the beads-bound immunocomplexes to the magnet.
Supernatants are aspirated, discarded into the wash station, and 150 µL of wash buffer are added into each
occupied well. Plate is shaken on the orbital shaker for about 5 min to wash the beads (5 s pulse shaking at
800 rpm for 60 times).
Elution: the last wash supernatants are removed from the beads. 80 µL of ChIP elution buffer is added to the
beads and the plate is shaken on the orbital shaker for a total time of about 35 min (5 s pulse shaking at 800 rpm
for 60 times, 4 min pause, for four times). “SamplePlate” is placed onto the magnet for 5 min and supernatants
containing immunoprecipitated material are collected into a fresh 96-well plate (called “ChIPEluates”) and stored
overnight into the integrated PCR cycler at 10 °C.
5. Decrosslink, purification, USER treatment, PCR amplification (automated, method file “RELACS Decross‑
link‑FinalLibrary.bmf ”). The plate “ChIP Eluates” is collected from the Biomek and Input samples are manu-
ally added column-wise after the ChIP samples (0.1–10% of the original chromatin volume in 80 µL of ChIP
Elution buffer). This plate is placed back onto the deck and renamed in the instrument setup as “Sample Plate 2”.
Reagent preparation: 4 µL of 10 µM Illumina dual index primer cocktails (from IDT) are placed in a 96-well
PCR plate column-wise following the desired pattern corresponding to the ChIP samples (plate is named “Index
Plate”). The following reagents are required for this section of program, as specified in the instrument setup
(Supplementary Fig. 2c): 100% isopropanol, EB (10 mM Tris–HCl pH 8), freshly prepared 85% ethanol (all on
the deck at room temperature), proteinase K 20 mg/ml (Thermo Fisher, EO0491), glycogen 20 mg/mg (Thermo
Fisher, R0561), carboxylated magnetic beads (Invitrogen, 65011), PCR mix (NEBNext Ultra II Q5 Master mix,
NEB M0544), USER enzyme (NEB M5505), all placed in 1.5 mL conical tubes in a cold Peltier block. Ampure
XP (Beckman Coulter, A63881) are thoroughly mixed and aliquoted column-wise according to the pattern of
“Sample Plate 2” in a 96-well storage plate (AB0765, Thermo Fisher), using 100 µL of beads per well.
Automated Decrosslink: 2 µL of proteinase K are transferred into each occupied well of “Sample Plate 2”
containing ChIP eluates and input samples. The plate is mixed on the orbital shaker and incubated for 2 h at
65 °C into the integrated PCR cycler.
Automated DNA purification: in comparison to manual RELACS, in which decrosslinked DNA is purified
using columns (Qiagen minElute PCR purification kit), AutoRELACS uses a custom-made DNA purification
Scientific Reports | (2020) 10:12400 | https://doi.org/10.1038/s41598-020-69443-8 7
Vol.:(0123456789)www.nature.com/scientificreports/
by precipitation and sequestration using carboxylated magnetic beads. Decrosslinked samples are transferred
from the PCR plate to a larger 96-well storage plate (“ChIP Purification”, 4titude, LB0125). The following reagents
are added into each occupied well: 2 µL of glycogen, 10 µL of carboxylated beads (automatically pre-mixed by
pipetting before dispensing), and 80 µL of isopropanol. The plate “ChIP Purification” is mixed by shaking and
incubated at room temperature for 10 min. The beads are reclaimed onto the integrated magnet for 5 min and
supernatants are discarded. DNA bound to beads is washed twice using 200 µL of 85% ethanol. Beads are dried
and DNA is automatically eluted by addition of 28 µL of EB into each occupied well. Plate is placed onto the
magnet to discard the beads and to collect purified eluates.
USER treatment: 27 µL of purified DNAs are collected into a fresh 96-well PCR plate. 3 µL of USER enzyme
is added into each occupied well. Plate is shaken and incubated into the integrated PCR cycler for 15 min at
37 °C. Samples are transferred into a 96-well storage plate for purification using Ampure XP (0.9X ratio). After
purification, samples are eluted in 22 µL of EB.
Automated amplification of final libraries and purification: 21 µL of each purified DNA are transferred to the
96-well PCR plate containing Illumina indexes (“Index Plate”). 25 µL of PCR mix are added into each occupied
well and the plate is shaken. The plate is then transferred into the integrated PCR cycler for PCR incubation
(hot start 98 °C for 30 s; PCR cycles: 98 °C for 10 s, 65 °C for 75 s; final extension 65 °C for 5 min). Notice that
before launching the method the user has the possibility of choosing the number of PCR cycles to use (10, 12
or 14). In the experiments presented in this work libraries were amplified using 12 PCR cycles (14 PCR cycles
for low input ChIP). Amplified samples are transferred into a 96-well storage plate for double purification using
Ampure XP (first at 0.8X ratio second at 1X ratio). Ready libraries are eluted in 25 µL of EB and transferred in
a clean 96-well PCR plate.
Sequencing. Libraries were quality-controlled to check the concentration (Qubit DNA HS, Invitrogen,
Q32851) and the fragment size distribution (Fragment Analyzer capillary electrophoresis, NGS 1–6,000 bp hs
DNA kit). Libraries were pooled and normalized to 1 to 2 nM with 10% PhiX spike-in according to the Illumina
guidelines. Libraries were clustered on NovaSeq XP flowcells and sequenced paired-end with a read length of
50 bp on an Illumina NovaSeq 6000 instrument.
Bioinformatics analysis. BCL files were converted to fastq format using bcl2fastq2 (v. 2.20.0) and demul-
tiplexed on Illumina barcodes. Fastq files were used as input to snakePipes’ DNA-mapping and ChIP-seq work-
flows (v. 1.2.3)13, using default parameters as listed in https://github.com/FrancescoFerrari88/AutoRELACS/
tree/master/snakePipes_defaults. The only added requirement was the provision of a sample sheet, an example
of which is provided in the same repository. Mapping was performed on the genome build dm6 and hg38 for
D. melanogaster and H. sapiens respectively. Briefly, fastq files were demultiplexed on RELACS adaptor bar-
codes and reads were mapped to the reference genome using Bowtie2 (v. 2.3)15. Uniquely mapping read pairs
(mapq > 3) were retained and duplicates were filtered on UMI using UMITools (paired mode) (v. 1.0.0)16. Peaks
were called using MACS2 (v. 2.1.2)17 with default parameters. Merged peak sets were obtained by concatenating,
sorting and merging peaks identified in the different experimental conditions included in the analysis, using
bedtools sort | merge (v. 2.28)18.
Clustered heatmaps, ChIP-seq metaprofiles and the clustered correlations heatmap were generated using
deeptools (v. 3.3.1)19, using filtered bam files as input. Principal component analysis (Fig. 2a) was performed
using the Python library scikit-learn (v. 0.19.1) on rlog-transformed count m atrix20. Coverage was obtained
19
using deeptools’ multiBamSummary (v. 3.3.1) on the merged peak set. We use p yGenomeTracks21 to visualize
signal tracks on specific genomic loci.
Data availability
Raw data and normalized bigWig tracks were deposited to GEO and are available for download using the fol-
lowing accession number: GSE147042.
Code availability
The fully reproducible and documented analysis is available on github at https://github.com/FrancescoFerrar
i88/AutoRELACS, as Jupyter notebooks and R/python scripts.
Received: 31 March 2020; Accepted: 7 July 2020
References
1. Furey, T. S. ChIP-seq and beyond: new and improved methodologies to detect and characterize protein–DNA interactions. Nat.
Rev. Genet. 13(12), 840–852 (2012).
2. Johnson, D. S., Mortazavi, A., Myers, R. M. & Wold, B. Genome-wide mapping of in vivo protein–DNA interactions. Science
316(5830), 1497–1502 (2007).
3. Mikkelsen, T. S. et al. Genome-wide maps of chromatin state in pluripotent and lineage-committed cells. Nature 448(7153), 553–560
(2007).
4. van Galen, P. et al. A multiplexed system for quantitative comparisons of chromatin landscapes. Mol. Cell. 61(1), 170–180 (2016).
5. Schmidl, C., Rendeiro, A. F., Sheffield, N. C. & Bock, C. ChIPmentation: fast, robust, low-input ChIP-seq for histones and tran-
scription factors. Nat. Methods. 12(10), 963–965 (2015).
6. Brind’Amour, J. et al. An ultra-low-input native ChIP-seq protocol for genome-wide profiling of rare cell populations. Nat. Com‑
mun. 6, 6033 (2015).
7. Shankaranarayanan, P., Mendoza-Parra, M.-A., van Gool, W., Trindade, L. M. & Gronemeyer, H. Single-tube linear DNA ampli-
fication for genome-wide studies using a few thousand cells. Nat. Protoc. 7(2), 328–338 (2012).
Scientific Reports | (2020) 10:12400 | https://doi.org/10.1038/s41598-020-69443-8 8
Vol:.(1234567890)www.nature.com/scientificreports/
8. Chabbert, C. D. et al. A high-throughput ChIP-Seq for large-scale chromatin studies. Mol. Syst. Biol. 11(1), 777 (2015).
9. Arrigoni, L. et al. RELACS nuclei barcoding enables high-throughput ChIP-seq. Commun. Biol. 1, 214 (2018).
10. Ferrari, F. et al. DOT1L methyltransferase activity preserves SOX2-enhancer accessibility and prevents activation of repressed
genes in murine stem cells. BioRxiv https://doi.org/10.1101/2020.02.03.931741v1 (2020).
11. Aldridge, S. et al. AHT-ChIP-seq: a completely automated robotic protocol for high-throughput chromatin immunoprecipitation.
Genome Biol. 14(11), R124 (2013).
12. Gasper, W. C. et al. Fully automated high-throughput chromatin immunoprecipitation for ChIP-seq: identifying ChIP-quality
p300 monoclonal antibodies. Sci. Rep. 4, 5152 (2014).
13. Bhardwaj, V. et al. snakePipes: facilitating flexible, scalable and integrative epigenomic analysis. Bioinformatics 35(22), 4757–4759
(2019).
14. Arrigoni, L. et al. Standardizing chromatin research: a simple and universal method for ChIP-seq. Nucleic Acids Res. 44(7), e67
(2016).
15. Langmead, B. & Salzberg, S. L. Fast gapped-read alignment with Bowtie 2. Nat. Methods. 9(4), 357–359 (2012).
16. Smith, T., Heger, A. & Sudbery, I. UMI-tools: modeling sequencing errors in Unique Molecular Identifiers to improve quantifica-
tion accuracy. Genome Res. 27(3), 491–499 (2017).
17. Zhang, Y. et al. Model-based analysis of ChIP-Seq (MACS). Genome Biol. 9(9), R137 (2008).
18. Quinlan, A. R. & Hall, I. M. BEDTools: a flexible suite of utilities for comparing genomic features. Bioinformatics 26(6), 841–842
(2010).
19. Ramírez, F. et al. deepTools2: a next generation web server for deep-sequencing data analysis. Nucleic Acids Res. 44(W1), W160–
W165 (2016).
20. Love, M. I., Huber, W. & Anders, S. Moderated estimation of fold change and dispersion for RNA-seq data with DESeq2. Genome
Biol. 15(12), 550 (2014).
21. Ramírez, F. et al. High-resolution TADs reveal DNA sequences underlying genome organization in flies. Nat. Commun. 9(1), 189
(2018).
Acknowledgements
We would like to thank Alexiadis Anastasios for providing the S2 cells, and Erez Dror for technical support.
This work was funded by the Deutsche Forschungsgemeinschaft—Project ID 192904750—CRC 992 Medical
Epigenetics. F.F. was supported by the Deutsche Forschungsgemeinschaft (DFG, German Research Foundation):
322977937/GRK2344.
Author contributions
L.A. created the Biomek i7 AutoRELACS protocol, with inputs from U.B. F.F. cultured HepG2 cells and per-
formed all bioinformatics analysis, with inputs from T.M. C.B. and J.W. executed the barcode integration test,
the RELACS and the AutoRELACS protocols on S2 cells and HepG2 cells. F.F. and L.A. wrote the manuscript
and assembled the figures, under the supervision of U.B. and T.M.
Competing interests
The authors declare no competing interests.
Additional information
Supplementary information is available for this paper at https://doi.org/10.1038/s41598-020-69443-8.
Correspondence and requests for materials should be addressed to T.M.
Reprints and permissions information is available at www.nature.com/reprints.
Publisher’s note Springer Nature remains neutral with regard to jurisdictional claims in published maps and
institutional affiliations.
Open Access This article is licensed under a Creative Commons Attribution 4.0 International
License, which permits use, sharing, adaptation, distribution and reproduction in any medium or
format, as long as you give appropriate credit to the original author(s) and the source, provide a link to the
Creative Commons license, and indicate if changes were made. The images or other third party material in this
article are included in the article’s Creative Commons license, unless indicated otherwise in a credit line to the
material. If material is not included in the article’s Creative Commons license and your intended use is not
permitted by statutory regulation or exceeds the permitted use, you will need to obtain permission directly from
the copyright holder. To view a copy of this license, visit http://creativecommons.org/licenses/by/4.0/.
© The Author(s) 2020
Scientific Reports | (2020) 10:12400 | https://doi.org/10.1038/s41598-020-69443-8 9
Vol.:(0123456789)You can also read