Autumn COVID 19 surge dates in Europe correlated to latitudes, not to temperature humidity, pointing to vitamin D as contributing factor - Nature
←
→
Page content transcription
If your browser does not render page correctly, please read the page content below
www.nature.com/scientificreports
OPEN Autumn COVID‑19 surge dates
in Europe correlated to latitudes,
not to temperature‑humidity,
pointing to vitamin D
as contributing factor
Stephan Walrand
To determine the factor triggering the sudden surge of daily new COVID-19 cases arising in most
European countries during the autumn of 2020. The dates of the surge were determined using a fitting
of the two last months of reported daily new cases in 18 European countries with latitude ranging from
39° to 62°. The study proves no correlation between the country surge date and the 2 weeks preceding
temperature or humidity but shows an impressive linear correlation with latitude. The country surge
date corresponds to the time when its sun UV daily dose drops below ≈ 34% of that of 0° latitude.
Introducing reported seasonal blood 25-hydroxyvitamin D (25(OH)D) concentration variation into the
reported link between acute respiratory tract infection risk and 25(OH)D concentration quantitatively
explains the surge dynamics. Several studies have already substantiated a 25(OH)D concentration
impact on COVID-19 severity. However, by comparing different patient populations, discriminating
whether a low 25(OH)D concentration is a real factor underlying COVID-19 severity or only a marker
of another weakness that is the primary severity factor can be challenging. The date of the surge is
an intrapopulation observation and has the benefit of being triggered only by a parameter globally
affecting the population, i.e. decreases in the sun UV daily dose. The results indicate that a low 25(OH)
D concentration is a contributing factor to COVID-19 severity, which, combined with previous studies,
provides a convincing set of evidence.
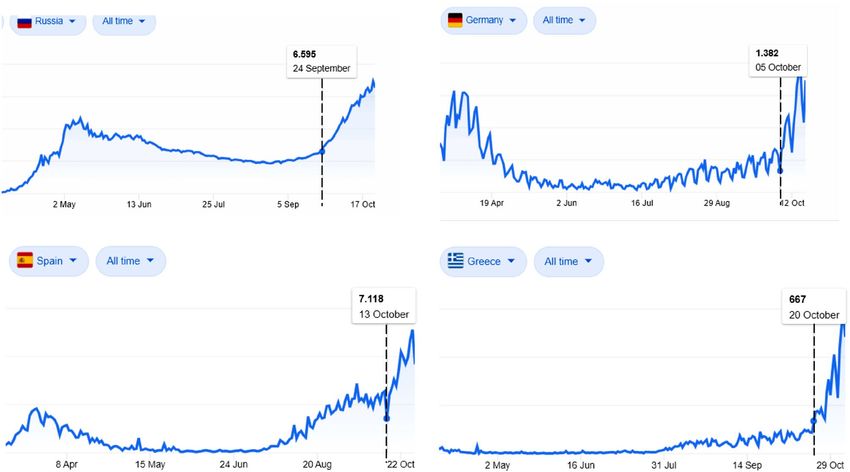
Most European countries underwent an unexpected surge of daily new COVID-19 cases in autumn (Fig. 1),
imposing new confinement rules and emergency lockdowns.
A commonly reported explanation is the decreasing temperature. The aim of this study is to challenge this
assumption against a pure latitude impact.
Materials and methods
Data sources. The countries’ daily new COVID-19 cases, more exactly, the daily new SARS-CoV-2 sero-
positive cases, were obtained from the European Union agency European Centre for Disease Prevention and
Control (https://www.ecdc.europa.eu/en/publications-data/download-todays-data-geographic-distribution-
covid-19-cases-worldwide).
The country population weighted centre (PWC) latitudes were obtained from the Baylor University popula-
tion resource (http://cs.ecs.baylor.edu/~hamerly/software/europe_population_weighted_centers.txt).
The averaged 2-week temperatures and humidity preceding the surge dates were computed from https://rp5.
ru, which collects the archives of all airport weather stations in the world. For each country, an airport close
to the PWC was chosen (see supplementary Excel file). The average temperature and humidity were computed
between 8h00 to 20h00, outside this period, the population is mostly indoors.
School opening dates of 15 out of the 18 countries studied were found at https://eacea.ec.europa.eu/natio
nal-policies/eurydice/sites/eurydice/files/school_calendar_2020_21_0.pdf.
The theoretical sun UVB daily dose for vitamin D production, as a function of latitude and of the day of the
year, was derived from the digitalization of Fig. 1B from reference1.
Cliniques Universitaires Saint-Luc, 1200 Brussels, Belgium. email: stephan.walrand@uclouvain.be
Scientific Reports | (2021) 11:1981 | https://doi.org/10.1038/s41598-021-81419-w 1
Vol.:(0123456789)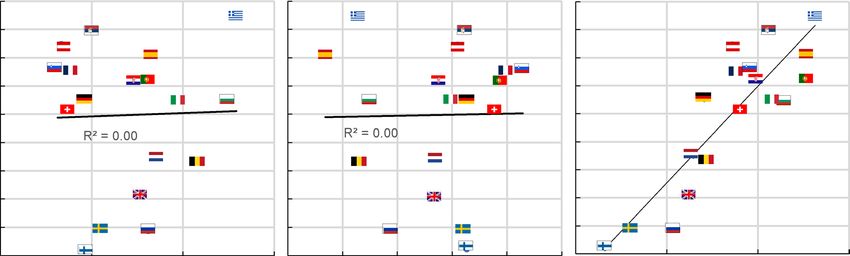
www.nature.com/scientificreports/
Figure 1. Typical examples of daily new COVID-19 cases (extracted from the statistics panel of the Google
home page when searching “COVID” at www.google.com, last accessed 8th November 2020). All curves exhibit
a clear surge in the growth rates.
The reinforcement dates of the safety measure were obtained from the Public Health and Social Measures
(PHSM) index of the WHO at https://who.maps.arcgis.com/apps/opsdashboard/index.html#/ead3c6475654481
ca51c248d52ab9c61.
All these data are in the supplementary Excel file.
Surge date determination. The date of the surge was automatically determined by fitting the two last
months of the daily new COVID-19 cases with the empirical model:
Nc e(αc +(βc −αc )l(t−tc ))t (1)
where l is the logistic function:
1
l(t − tc ) = (2)
1 + e−γ (t−tc )
tc is the date when the exponential coefficient, coming from the initial value αc , crosses the value αc +β
2 before
c
tending towards the final value βc when t → ∞. γ is the steepness of this changing. The date of the surge was
defined as the time when 10% of αc +β
2 was added to αc ; this choice corresponds to the date when Eq. (1) visually
c
becomes different from the monoexponential (see supplementary file). γ was assumed to be country independ-
ent, as we searched for an impact of latitude on its own. This further allows us to prevent overfitting of the data
noise by a steepness tuned for each country.
Note that as the exponential coefficient varies with time, the doubling time around the surge date is not simply
ln(2) divided by this coefficient.
Dynamic models of new daily cases. To evaluate the impact of UV insolation on the new daily case
dynamics, we consider the simple model:
dN(t)
= k(t)N(t) − ρN(t) (3)
dt
where N(t) is the total number of persons who have active SARS-CoV-2 at time t, its derivative is the new daily
cases, and k(t) is the mean effective contagiousness of an infected subject, which mainly depends on his coro-
navirus release in air and on materials, on the closeness and frequency of his contacts with other subjects; ρ is
the recovery rate.
The solution of Eq. (3) is:
Scientific Reports | (2021) 11:1981 | https://doi.org/10.1038/s41598-021-81419-w 2
Vol:.(1234567890)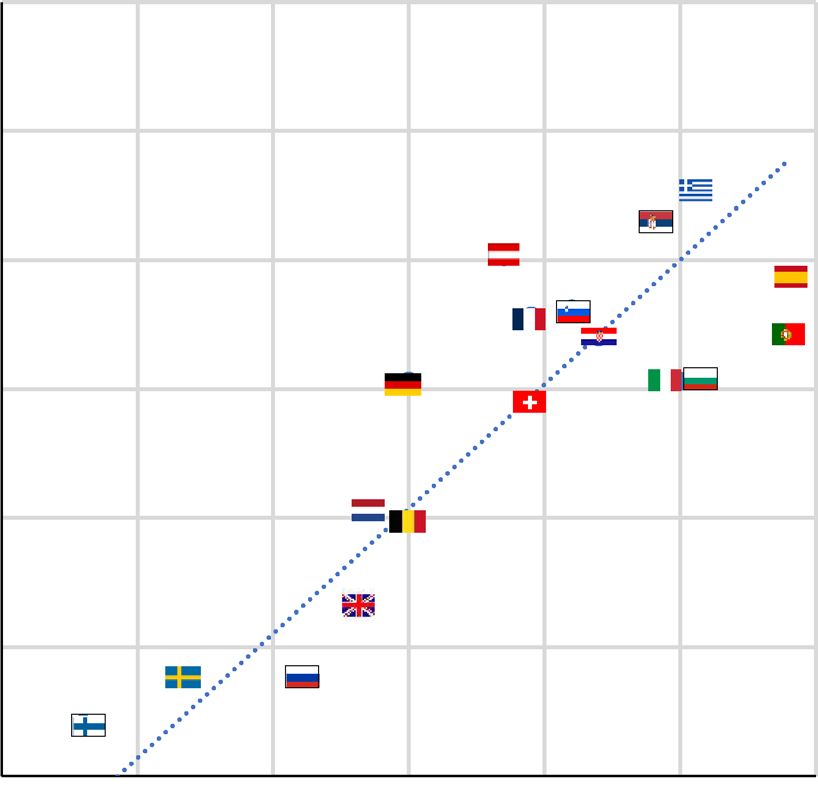
www.nature.com/scientificreports/
A B
0.8
sars-cov-2 active fraction
0.7
0.6
0.5
0.4
0.3
50 100 150 200 250
τ90 [min]
C D
exp. dN
dt
dN 100
daily new cases
daily new cases
100
dt
exp.
10 10
1 1
0 10 20 30 40 50 60 0 10 20 30 40 50 60
me[day]
me[day]
Figure 2. (A) Survival of the active SARS-CoV-2 fraction after 30 min of solar UV insolation as a function
of τ90. (B) Solid black line: acute respiratory track infection (ARTI) risk during cold and influenza epidemics
as a function of the 25(OH)D concentration (reprinted from3 according to the CC BY 4.0 licence terms (https
://creativecommons.org/licenses/by/4.0/); red and blue curves: power exponential (Eq. 8) and first point
monoexponential fits added by the present author. In both graphs, the corresponding date runs from left to
right. (C,D) Blue curve: corresponding new daily cases to (A,B) obtained by numerically integrating Eq. (4) (see
excel file). In both integrations, k0 was fitted to obtain a typical threefold increase in the last 10 days (see Fig. 1),
and ρ was neglected (surge phase). Black curve: mono-exponential curve.
t
′
′
dN(t) k(t )−ρ dt
= Nc (k(t) − ρ)e 0
(4)
dt
where Nc is the initial number of infected persons in country c.
If the contagiousness is constant, the daily new cases follow a monoexponential increase or decrease:
dN(t)
= Nc (k − ρ)e(k−ρ)t (5)
dt
We will consider two impacts of UV insolation: outdoor SARS-CoV-2 inactivation and blood 25-hydroxy-
vitamin D (25(OH)D) concentration.
Impact of outdoor SARS‑CoV‑2 inactivation by solar UV. The active fraction survival of SARS-
CoV-2 f. under a constant UV insolation R is governed by:
f (τ ) = e−αRτ (6)
where α is the solar UV sensitivity of SARS-CoV-2, and τ is the insolation duration. A recent detailed analysis2
shows that in Europe, τ90, i.e. the noon solar insolation duration needed to inactivate 90% of SARS-CoV-2,
approximatively linearly increases between August and October from 60 to 150 min for southern countries and
from 100 to 250 min for northern countries.
Considering this inactivation as the single effect varying k(t), we obtain:
τ
k1 (t) = k(0) e
−τ
90 (t)
ln(10)
(7)
where τ is the mean time between the infection of a material and the contact with this material by a noninfected
person.
Figure 2A shows a typical k1(t) curve for τ90 ranging from 60 to 250 min, and τ = 30 min (τ can be modified
in the supplementary Excel file) and figure 2C its corresponding daily new cases (Eq. 4).
Scientific Reports | (2021) 11:1981 | https://doi.org/10.1038/s41598-021-81419-w 3
Vol.:(0123456789)www.nature.com/scientificreports/
Country (ref) PWC lat. (deg) Population Type n ± std per month Age (year) Drop ± std (%)
Sweden4 59.0 Blood donors ≠ cohorts 45 ± 9 41 ± 13 22
Denmark5 55.9 Blood donors ≠ cohorts 16 ± ? 24–89 23
UK6 52.8 1958 birth Longitudinal 6789 45 ± 0 26 ± ?
Netherland7 52.1 Nurses Longitudinal 8 31 ± 3 26 ± 25
Poland8 51.7 Athletes ≠ cohorts 229 ± 55 25 ± 1 23
Table 1. Monthly seasonal 25(OH)D concentration studies. Right column: 25(OH)D concentration drop
between August and November.
Impact of blood (25(OH)D) concentration. A meta-analysis of 24 studies reporting the association
between 25(OH)D concentration and the risk or severity of acute respiratory track infection (ARTI) during cold
or influenza epidemics3 shows that the risk follows a power-exponential relation (Fig. 2B).
Assuming that COVID-19 risk similarly depends on 25(OH)D concentration and considering this risk
increase as the single effect varying k(t), we obtain
1.6
k2 (D(t)) = k(D(0)) e0.00069(90−D(t)) (8)
where D(t) is the 25(OH)D concentration expressed in nmol/L units at time t.
Figure 2D shows the corresponding daily new case (Eq. 4).
Studies in Europe4–8 reported a seasonal 25(OH)D concentration drop of 20–26% between August and Octo-
ber (Table 1). Two longitudinal studies6,7 followed one single cohort over 12 months, with one7 reporting the
25(OH)D concentration curves for each subject allowing a rough estimation of the intraindividual standard
deviation, giving a drop of 26 ± 25% in normal subjects (age 31 ± 3 years). This standard deviation could still be
higher in the country population with the presence of older and chronically ill subjects. As a result, more than
15% of the European active population could suffer from a 25(OH)D concentration decrease larger than 50%
from August to October. Assuming that the COVID-19 risk follows Fig. 2B and that the whole population has an
initial D = 90 nmol/L value, a rough estimation of the k(t) surge can be computed (see Excel sheet “vitD severity”
S-AA for the numerical integration result) as:
∞ 2
1 − (D−67)
(9)
k(Oct) = √ k(D)e 2×232 dD k Aug = 1.18 k(Aug)
2π 23 0
In the integral, lim k(D) = ∞ but due to the higher exponential power of the Gaussian distribution, i.e. 2,
D→0
versus that of k(D), i.e. 1.6, the integral does not diverge and can even be truncated at D = 0. The integration was
extended above the initial D = 90 nmol/L value because one patient in the cohort7 exhibited a concentration
increase rather than a drop.
Results
Table 2 shows the fitting results (all data and fitting processes are provided in the supplementary xlsx file). For
Sweden, the new daily cases were constant before August, preventing the computation of the β/α ratio. Although
that the parameters are accurately measured, they suffer from the limitations that, besides the latitude, they are
not population weighted.
Table 3 shows the reinforcement implemented during September and October of the existing safety meas-
ures (see country pages in Excel file to see the intensity level of each safety measure). With regard to the delay
between infection and contagiousness of a subject, only two reinforcements (in bold) could have delayed the
surge date. The abundance of measured reinforcements within the two weeks following the surge date provides
evidence of the surge threat.
Figure 3A,B clearly prove no correlation with temperature or humidity, while Fig. 3C clearly shows an impact
of country latitude.
Figure 4 clearly shows that the surge dates set on the sun UVB daily dose as a function of latitude demonstrate
an impact of the sun UVB daily dose.
Figure 5 shows that the day of the second wave surge is predicted well by the time when the sun UVB daily
dose of the country becomes lower than 30% of that at latitude 0°.
Discussion
Many studies support an impact of low 25(OH)D concentrations on respiratory impairment in coronavirus or
viral diseases9 and recently on the COVID-19 pandemic as well (see10 for a detailed review and analysis of 14
studies reporting such impacts). Low 25(OH)D concentrations are also more prevalent in populations at risk,
i.e. aged p eople11,12, obese p
atients13, people with coloured skin living in high latitude c ountries14 and diabetic
15
patients .
However, by comparing COVID-19 severity between different populations, determining whether the 25(OH)
D concentration is a real factor of COVID-19 severity or only a marker of another weakness that is the primary
severity factor can be challenging.
Scientific Reports | (2021) 11:1981 | https://doi.org/10.1038/s41598-021-81419-w 4
Vol:.(1234567890)www.nature.com/scientificreports/
Country School opening Temp (°C) Hum (%) PWC lat (deg) Surge start Day Solar UV (%) β/α
Greece 23 52 38.7 Oct 21 295 37 1.21
Portugal Sept 14 18 79 39.7 Oct 10 284 41 1.06
Spain 18 47 39.8 Oct 14 289 39 1.37
Bulgaria Sept 14 22 55 42.8 Oct 06 281 39 1.16
Italy Sept 14 20 70 42.9 Oct 06 281 39 1.02
Serbia Sept 01 15 72 43.8 Oct 18 293 32 1.13
Croatia Sept 01 17 68 45.3 Oct 10 284 34 1.06
Slovenia Sept 01 13 83 46.2 Oct 12 286 32 1.17
Switzerland Aug 17 14 78 47.0 Oct 04 279 34 1.25
France Sept 01 14 80 47.2 Oct 11 286 31 1.09
Austria Sept 08 13 71 47.8 Oct 16 290 28 1.10
Belgium Sept 01 21 53 50.8 Sept 25 270 34 1.02
Germany Aug 14 14 73 50.9 Oct 06 281 29 1.15
Netherland Sept 01 18 66 52.1 Sept 26 271 32 1.08
UK Sept 01 18 67 52.8 Sept 19 263 35 1.14
Russia 18 59 54.3 Sept 13 258 37 1.06
Sweden Sept 01 15 72 59.0 Sept 13 258 30
Finland Aug 14 15 73 61.8 Sept 10 254 27 1.11
Table 2. Temp, hum: mean country temperature and humidity during the 2 weeks preceding its COVID-19
surge date. PWC lat latitude of the country PWC, Sun UV theoretical sun UV daily dose at the surge date,
expressed as a fraction at the PWC latitude versus the latitude 0°.
Country Surge start Mask Schools Work Gathering Movement Int. travel
Greece Oct 21 Oct 16
Portugal Oct 10 Oct 22 Oct 22
Spain Oct 14 Oct 14 Oct 02
Bulgaria Oct 06 Oct 27 Oct 06 Oct 06 Oct 04
Italy Oct 06 Oct 05 Oct 13 Oct 22
Serbia Oct 18
Croatia Oct 10 Oct 27
Slovenia Oct 12 Oct 20 Oct 20 Oct 17 Oct 17
Switzerland Oct 04 Oct 25 Oct 22 Oct 22 Oct 22
France Oct 11 Sept 10 Oct 27 Oct 27 Oct 27
Austria Oct 16 Oct 15 Oct 15 Oct 15 Oct 15
Belgium Sept 25 Oct 05 Oct 15 Oct 15
Germany Oct 06 Oct 20 Oct 20 Oct 12 Oct 20
Netherland Sept 26 Oct 15 Sept 29 Oct 14
UK Sept 19 Oct 20 Oct 07 Sept 12 Sept 20
Russia Sept 13 Oct 15 Oct 02 Oct 05 Oct 11*
Sweden Sept 13 Oct 27
Finland Sept 10 Sept 30 Oct 22 Oct 12
Table 3. Safety measure reinforcement dates in the September–October period. Bold: reinforcement could
have reduced the surge. *Decrease of the safety measure.
Scientific Reports | (2021) 11:1981 | https://doi.org/10.1038/s41598-021-81419-w 5
Vol.:(0123456789)www.nature.com/scientificreports/
A B C
Oct 19
Oct 9
inflation date
Sep 29 R² = 0.77
Sep 19
Sep 09
10 15 20 2540 50 60 70 80 90 65 55 45 35
country temperature [C] country humidity [%] country latitude [degree]
Figure 3. COVID-19 surge date as a function of country mean temperature (A) and humidity (B) during the
2 preceding weeks and as a function of country PWC latitude (C), pointing to vitamin D as one of the primary
factors (flags link countries between graphs).
100
90
80
% sun UVB versus latitude
70
60
50
32°
40 38°7
39°75
42°85
43°8
30 45°3
y = 0.0651x + 15.824 46°2
0°
47°1
20 47°8
50°85
52°1
52°8
10 54°3
59°
62°
fit sun UV
0 UV lin fit
182 212 242 272 302 332 362
day of the year
Figure 4. Solid curves: theoretical sun UVB daily dose for vitamin D skin production under a clear sky
corresponding to the 18 PWC country latitudes plus the 31° latitude (derived from Fig. 1B i n1). Black circles:
country surge dates positioned on their corresponding latitude curve.
The date of the surge is an intrapopulation observation and has the benefit of being triggered only by a
parameter globally affecting this population. There is no correlation with temperature, humidity, or school
opening dates (see Excel file), but there is an impressive latitude correlation (Fig. 3). The remaining common
parameter affecting these populations monotonically at different times depending on latitude is the sun UV
daily dose (Fig. 4).
This UV index dependence was already observed for influenza e pidemics16, although the temperature depend-
ence appeared more important. A global seasonality study also evidenced a monthly correlation between other
pre-existing human seasonal coronavirus activities and temperature and h umidity17. However, this study did not
consider latitude as a confounding factor, and on a monthly scale, there is a correlation between temperature-
humidity and latitude. On the daily scale used in the present study, this correlation no longer exists as each
country is temporally affected by different wind directions. This feature allows us to clearly discriminate between
temperature-humidity and latitude impacts.
Decreasing sun UV insolation can impact COVID-19 dynamics in two ways: by decreasing outdoor SARS-
CoV-2 inactivation or by decreasing the population 25(OH)D concentration.
Scientific Reports | (2021) 11:1981 | https://doi.org/10.1038/s41598-021-81419-w 6
Vol:.(1234567890)www.nature.com/scientificreports/
310
300
observed day of boost
290
280
270
260 y = 0.9668x
R² = 0.9993
250
250 260 270 280 290 300 310
day of sun UV < 34%
Figure 5. Observed day of the second COVID-19 wave surge as a function of the day when the country sun
UVB daily dose drops lower than 34% of that at latitude 0°. Trendline forced to intercept (0,0).
However, many European countries were able to break the surge in November by implementing additional
safety rules. Activities where people cannot wear face masks, such as collective sports or relaxation in pubs and
restaurants, were forbidden, and festive activities where people often forget distancing recommendations were
forbidden. In contrast, the population continued their professional and outdoor relaxing activities wearing
face masks at work, in public transport, in itinerant outdoor markets (European use) and in parks. The success
of these rules supports the major role of airborne transport of SARS-CoV-2 versus contamination by outdoor
contact with infected material.
Equations (7, 8) clearly illustrate that the potential impacts on COVID-19 dynamics of outdoor SARS-CoV-2
inactivation and a decrease in 25(OH)D concentration are fundamentally different. Indeed, Fig. 2B indicates that
even if the 25(OH)D concentration slowly decreased after the summer solstice, its impact on contagiousness
becomes increasingly important with time and leads the dynamics to strongly diverge from a monoexponential
trend after a while as shown in Fig. 2D, which is in line with the data in October. In contrast, Fig. 2A indicates
that the impact of outdoor SARS-CoV-2 inactivation decrease on COVID-19 contagiousness becomes increas-
ingly less important with time, which should correspond to an increase in July–September, moving towards a
doubling time stabilisation, as shown in Fig. 2C.
Another feature discards the potential role of solar UV inactivation: in Europe, people spend the majority of
their time indoors, so even if contact with a contaminated surface can be a source of transmission, the contact
probability is lower outdoors than indoors where solar UV inactivation is absent. This is in line with a one week
recent study showing that outdoor contamination is much less frequent than indoor o nes18.
The obtained β/α ratios range from 1.02 to 1.37 (Table 2), which is in line with the estimated ratio of 1.18 as
Eq. (9) neglects any country dependence and was based on a small cohort (n = 8) follow-up.
The positive linear slope of the sun UVB threshold versus the country latitude (Fig. 4) is also in line with the
fact that, due to natural adaptation, populations have increasingly pigmented skin when the latitude decreases.
As a result, skin vitamin D production in northern populations is affected by the sun UVB decrease in a slower
manner than that of the southern populations. Figure 4 is also in line with the low population mortality observed
within ± 35° latitudes19 and reported in Hubei located at 31° latitude, because these regions are above the sun UV
daily dose 34% average threshold most of the year.
The present study thus suggests that a low 25(OH)D concentration is a contributing factor of COVID-19
severity, as already shown by previous studies10, which together constitute a convincing bundle of evidence. By
increasing the coronavirus load in the respiratory tract, the contagiousness in the population is also increased,
starting a chain reaction that explains the wave surge.
This study has three strengths. The utilisation of the date of the surge is not dependent on the differences
between the safety measures implemented in the countries but can only depend on the change in a global param-
eter affecting the whole country population. The correlation analysis on a daily scale prevents the interpretation
from being blurred by the seasonal latitude-climate correlation existing on a monthly scale. Using the relation
reported between ARTI and 25(OH)D concentration together with the reported seasonal 25(OH)D concentration
variation, the derived prediction of the daily new case slope increase is in line with the observation.
The study has several weakness. Some countries have a homogeneous population distributed at a few latitudes,
such as France, Germany, and Russia, which could twist or blur the correlation. Access to reported regional new
daily cases should be very valuable. The surge intensity analysis was performed using the 25(OH)D concentration
Scientific Reports | (2021) 11:1981 | https://doi.org/10.1038/s41598-021-81419-w 7
Vol.:(0123456789)www.nature.com/scientificreports/
reported in a small volunteer cohort. Observed autumn 25(OH)D concentration decrease for several countries
should be helpful to further increase the confidence in the vitamin D status contribution.
Conclusion
As already evidenced by previous correlation s tudies10, a low 25(OH)D concentration should be considered a
contributing factor to COVID-19 severity.
Europe and the northern USA are starting a long COVID-19 crisis this autumn, as they will return to a level
above the October sun UV daily dose only at the end of March 2021.
Measures to reduce the pandemic severity during the coming winter using controlled preventive vitamin D
supplementation should be c onsidered10,20.
Received: 10 November 2020; Accepted: 5 January 2021
References
1. Grigalavicius, M., Juzeniene, A., Baturaite, Z., Dahlback, A. & Moan, J. Biologically efficient solar radiation: Vitamin D production
and induction of cutaneous malignant melanoma. Dermato-endocrinology. 5, 150–158 (2013).
2. Herman, J., Biegel, B. & Huang, L. Inactivation times from 290 to 315 nm UVB in sunlight for SARS coronaviruses CoV and CoV-2
using OMI satellite data for the sunlit Earth. Air Qual. Atmos. Health. 1, 1–7 (2020).
3. Pham, H., Rahman, A., Majidi, A., Waterhouse, M. & Neale, R. E. Acute respiratory tract infection and 25-hydroxyvitamin D
concentration: A systematic review and meta-analysis. Int. J. Environ. Res. Public Health. 16, 3020 (2019).
4. Klingberg, E., Oleröd, G., Konar, J., Petzold, M. & Hammarsten, O. Seasonal variations in serum 25-hydroxy vitamin D levels in
a Swedish cohort. Endocrine 49, 800–808 (2015).
5. Moosgaard, B. et al. Vitamin D status, seasonal variations, parathyroid adenoma weight and bone mineral density in primary
hyperparathyroidism. Clin. Endocrinol. 63, 506–513 (2005).
6. Berry, D. J., Hesketh, K., Power, C. & Hyppönen, E. Vitamin D status has a linear association with seasonal infections and lung
function in British adults. Br. J. Nutr. 106, 1433–1440 (2011).
7. Juttmann, J. R., Visser, T. J., Buurman, C., De Kam, E. & Birkenhäger, J. C. Seasonal fluctuations in serum concentrations of vitamin
D metabolites in normal subjects. Br. Med. J. 282, 1349–1352 (1981).
8. Krzywanski, J. et al. Seasonal vitamin D status in Polish elite athletes in relation to sun exposure and oral supplementation. PLoS
ONE 11, e0164395 (2016).
9. Martineau, A. R. et al. Vitamin D supplementation to prevent acute respiratory infections: Individual participant data meta-analysis.
Health Technol. Assess. 23, 1–44 (2019).
10. Mercola, J., Grant, W. B. & Wagner, C. L. Evidence regarding vitamin D and risk of COVID-19 and its severity. Nutrients. 12, 3361
(2020).
11. Hyppönen, E. & Power, C. Hypovitaminosis D in British adults at age 45 y: Nationwide cohort study of dietary and lifestyle predic-
tors. Am. J. Clin. Nutr. 85, 860–868 (2007).
12. Ilie, P. C., Stefanescu, S. & Smith, L. The role of vitamin D in the prevention of coronavirus disease 2019 infection and mortality.
Aging Clin. Exp. Res. 6, 1–4 (2020).
13. Carter, S. J., Baranauskas, M. N. & Fly, A. D. Considerations for obesity, vitamin D, and physical activity amid the COVID-19
pandemic. Obesity 28, 1176–1177 (2020).
14. Boucher, B. J. Vitamin D status as a predictor of Covid-19 risk in Black, Asian and other ethnic minority groups in the UK. Diabetes/
Metab. Res. Rev. 1, 3375 (2020).
15. Payne, J. et al. Vitamin D insufficiency in diabetic retinopathy. Endocr. Pract. 18, 185–193 (2012).
16. Ianevski, A. et al. Low temperature and low UV indexes correlated with peaks of influenza virus activity in Northern Europe during
2010–2018. Viruses. 11, 207 (2019).
17. Li, Y., Wang, X. & Nair, H. Global seasonality of human seasonal coronaviruses: A clue for postpandemic circulating season of
severe acute respiratory syndrome coronavirus 2?. J. Infect. Dis. 222, 1090–1097 (2020).
18. Bulfone, T. C., Malekinejad, M., Rutherford, G. W. & Razani, N. Outdoor transmission of SARS-CoV-2 and other respiratory
viruses, a systematic review. J. Infect. Dis. 222, 1090–1097 (2020).
19. Rhodes, J. M., Subramanian, S., Laird, E. & Kenny, R. A. low population mortality from COVID-19 in countries south of latitude
35 degrees North supports vitamin D as a factor determining severity. Aliment. Pharmacol. Ther. 51, 1434–1437 (2020).
20. Lewiecki, E. M. Vitamin D and COVID-19: Is something better than nothing?. Osteoporosis Sarcopenia. https://doi.org/10.1016/j.
afos.2020.08.005 (2020).
Author contributions
S.W. is the single contributor.
Competing interests
The author declares no competing interests.
Additional information
Supplementary Information The online version contains supplementary material available at https://doi.
org/10.1038/s41598-021-81419-w.
Correspondence and requests for materials should be addressed to S.W.
Reprints and permissions information is available at www.nature.com/reprints.
Publisher’s note Springer Nature remains neutral with regard to jurisdictional claims in published maps and
institutional affiliations.
Scientific Reports | (2021) 11:1981 | https://doi.org/10.1038/s41598-021-81419-w 8
Vol:.(1234567890)www.nature.com/scientificreports/
Open Access This article is licensed under a Creative Commons Attribution 4.0 International
License, which permits use, sharing, adaptation, distribution and reproduction in any medium or
format, as long as you give appropriate credit to the original author(s) and the source, provide a link to the
Creative Commons licence, and indicate if changes were made. The images or other third party material in this
article are included in the article’s Creative Commons licence, unless indicated otherwise in a credit line to the
material. If material is not included in the article’s Creative Commons licence and your intended use is not
permitted by statutory regulation or exceeds the permitted use, you will need to obtain permission directly from
the copyright holder. To view a copy of this licence, visit http://creativecommons.org/licenses/by/4.0/.
© The Author(s) 2021
Scientific Reports | (2021) 11:1981 | https://doi.org/10.1038/s41598-021-81419-w 9
Vol.:(0123456789)You can also read


