BACK BAY STAKEHOLDERS' REPORT - SPRING 2019 - Steven Cohen Team
←
→
Page content transcription
If your browser does not render page correctly, please read the page content below
BACK BAY
STAKEHOLDERS’ REPORT
              SPRING 2019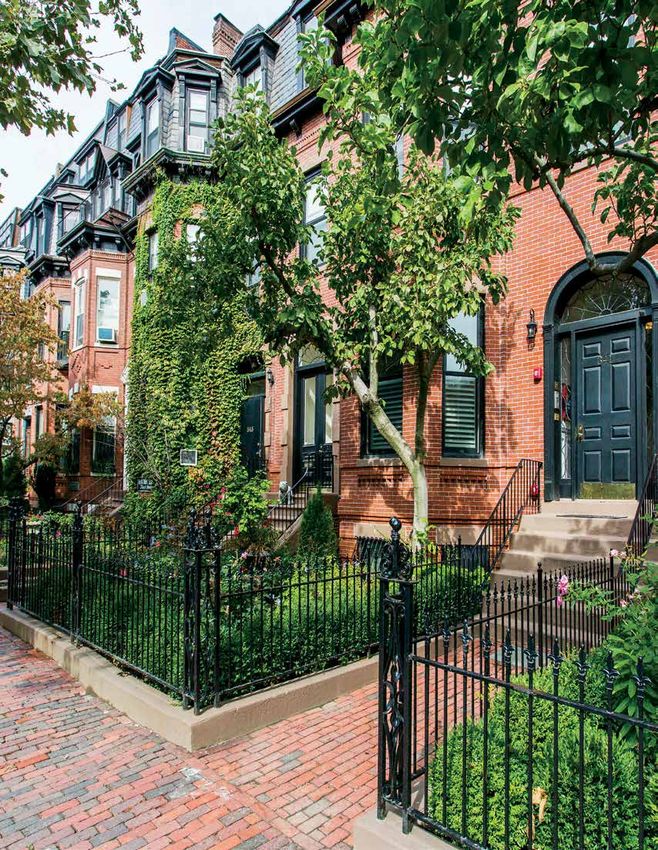
For all your real estate needs, call the best. Check
out our testimonials on Zillow and Yelp, then call
the real estate economists of choice.

CONTACT THE STEVEN COHEN TEAM
607 Boylston Street #500   1313 Washington Street #115A
Boston, MA 02116           Boston, MA 02118

617-861-3636
www.stevencohenteam.com
info@stevencohenteam.com

Subscribe to our Stakeholders’ Reports at
stevencohenteam.com/publications
BACK BAY STAKEHOLDERS’ REPORT                                      1

MARKET ANALYSIS
What you Need to Know About the 2020 Census ............. 2

America’s Most Profitable Markets .............................................4

30-year mortgages ............................................................................ 5

Housing Boston 2030 .......................................................................6

Boston’s Top 10 Neighborhoods.................................................. 8

Focus on the Back Bay ................................................................... 10

Top 20 Most Expensive Back Bay Sales for 2018 ................11

Notable Back Bay Sale ................................................................... 14

COMMUNITY FEATURES
Meet a Back Bay Building: The Vendome ............................. 16

Big City Gardens ................................................................................18

Back Bay Social Calendar: Spring 2019 ................................. 20

THE BACK BAY REAL ESTATE
ECONOMISTS OF CHOICE
The Steven Cohen Team .................................................................12

Your Buyer Agent and You ...........................................................22

Market Movement Index ............................................................... 24

Sunday Open House Guide ..........................................................25

COVER ART Designed by Boston-based illustrator and jewelry designer Belle Hornblower (www.bellepepperboston.com).
Commissioned for proprietary use by the Steven Cohen Team. If you’re interested in purchasing a print, please call us at
617-861-3636 or email info@stevencohenteam.com.
2   STEVEN COHEN TEAM

    WHAT YOU NEED TO KNOW
    ABOUT THE 2020 CENSUS
    TECHNOLOGY TAKES THE STAGE
    We all have a general idea of the census as a comprehensive nationwide government-con-
    ducted survey that is conducted once every ten years. But the results of that survey are
    much more far-reaching than one would imagine. Although the 2020 Census may seem far
    off in time, it’s worth noting that preparations for it began in 2017, and the data that will
    be gathered will be analyzed well into 2023. As the Census Bureau begins opening Early
    Area Census Offices (ACOs) to oversee address canvassing, it’s worth taking a moment to
    learn exactly in what ways the census impacts our communities, and what we have to look
    forward to over the next few years.

    The primary constitutional purpose for the decennial census is to determine how many
    congressional representatives each state will have for the next decade, and to ensure
    equal representation in the redistricting process. It directly impacts the distribution of
    $800 billion in federal investments across states, counties, and cities, and provides the
    most reliable and complete data for research, decision-making, and planning for both the
    public and private sectors. A few of the ways our communities rely on census data include
    infrastructure and transportation planning, the characterization of built structures for
    zoning and permitting processes, the location of retail outlets and logistics facilities, and
    forecasting business sales and growth projections.

    In 1790, U.S. Marshals counted fewer than 4 million people through simple paper tallies.
    Today, the U.S. Census Bureau prepares to hire as many as 500,000 temporary workers to
    count more than 330 million people in 2020. Suffice it to say, the process has come a long
    way since its early days. More than ever, technology plays a central role, as the 2020 Census
    will be the first to offer options for internet and phone responses. Lead-up activities like
    aerial imaging software from the National Geospatial Intelligence Agency and other agencies
    will supplant a large portion of costlier in-field activities, such as in-person canvassing of
    every street and road to finalize address files. Enumerators, who will go door-to-door to
    non-responding households, will be equipped with smart devices and visits will be con-
    ducted digitally instead of with pen and paper. This will transmit collected data in real
    time directly to the Census Bureau, which houses some of the most secure servers within
    the federal government.

    Responders’ personally identifiable information (PII) is protected by law and will not be
    shared outside of the Census Bureau. It will only be used to produce statistical information,
BACK BAY STAKEHOLDERS’ REPORT                                           3

and no other government agency or court will see or use it. In addition, the complete
census questionnaire will be available in 12 languages other than English, and lan-
guage guides and glossaries will be available in 50 non-English languages, plus Braille.

2020 CENSUS OPERATIONS TIMELINE

  January–February 2019                       Bureau begins opening 40 Early Area Census Offices (ACOs) to oversee address canvassing.

  Spring 2019                                 Bureau begins recruiting in-field address canvassers.

  April 2019–January 2020                     Bureau works with local governments to include addresses of new housing stock expected to be
                                              closed to the elements by Census Day.

  June–August 2019                            Remaining ACOs open.

  August–October 2019                         Bureau conducts local in-field canvassing, covering about 30% of addresses, primarily in high-growth
                                              and less-stable areas.

  November 2019                               Bureau begins the process of hiring 500,000 enumerators and other field staff for peak census
                                              operations. Census communications campaign begins.

  March 2020                                  Peak operations in cities begin, self-response starts.

  February–April 2020                         Census staff contact (February) and then enumerate (April) group facilities, such as college dorms,
                                              skilled nursing homes, and prisons. An effort is made to enumerate persons in Targeted Non-sheltered
                                              Outdoor Locations (TNSOLs). Starting in late 2019, Census Bureau staff will work with local officials
                                              to identify these locations.

  May 2020–July 2020                          Nonresponse Follow-Up (NRFU). Bureau conducts in-person visits (“door-to-door knocking”), and
                                              uses administrative records and other methods to fill in gaps from households that don’t self-respond.

  November 2020                               Bureau completes processing of census data.

  December 2020                               Bureau reports state population totals and resulting congressional appointment to the President
                                              by December 31.

  February–March 2021                         States receive detailed population counts, by voting age, race, and ethnicity, for redistricting purposes.

  Spring 2021                                 Bureau begins releasing detailed population and characteristics data for all government units,
                                              including cities, on a flow basis.

  June 2021– June 2023                        Bureau will provide an opportunity for local governments to challenge the accuracy of their
                                              final 2020 Census counts. Revised census counts are not used for congressional reapportionment
                                              or redistricting

  For more information, contact one of the Census Bureau’s Northeastern regional offices:
  NEW YORK REGIONAL OFFICE — 32 Old Slip, 9th Floor, New York, NY 10005   • 212-584-4300 or 1-800-991-2520 • FAX: 212-584-3402
  • TDD: 212-478-4793 • EMAIL: New.York.Regional.Office@census.gov
  PHILADELPHIA REGIONAL OFFICE — 100 South Independence Mall West, Suite 410, Philadelphia, PA 19106-2320      • 215-717-1800 or 1-800-262-4236
  • FAX: 215-717-0755 • TDD: 215-717-0894 • EMAIL: Philadelphia.Regional.Office@census.gov

Source: National League of Cities (NLC)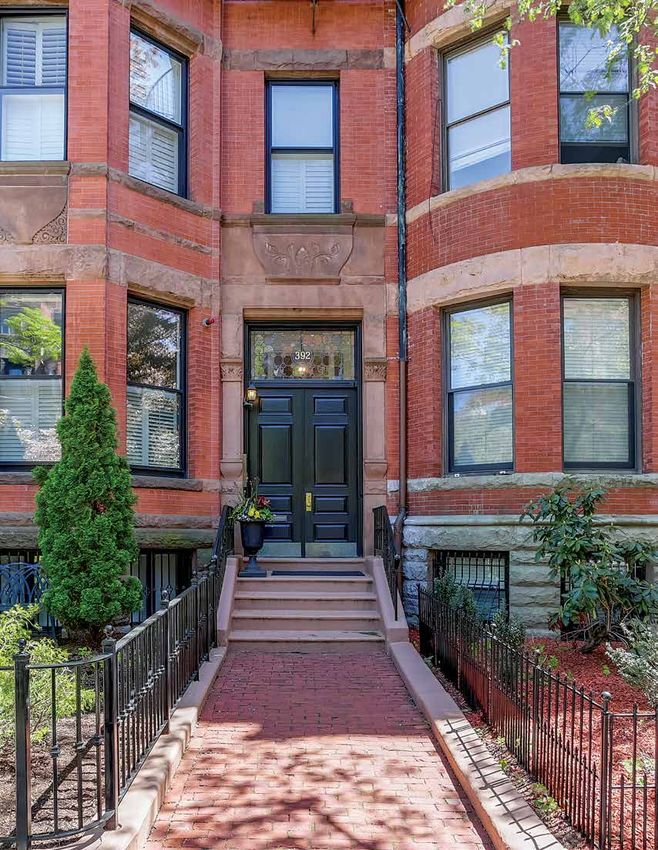
4   STEVEN COHEN TEAM

    AMERICA’S MOST
    ROBUST MARKETS
    BOSTON ONE OF TOP 10 HOUSING MARKETS
    POISED TO RULE 2019                                                                          1. Lakeland, FL
                                                                                                    MEDIAN LIST PRICE: $224,950
                                                                                                    PREDICTED SALES GROWTH: 5%
    Nationally, annual price spikes are waning, more properties are hitting the market,
                                                                                                    PREDICTED PRICE GROWTH: 7.4%
    and there are fewer buyers to compete with. In short, the real estate market is slowing
    down. However, according to Realtor.com, there are still housing markets expected to         2. Grand Rapids, MI
                                                                                                    MEDIAN LIST PRICE: $278,750
    outperform the national average in 2019. Based on the number of sales of existing homes
                                                                                                    PREDICTED SALES GROWTH: 4%
    and their prices, the amount of new home construction, local economies, population              PREDICTED PRICE GROWTH: 8.2%
    trends, unemployment rates, median household incomes, and a host of other factors,
                                                                                                 3. El Paso, TX
    this is the list of the top 10 superstar metropolitan areas where both the number of            MEDIAN LIST PRICE: $175,050
    sales and prices are expected to jump, bucking the national trend. It’s not surprising to       PREDICTED SALES GROWTH: 7.9%
    see Boston on that list. The city limits construction in several of its downtown historic       PREDICTED PRICE GROWTH: 2.5%

    districts, so the limited supply of homes for sale keeps the market hot and the prices       4. Chattanooga, TN
    up. In addition, more millennials have been drawn to Boston over the past few years,            MEDIAN LIST PRICE: $269,950
    attracted not only to standby industries like education and health care, but also big           PREDICTED SALES GROWTH: 5.2%
                                                                                                    PREDICTED PRICE GROWTH: 4.3%
    growth in the tech sector.
                                                                                                 5. Phoenix, AZ
                                TOP 10 HOUSING MARKETS                                              MEDIAN LIST PRICE: $329,975
                                                                                                    PREDICTED SALES GROWTH: 3.6%
                                                                                                    PREDICTED PRICE GROWTH: 5.6%

                                                                                                 6. Bridgeport, CT
                                                                                                    MEDIAN LIST PRICE: $749,050
                                                                                                    PREDICTE D SALES GROWTH: 5%
        8    BOISE CITY, ID

                                                            2
                                                                           BOSTON
                                                                                          10        PREDICTED PRICE GROWTH: 4%

                                                                                      6          7. Las Vegas, NV
                                                                                                    MEDIAN LIST PRICE: $320,049
                                                      GRAND RAPIDS, MI
                                                                                BRIDGEPORT, CT
                                                                                                    PREDICTED SALES GROWTH: 0.9%
                                                                                                    PREDICTED PRICE GROWTH: 7.9%

         7   LAS VEGAS, NV
                                                                4
                                                                                                 8. Boise City, ID
                                                                                                    MEDIAN LIST PRICE: $330,045
                                                        CHATTANOOGA, TN                             PREDICTED SALES GROWTH: 1.5%
             5    PHOENIX, AZ                                                                       PREDICTED PRICE GROWTH: 6.9%

                                                                                                 9. Miami, FL
                                                                                                    MEDIAN LIST PRICE: $385,050

                                3   EL PASO, TX
                                                                                                    PREDICTED SALES GROWTH: 3.3%

                                                         LAKELAND, FL     1                         PREDICTED PRICE GROWTH: 5%

                                                                                                 10. BOSTON, MA
                                                                    MIAMI, FL
                                                                                9                    MEDIAN LIST PRICE: $500,675
                                                                                                     PREDICTED SALES GROWTH: 3.6%
                                                                                                     PREDICTED PRICE GROWTH: 4.6%

    Sources: Realtor.com, SFGate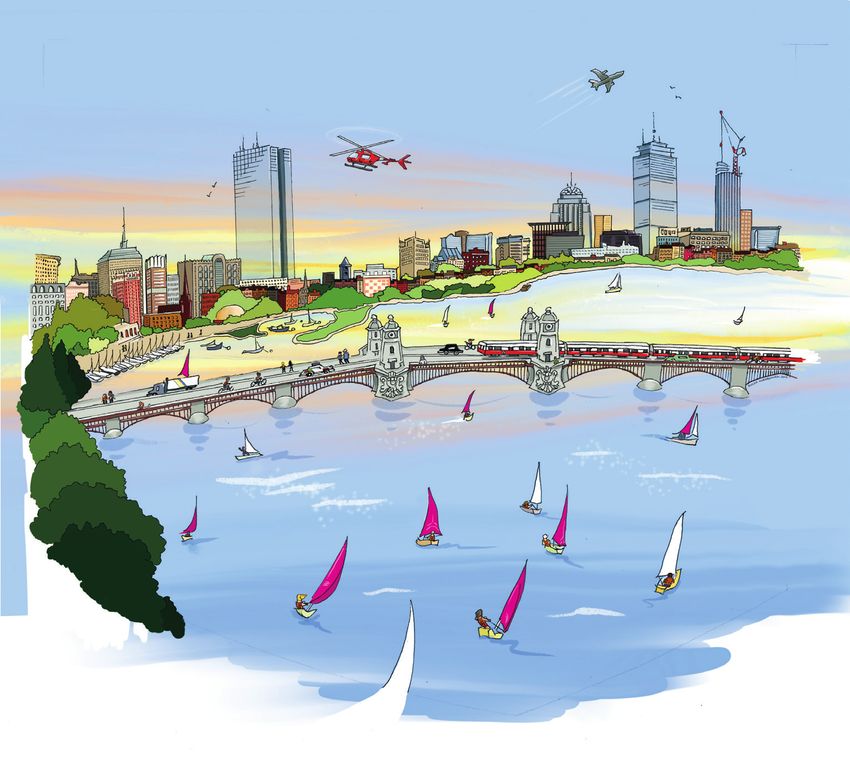
BACK BAY STAKEHOLDERS’ REPORT        5

  MORTGAGE RATES
  While interest rates climbed steadily throughout the past year, volatility in the stock mar-
  ket and tame inflation reports prompted the Fed to take a breather from its campaign to
  raise rates to more normal levels. According to Fed chairman Jerome Powell, the goal was
  to gradually move to a place where interest rates would be neutral, meaning they would
  neither fuel the economy, nor inhibit it. However, when the central bank boosted rates by
  another quarter point in December, it also cut the number of expected rate hikes for 2019
  from three to two. In addition, the Fed has made it clear it would take investors concerns
  to heart and be flexible and patient when charting the course of interest rates.

                                    30-Year Fixed-Rate Mortgages 1975 to 2018
20%
                                                                       2018

                                          4.9
15%                                       4.7
                                          4.5
                                          4.3
                                      30-Year Fixed-Rate Mortgages 1975 to 2018
10%                                        4.1
   20%
                                          3.9
                                          3.7
5%                                               Jan Feb Mar Apr May Jun Jul Aug Sep Oct Nov Dec
  15%

0%
    1975
  10%             1980     1985           1990          1995        2000          2005     2010    2015

      5%

      0%
           1975     1980     1985           1990          1995       2000         2005     2010    2015

  Source: Freddie Mac, Boston Globe
6   STEVEN COHEN TEAM

    HOUSING 2030
    WHAT’S COMING TO BOSTON
    OVER THE NEXT DECADE
    High-paying jobs and the increasing draw of city living mean that Boston has remained
    absurdly popular. As a result, the city has grown even faster than expected. Boston
    will have 759,727 residents by 2030, up from a 2030 estimate of 709,400 four years ago.
    That’s the equivalent of adding a Somerville to Boston in a little over a decade. Mayor
    Marty Walsh’s 2014 housing plan called for 53,000 new units by 2030, a pace the city
    is actually on track to beat, but that number is now obsolete. Even the largest building
    boom Boston has experienced in generations, with 18,000 units of housing opened since
    2011, isn’t enough to keep pace with the demand to live in the city.

    In response, the Walsh administration released a Housing Boston 2030 Update, increasing
    its target by 30% to 69,000 units by 2030. There will also be added emphasis on creating
    affordable housing and protecting lower-income renters at risk of eviction, as 22% of the
    homes will be set at rents affordable to lower- and middle-income residents. Accord-
    ing to The Boston Globe, officials estimate that subsidizing that amount of affordable
    housing will cost the city $50 million annually, along with state and federal money.
    It will also require funding for a new program to help buy 1,000 existing apartments
    and set them at affordable rents. However, as Boston is running low on sites for major
    complexes, particularly ones in or close to its downtown core, the plan will put most
    of the new housing in the outer neighborhoods, where land costs are lower. The focus
    would be on a few areas — from Suffolk Downs in East Boston, to the Readville section
    of Hyde Park — targeted for major development in the city’s Imagine Boston 2030 plan.

        The September 2018 Housing Boston 2030 Update focused on three major
        housing affordability categories:

        ! PRODUCTION OF NEW HOUSING
        !   Build 69,000 new housing units across a range of incomes by 2030.

        !   Redirect development pressures away from core neighborhoods and toward oppor-
            tunities for growth.

        !   Create 15,820 income-restricted long term affordable homes, bringing the total
            number of income restricted homes in Boston to nearly 70,000.
BACK BAY STAKEHOLDERS’ REPORT        7

       " PRESERVATION OF EXISTING AFFORDABLE HOUSING
       !   Retrain Boston’s existing income-restricted/affordable housing, preserving 97% of
           all affordable housing units and 84% of the 4,000 units in privately-owned affordable
           units at highest risk of being lost.

       !   Rebuild Boston’s public housing by re-developing and renovating up to 4,500 BHD
           units with both public and private financing.

       # PROTECTION OF THOSE HOUSEHOLDS MOST AT RISK
       !   Purchase 1,000 rental housing units from the speculative market and income-restrict
           them via an expanded Acquisition Opportunity Program, to be counted as part of the
           15,820 affordable unit production plan.

       !   Prevent evictions and promote housing stability.

       !   Strengthen communities through homeownership by increasing the resources the
           City and others provide to first time homebuyers, offering additional pathways for
           moderate and middle income families to become homeowners in Boston.

THE BIGGER PICTURE
It’s important to note that the city’s goal alone won’t be enough to alleviate the crisis, as
the housing market is regional. If prices are going to ease, more housing will be needed
in suburbs that build at a much slower rate than Boston. This is where the Metro Mayors
Coalition (MMC) comes in. It is a group of 15 Boston-area communities — Arlington, Boston,
Braintree, Brookline, Cambridge, Chelsea, Everett, Malden, Medford, Melrose, Newton,
Quincy, Revere, Somerville, and Winthrop — dedicated to exchanging information and
creating solutions for common problems, including housing.

The 15 cities and towns that make up the coalition have added nearly 110,000 residents
and 148,000 new jobs since 2010, but they have permitted only 32,500 new housing units.
Meanwhile, the region is on track to add 235,000 new jobs from 2015 to 2030. Combined
with the imminent retirement of the area’s Baby Boomers, this robust economic growth will
attract hundreds of new workers to fill the available jobs. The MMC has set its own goal, as
it says that eastern Massachusetts will need 435,000 new units by 2040.

Sources: Boston Planning and Development Agency (BPDA), City of Boston “Housing Boston 2030
Update”, The Boston Globe, Metro Mayors Coalition (MMC)
8 STEVEN COHEN TEAM
BOSTON’S TOP 10
NEIGHBORHOODS
BY NUMBER OF SALES AND MEDIAN SALES PRICE
Back Bay remains one of Boston’s top-performing neighborhoods. Even though the
number of sales rose by only 1% from 2017 to 2018, the area’s median sale price
increased by 11%.
Top 10 Boston Neighborhoods by Number of Sales Top 10 Boston Neighborhoods by Number of Sales
2018 vs. 2017 2018 vs. 2017
753
South Boston South Boston 716
632 632
South End 598 South End 598
420 420
BACK BAY 412 BACK BAY 412
312 312
Charlestown 317 Charlestown 317
Seaport 235 235
76 Seaport 76
Fenway 214 214
167 Fenway 167
Waterfront 174 174
170 Waterfront 170
Midtown 172 172
208 Midtown 208
Beacon Hill 150 150
185
Beacon Hill
185
North End 90 90
70
North End
70
0 200 400 600 0 800 200 400 600
2018 2018
Top 10 Boston Neighborhoods by Median Sales Price
2017 2018 vs. 2017 2017
Seaport $1,625,000
$945,000
Midtown $1,289,000
$1,240,000
BACK BAY $1,195,500
$1,071,500
Waterfront $990,500
$1,017,000
South End $990,000
$925,000
Fenway $923,700
$595,000
Beacon Hill $780,000
$920,000
South Boston $740,000
$649,500
$720,500
Charlestown $683,500
$679,500
West End $722,500
$0 $500,000 $1,000,000 $1,500,000
2017 2016
Source: LINK BostonBACK BAY STAKEHOLDERS’ REPORT 9
HOME SALES BY
HOUSING TYPE
Top 5 Neighborhoods for Condominiums, 2018
South Boston 753
South End 598
Seaport 412
BACK BAY 317
The median sale
Charlestown 214
price for a Back Bay
0 200 400 600 condominium was
$1,195,500, an
11.2% increase
year-over-year.
Top 5 Neighborhoods for Single Family Homes, 2018
South Boston 87
Jamaica Plain 75
Charlestown 70
South End 35
Beacon Hill 20
0 25 50 75
Back Bay just missed the list. Six single
family homes sold in the neighborhood
this past year at a median sale price of
$4,850,000.
Source: LINK Boston10 STEVEN COHEN TEAM
FOCUS ON BACK BAY
Number of sales and median sale prices in Back Bay increased across the board year
over year. The median sale price for the biggest seller, two-bedroom homes, increased
by 5% from 2017 to 2018. Even one-bedroom homes, which decreased in number of sales
by 11%, rose by 5% in median sale price.
Back Bay Median Selling Price by Square Footage, 2018 Back Bay Sales by Square Footage, 2018
700< $575,000
>2,400
701-1,000 $882,500 1,801–2,400 48 31 $4,695,000
$0 $2147483
Back Bay Median Selling Price by Number of Bedrooms, 2018 Back Bay Number of Sales by
Number of Bedrooms, 2018
Studio $522,500
1 Bed $710,000 Studio
3+ BR 37
72
2 Bed $1,465,000
1 BR
3+ Bed $3,200,000 130
$0 $2147483
2 BR
181
Source: LINK BostonBACK BAY STAKEHOLDERS’ REPORT 11
TOP 20 MOST EXPENSIVE
BACK BAY SALES IN 2018
ADDRESS SALE PRICE PRICE/SF TYPE
1 4 Marlborough Street LL/PH $12,550,000 $1,547 CONDOMINIUM
2 305 Commonwealth Avenue #1/4 $10,900,000 $2,706 CONDOMINIUM
Zero Marlborough @ 6 Arlington
3 $10,400,000 $2,172 CONDOMINIUM
Street PH
4 157-159 Newbury Street #1 $10,000,000 $2,105 CONDOMINIUM
5 344 Beacon Street $9,235,000 $1,423 SINGLE FAMILY
Belvedere
6 $8,750,000 $2,860 CONDOMINIUM
@ 100 Belvidere Street #11D
Trinity Place
7 $8,000,000 $1,861 CONDOMINIUM
@ 1 Huntington Avenue PH1801
Four Seasons @ 220 Boylston
8 $7,945,000 $2,613 CONDOMINIUM
Street #1111
The Carlton House
9 $7,682,000 $3,022 CONDOMINIUM
@ 2 Commonwealth Avenue #16-F
10 100 Beacon Street #7 $6,800,000 $1,643 CONDOMINIUM
11 Heritage @ 300 Boylston Street $6,500,000 $2,833 CONDOMINIUM
12 381 Beacon Street $6,175,000 $1,270 SINGLE FAMILY
13 90 Marlborough street #7 $6,150,000 $2,227 CONDOMINIUM
Four Seasons @ 220 Boylston
14 $5,575,000 $2,040 CONDOMINIUM
Street #1206/08
Belvedere @ 100 Belvidere Street
15 $5,500,000 $2,384 CONDOMINIUM
#10A
16 16 Marlborough Street $5,500,000 $886 MULTI FAMILY
Four Seasons @ 220 Boylston
17 $5,400,000 $1,979 CONDOMINIUM
Street #1214/16
18 169 Marlborough Street #3 $5,395,000 $2,061 CONDOMINIUM
The Carlton House
19 $5,350,000 $2,126 CONDOMINIUM
@ 2 Commonwealth Avenue #11-H
20 169 Marlborough Street #1 $5,210,000 $1,899 CONDOMINIUM
Average price per square foot among the 20 most
expensive Back Bay sales for Q2 of 2018: $2,083
Source: LINK Boston12 STEVEN COHEN TEAM
LISTING AGENT AND LISTING
TEAM LEADER AGENT
Steven Zach
Cohen Jay
BUYER
SPECIALISTS
MEET THE
REAL ESTATE Barrie Nicole
ECONOMISTS
Stavis Spencer
RENTAL
OF CHOICE SPECIALISTS
The Steven Cohen Team provides expert
insight, guidance and representation for
discerning residential property buyers and
sellers in Boston’s Back Bay and adjacent neigh- Josh Lisa Michael
borhoods. Our unmatched experience in the Leibowitz Cavicchioli O’Driscoll
local real estate market, long-term approach
to customer service, and coordinated team- OPERATIONS
MANAGER
work make us an industry leader in Back Bay
and beyond.
The team stands ready to answer your real
estate questions! TRANSACTION
COORDINATOR
""""" """"" """"" Tim Margaret
McCarthy Marder
MARKETING &
COMMUNICATION
Bruce Anastasia Ronnie
Withey Yefremova LeeSOUTH
BACK END
BAY STAKEHOLDERS’ REPORT 13
THE STEVEN COHEN TEAM IN 2018
A YEAR IN REVIEW
#1 among Keller Williams associates in the Boston-Metro market center*
#42 among 186,000+ Keller Williams Realty International associates worldwide*
$160+ million in sales volume in 2018*
#1 Team by Transaction Volume in Massachusetts, as advertised in the Wall street Journal
and America’s Best Real Estate Agents**
#141 Team by Transaction Volume nationwide in The Thousand, as advertised in the Wall
Street Journal and America’s Best Real Estate Agents**
Top 5% Producer by Sales Volume for agents in the Boston area***
*Source: Keller Williams Realty **Source: Real Trends ***Source: Best of HomeLight 2018
CIENT TESTIMONIALS
“...embodied “...transparent,
the utmost in supportive,
professionalism, “...absolutely and made the
“...made these
responsiveness, recommend process seamless
first-time home
and attention the folks at the from start to
buyers seem
to detail…” Steven Cohen finish…”
like experts…”
Team…”
“...simply put, they “...an incredible
were the best…” “...known for their integrity, their experience…”
commitment and their ability to
work collaboratively with their
clients and with other brokers…”
For additional Steven Cohen Team client testimonials, visit stevencohenteam.com/testimonials14 STEVEN COHEN TEAM
NOTABLE STEVEN COHEN
TEAM BACK BAY SALE
392 MARLBOROUGH STREET #3
Direct elevator access from the entrance or the parking space to this beautiful 3 bed-
room penthouse duplex in the historic Back Bay. A gracious, light-filled entry leads
to a wonderful open kitchen/family room perfect for entertaining. The chef’s kitchen
features granite countertops with a breakfast island and state-of-the-art stainless steel
appliances including 6-burner DCS gas range, Sub Zero refrigerator, Bosch dishwash-
er, and a wine cooler. There is a large dining area in the bay window, lovely custom
built-ins, a sitting area, and a gas fireplace complete the room. The living room faces
peaceful, tree-lined Marlborough Street and includes a large bay window, a gas fireplace,
and an adjacent office with built-ins. A sweeping staircase leads to the bedroom level
featuring 3 bedrooms, 2 bathrooms, laundry, and a wet bar. The spacious master suite
has Venetian plaster tray ceiling, his/her closets, and en suite marble bath. Brazilian
cherry floors and generous storage throughout. A full staircase up to huge mahogany
roof deck offering panoramic skyline views. Includes deeded parking.
SALE PRICE: $3,500,000 SIZE: 2,590 sq. ft.
BEDROOMS: 3 PARKING: 1 Deeded
BATHROOMS: 2 full, 1 half BUILT: 1899BACK BAY STAKEHOLDERS’ REPORT 15
16   STEVEN COHEN TEAM

     MEET A BACK BAY BUILDING
     THE STORIED PAST OF THE VENDOME AT 160 COMMON-
     WEALTH AVENUE
     The original Hotel Vendome at the corner of Commonwealth Avenue and Dartmouth Street was
     designed by architect William G. Peterson for wealthy insurance agent and real estate investor
     Charles Austin Wood and his wife, Caroline Elizabeth (Wilson) Wood. Built as a “family hotel”
     meant primarily to serve permanent residents rather than transient guests, it was completed
     in 1872. The Hotel Vendome featured an Italian
     marble facade, a dining room, billiard and recep-
     tion rooms, an office, and a conservatory filled
     with birds and flowers. The striking interior
     was accented by white and colored marbles, and
     walnut finished halls and stairways. The overall
     effect was tasteful, with a harmonious color
     scheme and elegant design evident in all parts
     of the structure. Residents were offered all the
     conveniences of hotel life at the time, including
     speaking tubes, annunciators, and an elevator.

     Lumber merchant and real estate investor
     Charles Whitney and his wife, Sarah Kimball
     (Bradley) Whitney purchased the Hotel Vendome
     in 1879 and expanded the original building with
     a 156 foot addition to the west on Commonwealth
     Avenue. The new structure was designed by Ober
     and Rand and was completed in 1882. Archi-
     tect J. Foster Ober outfitted the addition with
     a Tuckahoe marble facade, central steam, two
     passenger elevators, elegant, grand parlors, an
     exquisitely finished rotunda, and even a special
     entrance for ladies on Dartmouth Street. There
     were five dining rooms, and a great dining hall
     with seats for 250 people decorated with fres-
     co-work and a beautiful frieze, richly adorned
     with mirrors, carved mahogany, and cherry
     wood. After the expansion, the hotel served both
     transient guests and permanent residents. The
     first commercial installation of electric lights
     in the city was made here.
BACK BAY STAKEHOLDERS’ REPORT 17
For decades, the Vendome was Boston’s premiere hotel. It hosted most of the notables who
visited the city, including President Ulysses S. Grant and renowned French stage actress
Sarah Bernhardt. The Vendome stood as the finest evocation of the Second Empire in Boston,
stylistically reminiscent of French Renaissance architecture, its facade incised with elaborate,
Neo-Grec details. However, a series of small fires in the 1960s would serve as foreshadowing
of the building’s future.
The last time the Vendome was certified as a hotel was December 31, 1969, at which time the
required certificate, issued by the Division of Inspection from the Massachusetts Department
of Public Safety was revoked because of recent fire damage and the lack of proper rehabilita-
tion and maintenance of the structure. In 1971, the building was sold to real estate developer
Pasqualle Franchi, who opened a restaurant called cafe Vendome on the first floor, and began
renovating the remaining hotel into condominiums and a shopping mall.
On June 17, 1972, a worker discovered that a
fire had begun in an enclosed space between
the third and fourth floors. A total of 16 en-
gine companies, five ladder companies, two
aerial towers, and a heavy rescue company
responded. The fire was brought largely under
control by late afternoon, when all but five
floors of a 40-by-45 foot section at the south-
east corner of the building collapsed burying
Ladder 15 truck and 17 firefighters beneath
a two-story pile of debris. Eight firefighters
were injured, nine lost their lives. It was the
worst firefighter tragedy in Boston history.
While the cause of the fire remains unknown,
the collapse was attributed to the failure of
an overloaded seven-inch steel column whose
support had been weakened when a new duct
had been cut beneath it, exacerbated by the
extra weight of water used to fight the fire on
the upper floors.
The Vendome was finally converted into 110
residential condominiums and 27 commercial
units in 1975, but the original Tuckahoe and
Italian white marble facade remains. On June
17, 1997, on the 25th anniversary of the fire, a
monument honoring the lost firefighters was
dedicated on the Commonwealth Avenue Mall.
Only a few yards from the site of the fire, it
features a firefighter’s helmet and coat cast in
bronze, draped over a low arc of dark granite.
Sources: “Without Warning — A Report on the
Vendome Hotel Fire” by the Boston Fire Histor-
ical Society, Massachusetts Cultural Resource
Information System (MACRIS), Back Bay Houses18 STEVEN COHEN TEAM
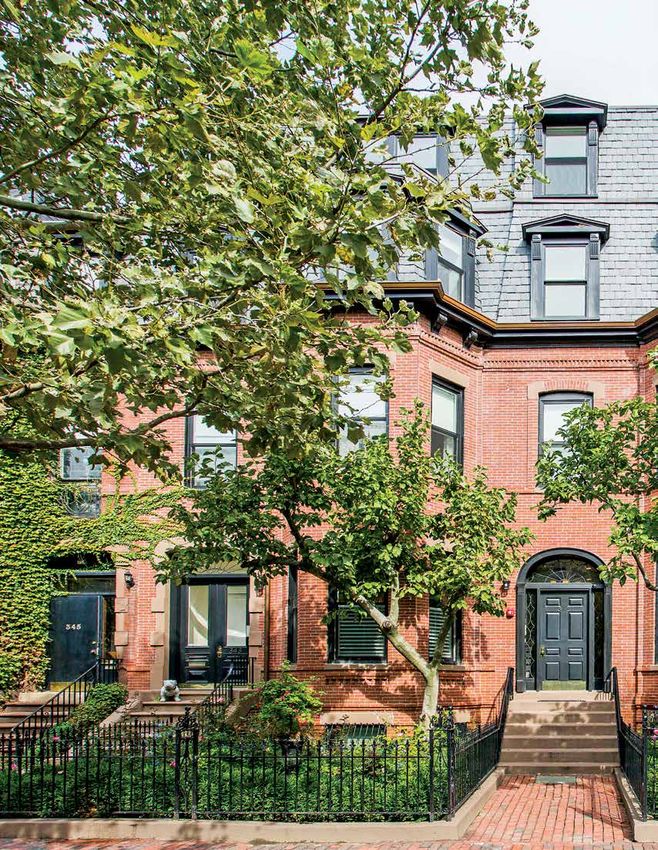
BIG CITY GARDENS
TIPS FOR THE URBAN GARDENER
Even in a relatively park-rich city like Boston, having your own bit of private
green space can soothe the senses on a hot summer afternoon, and brighten a
gloomy winter day. Whether you have an entire backyard, or a free spot on the
balcony or patio, don’t be afraid to explore your options. Or course, the urban
gardener has a unique set of obstacles to overcome. Below are a few of the ones
we believe you should consider:
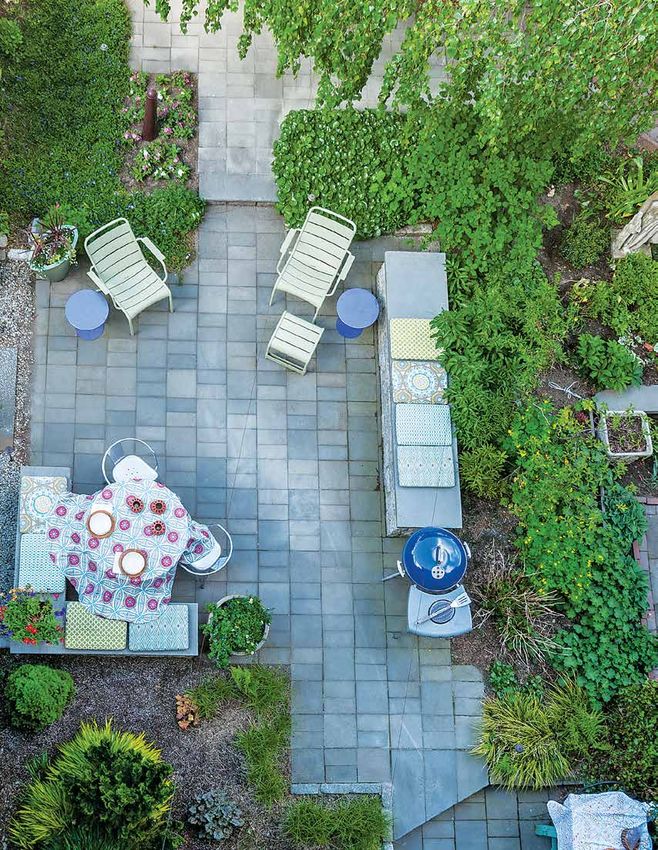
SPACE
Perhaps the most obvious problem urban gardeners face is space, or the lack
of it. The easiest solution is to think vertically. Thread stainless steel rods
through terra-cotta pots and suspend them from horizontal surfaces to punch
up the smallest balconies and patios. Spray-paint a wooden ladder and adorn
it with pretty pots and planters, and use it to store garden tools and potting
soil. Stack crates or handmade boxes and secure them vertically to a wall. If
you’re renting and not allowed to hang anything from your outdoor walls,
make a free-standing plant wall using wood and mesh rebar. Hang pot plants
using S-hooks and they’ll provide privacy for your space as they grow. A tiered
potted garden tucks nicely into the corner of any deck or patio. Also, consider
plant varieties that will help you get the most out of a small area with a more
rapid harvest, such as cherry tomatoes or Japanese eggplant instead of their
regular cousins.
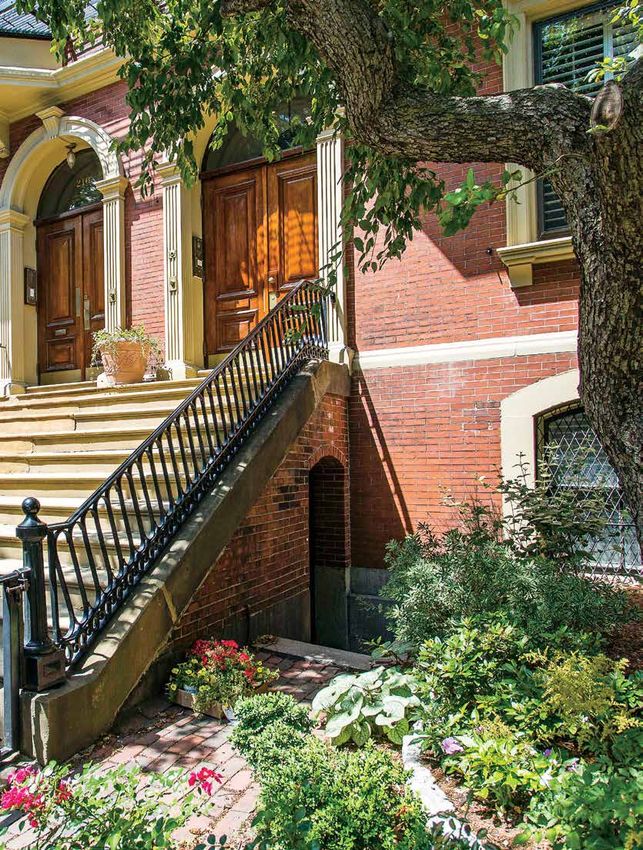
CONSIDER POLLUTION AND SOIL QUALITY
Smog and ozone damage are common in inner-city areas, but it’s not so much
what’s in the air that you should worry about, but what’s in the ground where
your plants grow. Urban soil can often be toxic from years of industrial ac-
tivities, poor land use, and vehicle exhaust. Choose your garden site carefully
and consider the ways the land has been used in the past. The ground may look
pristine and ready to plant, but the soil may contain toxic substances such as
pesticide and herbicide residue, lead-based paint chips and asbestos, and oil
and other petroleum products. Surround your garden with a hedge or a fence to
protect it from windblown debris. Dig in plenty of organic matter to enrich the
soil, improve its texture, and help it replace some of the lost nutrients. Worst
case scenario, you may need to bring in clean topsoil provided by a reputable
dealer. A raised bed or container gardens are also options.
Sources: Burpee, Boston.com, Gardening Know How, Reader’s Digest, HGTVBACK BAY STAKEHOLDERS’ REPORT 19 DON’T OVERDO IT While tilling before planting loosens the soil and spreads nutrients around, too much of it throws off the delicate balance of the soil, encourages erosion, kills beneficial worms and nematodes, and unearths weed seeds. Plants’ root systems are specialized, and while the top roots absorb nutrient-rich topsoil, the lower roots bring in minerals from deep within the soil and provide an anchor against the wind (especially at balcony or roofdeck elevation). Rather, consider a no-dig garden bed. If your desired spot already has grass or weeds, don’t dig them up. Mow or cut them close to the ground, lay your frame, then cover the ground with a few sheets of wet newspaper that will eventually kill the grass and decompose with it. Cover your newspaper with alternating layers of compost, manure, and mulch, and sow your seeds. The key to creating raised beds in urban settings successfully is disturbing the soil as little as possible. If your green space is a patio, roofdeck, balcony, or even your windowsill, you’re probably famil- iar with container gardening. You need to water container plants often, especially considering how hot exposed balconies in high-rises can get as the sunlight reflects off other structures. However, make sure the water drains properly and doesn’t sit in the saucer holding the pot. This can lead to root rot, fungus, and mildew. CHOOSE THE RIGHT PLANTS Be aware of your microclimate conditions. The urban climate is influenced by a variety of fac- tors, including solar radiation, surrounding air temperatures, air movements, sun orientation, humidity, topographical location, proximity to lakes or waterfront exposure, paved surfaces such as roads and parking lots, buildings, and existing rooftop conditions. Native plants are the easiest choice. They’re well adapted to your environment and require little to no maintenance since they’ve evolved and adapted to local conditions. Natives are vigorous and hardy, able to withstand local weather patterns, including Boston’s freezing winters and scorching summers. However, that is not to say that the dedicated gardener can’t or shouldn’t get creative. You can grow pretty much anything other than pumpkins or melons in a small space and, above all, you should take delight in the final product. DESIGN FOR THE SENSES Think about height and depth and keep the tallest plants on the north side of the garden so they don’t shade-out or hide smaller plants. On decks shaded by house walls or trees, plant hostas, caladiums, or lush ferns. Small hydrangeas look great in pots in light shade on patios. If the deck is on the west side of your home, a trellis will cast shade on hot summer afternoons. Flowering vines soften the architecture. Ornamental gourds or feathery cypress vines will cover an arbor in no time, and can easily be grown in pots for deck or patio gardening. Consider the time of day you enjoy your plants. White and pastel flowers show best at night, while deep blues and purples need sunlight to show off their colors. Incorporate fragrance by planting heliotropes, flowering tobacco, herbs, or roses, and remember that moonflowers and nicotiana release their aroma at night. Add a soothing water feature like a self-contained bubbling-fountain. With a little planning and a few choice plants, a deck or patio can become the heart of your garden, instead of just a useful extension of the house.
20   STEVEN COHEN TEAM

     SOCIAL SPRING
     A BACK BAY SOCIAL CALENDAR
     Are you feeling cabin fever after months of cold weather? Here’s a list of fun neighbor-
     hood activities to get you out of winter hibernation and put a spring back in your step.
     From theater performances to science conventions to foodie tours, Back Bay offers
     events for everyone to enjoy.

     R E C U R R I N G
     MCGREEVY'S FREE COMEDY                        Every Mon & Tu, 7:30pm   McGreevy's Boston | 911 Boylston Street
                                                                            Gourmet Boutique | 10 Huntongton
     DEATH BY CHOCOLATE: BACK BAY CHOCOLATE TOUR   Every Sat, 10am–1pm
                                                                            Avenue
                                                                            Kings Dining & Entertainment | 50
     KINGS KARAOKE                                 Every Thu, 9pm
                                                                            Dalton Street
                                                                            Trinity Church Boston | 206 Clarendon
     MIDDAY OASIS: FRIDAYS AT TRINITY              Every Fri, 12:15pm–1pm
                                                                            Street
                                                                            The Tracksmith Trackhouse | 285
     100 DAYS OUT SUPPORTED LONG RUNS              Every Sun, 9am–12:30pm
                                                                            Newbury Street
                                                                            Yogaworks Back Bay | 364 Boylston
     COMMUNITY CLASS $5 SLOW FLOW                  Every Mon, 2pm–3:30pm
                                                                            Street, 2nd Floor

     BACK BAY SCAVENGER HUNT                       Every Sat & Sun          206 Clarendon Street
                                                                            Emmanuel Church in the City of Boston |
     EMMANUEL MUSIC                                Every Sun, 10am
                                                                            15 Newbury Street

     M A R C H
                                                                            Hynes Convention Center | 900 Boylston
     MIT SLOAN SPORTS ANALYTICS CONFERENCE 2019    3/1–3/2
                                                                            Street
                                                                            Back Bay Events Center | 180 Berkeley
     BEYOND BUBBIE'S KITCHEN                       3/3, 5:30pm–7:30pm
                                                                            Street
                                                                            The Red Room @ Cafe 939 | 939 Boylston
     ALICE PHOBE LOU                               3/5, 8:00 PM
                                                                            Street
                                                                            The Red Room @ Cafe 939 | 939 Boylston
     LILY & MADELEINE / BROTHER BIRD               3/9, 8:00 PM
                                                                            Street
                                                                            Berklee Performance Center | 136
     AMERICAN ROOTS 10TH ANNIVERSARY               3/12, 7:30pm–9:30pm
                                                                            Massachusetts Avenue
                                                                            The Colonnade Boston Hotel | 120
     ICO-IO COMBINATIONS SUMMIT 2019               3/19-3/21
                                                                            Huntington Avenue
BACK BAY STAKEHOLDERS’ REPORT 21
ASSOCIATION OF ENERGY ENGINEERS GLOBALCON 3/21–3/22
Hynes Convention Center | 900 Boylston
CONFERENCE AND EXPO 2019 Street
Hynes Convention Center | 900 Boylston
5TH ANNUAL NEW ENGLAND CANNABIS CONVENTION 3/22–3/24
Street
ДДТ АКУСТИКА В БОСТОНЕ! 3/26, 8pm–10pm John Hancock Hall | 180 Berkeley Street
Boston Public Library Commonwealth
COPLEY SQUARE: HISTORY THROUGH ARCHITECTURE 3/27, 6pm–7:30pm
Salon | 700 Boylston Street
Hynes Convention Center | 900 Boylston
THE 18TH ANNUAL BOSTON TATTOO CONVENTION 3/29–3/31
Street
A P R I L
CHAMELEON ARTS ENSEMBLE PERFORMS SCHUBERT'S 4/6, 8pm | 4/7, 4pm First Church in Boston | 66 Marlborough
CELLO QUINTET Street
, 45TH ANNUAL DWIGGINS LECTURE - RICK POYNTER: Central Library in Copley Square | 700
4/10, 6pm–8pm
DAVID KING Boylston Street
GOOD FRIDAY CONCERT: CHARLES WOOD’S ST. MARK 4/19, 5:30pm–7:30pm
Trinity Church Boston | 206 Clarendon
PASSION Street
Hynes Convention Center | 900
ANIME BOSTON 2019 4/19–4/21
Boylston Street
Berklee Performance Center | 136
ZAKIR HUSSAIN MASTERS OF PERCUSSION 4/21, 7:30 PM
Massachusetts Avenue
CHAMELEON UP CLOSE: SONGS IN THE KEY OF LIFE 4/28, 4pm–6pm Old South Church | 645 Boylston Street
AND LOVE
Hynes Convention Center | 900
OPEN DATA SCIENCE CONFERENCE (ODSC) EAST 2019 4/30–5/3
Boylston Street
M A Y
ANOUSHK SHANKAR AT BERKLEE PERFORMANCE 5/4, 8pm–19:30pm
Berklee Performance Center | 136
CENTER Massachusetts Avenue
PROJECT BREAD'S WALK FOR HUNGER & 5K RUN 5/5 Boston Common
DUCKLING PARADE 5/12 Boston Public Garden
IN THE TWILIGHT AIR: BRAHMS' G MAJOR STRING 5/18, 8pm–10pm
First Church in Boston | 66 Marlborough
QUINTET Street
Emmanuel Church in the City of Boston |
EMMANUEL MUSIC: TANGO! 5/18, 8pm–9pm & 10pm–11pm
15 Newbury Street
Berklee Performance Center | 136
YANN TIERSEN AT BERKLEE PERFORMANCE CENTER 5/25, 8pm–9pm
Massachusetts Avenue
Central Library in Copley Square | 700
INDIAN AMERICANS OF MASSACHUSETTS 5/15, 6pm–7:30pm
Boylston Street
Event list accurate as of January 15, 2019.22 STEVEN COHEN TEAM
YOUR BUYER AGENT
AND YOU
STEVEN COHEN TEAM
88% of buyers purchased their home through a real estate agent or
broker in 2017— a share that has steadily increased from 69% in 2001.
BUYER
TRANSACTIONS
#
1 factors that determine a buyer’s decision to work with an agent are honesty
and integrity, followed by experience and reputation.
7 in 10
home search.
buyers interviewed only one real estate agent during their
Barrie Stavis
M 978.973.3229
E barrie@stevencohenteam.com
89%
to others.
of buyers would use their agent again or recommend their agent
Nicole Spencer
Contact one of our award-winning buyer agents M 978.771.4764
to find your next home. E nicole@stevencohenteam.com
""""" """"" """""
Source: National Association of RealtorsBACK BAY STAKEHOLDERS’ REPORT 23 Source: National Association of Realtors (NAR)
24   STEVEN COHEN TEAM

                EXPERIENCE • EXPERTISE • DATA
                When it comes to realizing the full value of your home in today’s market,
                you need our experience and systems working for you. The Steven Cohen
                Team’s exclusive Market Movement Index (MMI) provides unprecedent-
                ed insight that enables you to set the right price for your home.

                                What’s your home worth?
                             Call on us to get to work for you.
                                       617.861.3636
BACK BAY STAKEHOLDERS’ REPORT 25
GET OUR WEEKLY SUNDAY
OPEN HOUSE GUIDES
Now that you're up-to-date with the Boston real estate market, keep your finger on the pulse.
Follow this link to our Sunday Open House Guides and choose the neighborhood of interest
to you. If you can't make an open house you have your eye on, don't hesitate to contact us,
we'll arrange a private showing for you.
View and subscribe at
www.stevencohenteam.com/openhouses
For the finest service from the most knowledgeable source,
call the Steven Cohen Team, your real estate economists of choice.(617) 861-3636 info@stevencohenteam.com Each Keller Williams Realty office is www.stevencohenteam.com independently owned and operated.
You can also read