COMMODITY INSIGHTS INFOCUS - ANZ AGRI AUGUST 2021
←
→
Page content transcription
If your browser does not render page correctly, please read the page content below
ANZ AGRI
   INFOCUS
    AUGUST
     2021

COMMODIT Y
 INSIGHTS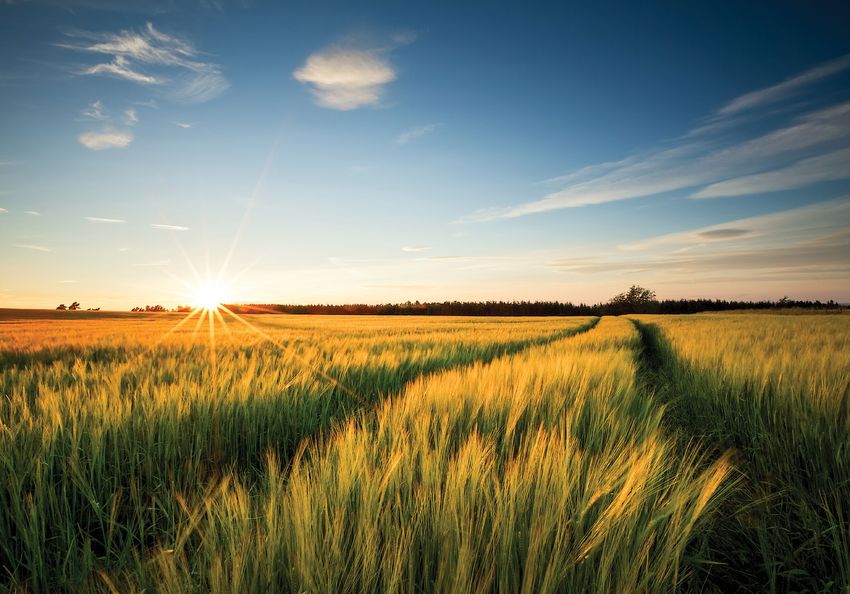
FOREWORD

There are signs in Australian agriculture that not            The stand out implication for the industry’s
only is winter finishing and spring upon us, even if          strong performance has been the demand for
it is ahead of the official start on 1 September, but         rural land and booming rural land values.
that the end of the year and the summer period are            While rural land values have been growing strongly
all not too far away.                                         for a number of years now, including throughout
                                                              recent drought years, there is some growing
Across all Agri landscapes, perhaps the most
                                                              nervousness in the industry over the sustained,
noticeable sign of spring is the early flowering
                                                              stellar growth in land values.
of canola crops.
On other farms, new and growing lambs, looking                The question preoccupying industry players is –
healthy in fields of green. This year, however, there         how high is too high? Are the current increases
will be one aspect of spring which will be different          justified? There are many factors in play which
in many country areas. The cancellation of field              are well recognised including strong commodity
days, country shows, and other Agri events that               prices, low number of farms on the market and low
would otherwise be filling dedicated sites across             interest rates. The value of rural land as a stand-
the country is a real disappointment for many.                alone asset, however, is less often discussed and
                                                              when rural land is considered next to commercial
While the range of events differ in their size and            and residential property, it appears that rural land
focus, they serve a range of really important                 is in a ‘catch-up’ phase compared to growth in
functions for both their communities and the wider            alternative property-based assets.
agriculture sector. The economic benefits to many
country towns of a field day go without saying –              The implications for the industry are clear as
the revenue generated by local hotels, restaurants,           growing rural property prices make it harder for
and a range of other service providers often peaks            new farmers to enter the industry, or for farmers to
around their annual local event – and provides                expand. It is also clear that the drive for the industry
a major fundraising opportunity for vital local               to reach $100 billion in output by 2030 will also
community groups.                                             continue to have an impact on property prices –
                                                              and reaching that target could see an almost 30 per
These events also provide a chance for a welcome              cent increase in rural land values by 2030.
break, networking, connection for a community
known for their hard work. In an era of increasing            People in agriculture and country communities
mental health awareness, all of this seems more               pride themselves on being resilient, as well as
valuable than ever, and is a notable miss.                    planning for the many scenarios that this sector
                                                              can throw up. Looking ahead, it is vital that we
Very importantly, field days also provide an                  all consider what 2022 might look like – for farm
opportunity for farmers, agricultural retailers,              values, commodity prices, season and community.
service providers, and other industry specialists,            It’s hard to have confidence in planning ahead
to get together to exchange ideas, discuss                    these days, there are risks, and the potential for
innovations and experience emerging technology.               challenges next year that might be different again.
One of the issues which would no doubt be                     Despite the uncertainty, most farmers are looking
thoroughly discussed at such events would be the              forward with confidence at an industry and season
state of the rural property market. With the industry         that, to date, have weathered the COVID-19 storm.
as a whole continuing to perform strongly, good
seasonal conditions, another strong production
year, and global prices for major commodities
remaining strong, land prices have been a major
topic of conversion.
                                                              Mark Bennett
                                                              Head of Agribusiness & Specialised Commercial,
                                                              Business & Private Bank
                                                                  @bennett2_mark

                                                        PAGE 01
RURAL PROPERTY MARKET INSIGHTS

OVERVIEW

Rural land values are booming, and as Australian agricultural production reaches record levels to buck the
COVID-19 downturn and provide a much needed boost to the economy as a whole, there doesn’t seem
to be an end in sight. But as the industry focusses on the goal of raising production value to $100 billion –
what does this mean for land values?

While the world has been gripped by COVID-19               growth in rural land values versus residential and
outbreaks, lockdowns and vaccinations, one                 commercial, it becomes clear that an element of
industry which can only be said to be ‘thriving’ is        the current growth spurt is ‘catch-up’ to alternative
the Australian agriculture industry. With livestock        property-based assets, after years of relatively
prices at or around the highest level ever, last           subdued growth.
season’s record wheat harvest and record dairy
prices, Australian farmers are in the midst of some        RECENT, STRONG PRICE RISES
of the best conditions since the wool boom. Given
                                                           According to the official data from the Australian
that – why are some in the industry starting to feel
                                                           Bureau of Statistics (ABS), the value of Australia’s
a sense of nervousness over the sharp climb in
                                                           rural land has appreciated by over 30 per cent in
rural land values?
                                                           the three years to June 2020. This data is based on
Low interest rates, strong commodities prices, farm        the information put together by each States’ Valuer-
consolidation, a low number of farms for sale and          General for government uses such as local council
good season are the obvious answers to the current         rates. But this can’t be right, surely? We have all
surge in land values. While over the long term             seen the headlines of large rural property sales and
rural land values have tracked commodity prices            the ever increasing value of national agricultural
closely, up until this year there has been a notable       land; or seen local properties sell at significantly
divergence. So what’s the x-factor?                        higher sums than we expected – with many reports
It may be that the driving force is less about             of localised growth over 20 per cent per hectare in
the agriculture industry, and more about the               a single year.
comparison between rural land and other
property-based assets. When we look at the

                                                       PAGE 02
RURAL LAND VALUE BY STATE
400
350
300
250
$A billion
200
150
100
50
0
89
91
93
95
97
99
01
03
05
07
09
11
13
15
17
19
19
19
19
19
19
19
20
20
20
20
20
20
20
20
20
20
n-
n-
n-
n-
n-
n-
n-
n-
n-
n-
n-
n-
n-
n-
n-
n-
Ja
Ja
Ja
Ja
Ja
Ja
Ja
Ja
Ja
Ja
Ja
Ja
Ja
Ja
Ja
Ja
New South Wales Victoria Australia
40
35
30
25
20
$A billion
15
10
5
0
91
93
95
97
99
01
03
05
07
09
11
13
15
17
19
89
19
19
19
19
19
20
20
20
20
20
20
20
20
20
20
19
n-
n-
n-
n-
n-
n-
n-
n-
n-
n-
n-
n-
n-
n-
n-
n-
Ja
Ja
Ja
Ja
Ja
Ja
Ja
Ja
Ja
Ja
Ja
Ja
Ja
Ja
Ja
Ja
Queensland South Australia Western Australia Tasmania Northern Territory
Source: ABS, ANZ
THE FOMO FACTOR With commodity prices a very strong levels and
So what else is factoring into higher rural land good seasonal conditions over the past 12 months,
values, and is the growth as considerable as we’re not many farmers are selling – leading many in
led to believe? In short, yes but there are other the industry to surmise that land values are being
factors at play. There’s no doubt that land value boosted by a lack of properties being offered. At a
growth has been incredibly strong, which is well time when medium and large farmers are looking
captured by the ABS data. But the ABS figures are to grow their footprint and farm consolidation is
inherently conservative and not necessarily done on driving change across the industry, the relatively
the state of the land market at the time, rather they small number of properties going to market is
are based on the calculated ‘underlying value’ which driving buying seen by many as ‘over-priced’.
market sentiment feeds into. The perception that
land values are ‘out of control’ are being fed not only
by strong demand but also by a reduction in supply.
PAGE 03
CHANGING VIEW OF RURAL LAND                                           Since around 2016 however, land prices have
AS AN ASSET?                                                          continued to rise strongly despite drought years
There is, of course, more to the story than just the                  or stumbles in the commodity price such as the
‘fear of missing out’. Historically, rural land values                milk price drop. Clearly rural land values – and land
have tracked commodity prices fairly closely,                         values across all sectors - are strongly connected
with drought years or commodity price slumps                          with historically low interest rates has provided a
translating across to lower property values.                          significant impetus for purchasers to buy now.

FARM CAPITAL V PROFIT

7,000,000                                                                                                          150,000

6,000,000
                                                                                                                   100,000
5,000,000
                                                                                                                   50,000
4,000,000

3,000,000                                                                                                          0

2,000,000
                                                                                                                   -50,000
1,000,000

         0                                                                                                         -100,000
              Year
             1990
             1991
             1992
             1993
             1994
             1995
             1996
             1997
             1998
             1999
             2000
             2001
             2002
             2003
             2004
             2005
             2006
             2007
             2008
             2009
             2010
             2011
             2012
             2013
             2014
             2015
             2016
             2017
             2018

                      Capital at 30 June excluding leased items                   Farm business profit (RH axis)

Source: AgSurf, ANZ

If this were the only real factor driving rural                       However during the 2010’s, both residential
land prices then, we would expect to see rural                        and commercial property values have grown
land perform on par with both residential and                         significantly stronger than rural properties. The
commercial property. This has not been the case                       recent growth in rural land may also be put down
in recent years, however with rural land value                        to investors seeking alternative property-based
growth outperforming the national residential                         investments and playing catch-up to the residential
property value growth by an average of 3 per                          and commercial sectors.
cent each year (albeit from a low base) in the past
5 years – including drought years. Until the mid-
2000s, residential, commercial and rural property
had all shown relatively similar growth rates.

                                                                  PAGE 04
TOTAL AUSTRALIAN LAND VALUE BY INDUSTRY

600                                                                                                                         6,000

500                                                                                                                         5,000

400                                                                                                                         4,000

300                                                                                                                         3,000

200                                                                                                                         2,000

100                                                                                                                         1,000

   0                                                                                                                        0
      n- 9
      n- 0
      n- 1
      n- 2
      n- 3
       n- 4
      n- 5
      n- 6
      n- 7
       n- 8
      n- 9
      n- 0
      n- 1
      n- 2
      n- 3
      n- 4
      n- 5
      n- 6
      n- 7
      n- 8
      n- 9
      n- 0
      n- 1
      n- 2
      n- 3
      n- 4
      n- 5
      n- 6
      n- 7
      n- 8
      n- 9
           20
    Ja 198
    Ja 199
    Ja 199
    Ja 199
    Ja 199
    Ja 199
    Ja 199
    Ja 199
    Ja 199
    Ja 199
    Ja 199
    Ja 200
    Ja 200
    Ja 200
    Ja 200
    Ja 200
    Ja 200
    Ja 200
    Ja 200
    Ja 200
    Ja 200
    Ja 201
    Ja 201
    Ja 201
    Ja 201
    Ja 201
    Ja 201
    Ja 201
    Ja 201
    Ja 201
    Ja 201
         20
      n-
    Ja

                                   Commercial          Rural     Other (industrial)   Residential (RH axis)
Source: ABS, ANZ

NATIONAL GROSS FARM PRODUCTION, RURAL LAND VALUES AND RURAL BANK DEBT LEVEL

100                                                                                                                             400
 90                                                                                                                             350
 80
                                                                                                                                300
 70
 60                                                                                                                             250
 50                                                                                                                             200
 40                                                                                                                             150
 30
                                                                                                                                100
 20
 10                                                                                                                             50
  0                                                                                                                             0
     21 f
            f
    20 –19

     20 0
    20 –16
    20 –17
    20 –18
    20 –13
    20 –14
    20 –15
    20 –09
    20 –10
    20 –11
    20 –12
    20 –07
    20 –08
    20 –04
    20 –05
    20 –06
    19 –99
    20 –00
    20 –01
    20 –02
    20 –03
    19 –96
    19 –97
    19 –98

   20 – 21

          2
   20 9 –2

        -2
      17
      18
      14
      15
      16
      12
      13
      10
      11
      07
      08
      09
      04
      05
      06
      97
      98
      99
      00
      01
      02
      03
      95
      96

      1
 19

                      Gross value of farm production             Rural bank debt           Rural property value (RH axis)
Source: ABARES, ANZ

LOOKING FORWARD TO $100 BILLION                                       to appreciate even before the end of the most
With every boom comes the inevitable impact                           recent drought, and before commodity prices had
on asset prices. As Australian agricultural land                      appreciated, raising the likelihood that the run on
values have climbed sharply in recent years, it has                   rural demand was more about consolidation, with
left many in the industry asking whether those                        medium-to-large farms buying and expanding their
prices can be justified based on the productive                       operations, than it was about pure profitability.
capacity and profitability. Rural land prices began

                                                               PAGE 05
WHAT DOES THE INDUSTRY’S GOAL OF REACHING
                   $100 BILLION IN OUTPUT BY 2030 MEAN FOR FARM VALUES?
            LOOKING AT THE LONG-TERM RELATIONSHIP BETWEEN AGRICULTURAL
              OUTPUT AND LAND VALUES, AN INDUSTRY OUTPUT OF $100 BILLION
            WOULD MEAN THAT THE TOTAL VALUE OF AUSTRALIAN AGRICULTURAL
           LAND COULD REACH $488 BILLION – AN ALMOST 29 PER CENT INCREASE
                                      ON TODAY IN VALUE BY 2030.

Rural debt levels were sitting at just over 26 per     value in Australian property prices, international
cent of rural land value in 2019-20 which has          buyers continue to look for significant purchases,
remained relatively stable in recent years despite     city dwellers looking to purchase their piece of
drought. Since 1995, rural debt levels have            regional lifestyle to escape lockdowns and even
fluctuated between just under 23 per cent and over     the recent trend of carbon farming and investors
28 per cent. If this ratio is maintained to 2030 and   looking for offset opportunities. And while the
$100 billion in output, then rural bank debt levels    strong demand for rural land must be considered
could be expected to rise to between $110 and          a good thing for the industry – it does have
$139 billion at the same time.                         ramifications for many, from new farmers looking to
                                                       enter the industry and generational farmers looking
Demand for rural land isn’t only coming from
                                                       to take advantage of high prices.
traditional farming, there are more investors seeing
BEEF INSIGHTS

OVERVIEW

+		Records cattle prices provide a boon for all              -		High cattle prices will continue to provide
    those producers selling stock                                 challenges for many smaller restockers
+		Demand for beef remains strong, especially in             -		The tight supplies of Australian beef exports may
    export markets with recovering economies                      push importers to continue looking to larger
                                                                  competitors
+		The Argentine suspension of beef exports
    has put Australia in an even more favourable              -		The challenges to processors of the high cattle
    global light                                                  prices, including reduced capacity, could flow
                                                                  back up the supply chain

It seems appropriate that the past few weeks                  While the reaction to the new peak in prices may
have been a time for records to be broken – both              have been somewhat muted, it is important to
by Olympic athletes, but far more importantly to              reflect on just how unforeseen, not that long ago,
Australian beef producers, by cattle prices.                  prices of this level were by many in the industry,
                                                              and even more importantly, what this could mean
EYCI CONTINUING TO BREAK RECORDS                              for all stakeholders going forward.
In late July, the benchmark Eastern Young                     One interesting indicator was that the National
Cattle Indicator (EYCI) broke through the once                Livestock Reporting Service (NLRS), the body which
unthinkable 1,000 cent/kg mark. After months of               collects and collates all the data essential for so
the EYCI seemingly breaking record ground every               much of the cattle industry’s planning and analysis,
few days, the ticking over to the new milestone was           was forced to call in IT experts to add a fourth digit
met with almost a sense of inevitability by many in           to its online operating systems. If the experts at the
the industry.                                                 core of the industry had not predicted that prices
                                                              would ever reach this level when designing and
In some agri commodities, price rises to high levels
                                                              building their systems, then the market is clearly in
are often followed by an equally sharp fall again,
                                                              a whole new era.
as the market rushes to take advantage of the
price, and the resultant volumes on the market                It is also worth reflecting that this price level means
dampen the tightness of supply – the Australian               that the EYCI has effectively doubled in around
lamb market is one example. For cattle however,               18 months. It was in mid-January 2020 that prices
prices have stayed high in the weeks since the                pushed up through the 500 c/kg mark, having sat
1,000 barrier was broken, and show little sign of any         within a 400-600 c/kg band for around three years.
major reduction for at least the remainder of 2021.

                                                        PAGE 07
CORE INPUT PRICE DOUBLED                                          These unprecedented cattle price rises have come
While it may seem basic, it is worth taking a                     about through a combination of fundamentals, all
moment to step back and look at what this means                   interacting to generate than market activity.
in context. The price of cattle, the central and
fundamental commodity to the entire Australian                    EVERYTHING STILL RELIES ON SEASON
beef supply chain, has doubled in a little over a                 More important than anything is the rain. While no
year. Thinking about that in basic economic terms,                level of rainfall will ever be perfect – someone is
the fact that both the prices received by the sellers             always getting too much or too little – across most
in the market, but perhaps more importantly the                   of Australia’s cattle producing regions, the ongoing
price paid by those requiring this commodity                      level of rainfall has been almost optimal, leading
have doubled in such a relatively short period, and               to excellent volumes of grass, which has provided
far more quickly than so many of the other costs                  growers with the capacity not only to rebuild their
around them, must unavoidably create long term                    herds to pre-drought levels, but to potentially
changes to the structure of the industry, especially              exceed those numbers. At the same time, their
if the high prices are maintained.                                costs of supplementary feeding are negligible. As
Major price changes this large and sharp are more                 a result, if farmers don’t need to destock, and if
commonly associated with the hard commodity                       they can continue to build their herds internally,
sector – oil and iron ore prices are two of the major             in combination with some restocking purchases,
examples. Interestingly, the price rise of iron ore over          then it makes sense that the flow of cattle onto the
the same period has been even more spectacular                    market is going to be tighter than it has been for
– up by around 146 percent – though the fact that                 the past few years – a period which had possibly
the Australian iron ore market has a small number                 become accepted as the norm.
of concentrated suppliers, as well as one dominant                The fact that the good season is also likely to see
trading partner (China, which is also relatively reliant          larger cattle and carcass weights will also play
on Australia), makes the market structure, and price              into farmers not needing to sell cattle in the same
implications, somewhat different.                                 numbers, to achieve the required returns for their
                                                                  operations.

EASTERN YOUNG CATTLE INDICATOR CONTINUES RECORD PRICE RISES

1,100
1,000
  900
  800
  700
  600
  500
  400
  300
  200
  100
     -
                   5

                                 6

                                                7

                                                                  8

                                                                                    9

                                                                                                  0

                                                                                                                   1
         15

                       16

                                       17

                                                           18

                                                                          19

                                                                                         20

                                                                                                         21
               01

                              01

                                              01

                                                                 01

                                                                                01

                                                                                                02

                                                                                                               02
    20

                       20

                                     20

                                                      20

                                                                          20

                                                                                        20

                                                                                                         20
              l/2

                            l/2

                                            l/2

                                                                l/2

                                                                               l/2

                                                                                              l/2

                                                                                                              l/2
   n/

                      n/

                                     n/

                                                     n/

                                                                        n/

                                                                                       n/

                                                                                                       n/
          Ju

                            Ju

                                           Ju

                                                            Ju

                                                                               Ju

                                                                                             Ju

                                                                                                              Ju
 Ja

                    Ja

                                   Ja

                                                   Ja

                                                                      Ja

                                                                                     Ja

                                                                                                     Ja

Source: MLA, ANZ

                                                            PAGE 08
FALLING EXPORTS DRIVEN BY SUPPLY, Finally, the combination of the tightness of
NOT DEMAND supply, combined with high prices, may well see a
In terms of demand for beef, particularly exports, speeding up of a fundamental change in the cattle
the market finds itself in an interesting position selling process. Given that the three main buying
where the monthly numbers are well down, but categories – restockers, feed lotters and processors
the industry sentiment is increasingly positive. In – all require ongoing supply for maintenance of
July 2021, overall Australian beef exports reached their operations, the increasing competitiveness and
just over 81 thousand tonnes, an eleven percent uncertainty may stimulate greater offtake contracts
fall on the previous month, and almost seventeen and relationships, particularly between producers
percent down on the five year July average. Japan and processors. While this is unlikely to mean the
and South Korea took around half the total, while decline of saleyards, especially as the herd recovers,
the United States and China were steady, but the potential benefits for producers through
well down on last year’s export figures. Despite processor relationships is something which may
these low numbers, the fact that they are driven further work to their benefit in the long term.
almost entirely by Australia’s tight supply, rather
than dwindling demand or strong competition,
continues to keep sentiment high. In terms of
competition, the wariness in global beef markets
of maintaining supply, particularly spurred by
Argentina’s recent temporary suspension of exports
will continue for some time.
BEEF EXPORTS SQUEEZED BY TIGHT SUPPLY
1,400
1,200
1,000
800
600
400
200
-
20 –01
20 –02
20 –03
20 –04
20 –05
20 –06
20 –07
20 –08
20 –09
20 –10
20 –11
20 –12
20 –13
20 –14
20 –15
20 –16
20 –17
20 –18
20 –19
20 –20
21 f
f
20 –21
2
–2
00
01
02
03
04
05
06
07
08
09
10
11
12
13
14
15
16
17
18
19
20
20
China Japan United States South Korea Other
Source: ABARES, ANZ
PAGE 09-
5
10
15
20
25
30
35
19
70
19 – 7
72 1
19 – 7
74 3
19 – 7
Source: ABARES, ANZ
76 5
19 – 7
78 7
19 – 7
80 9
19 – 8
82 1
19 – 8
Beef cattle (million)
84 3
19 – 8
86 5
19 – 8
88 7
19 – 8
90 9
19 – 9
92 1
HERD REBUILD CONTINUES, ALBEIT SLOWLY
19 – 9
94 3
19 – 9
96 5
19 – 9
PAGE 10
98 7
20 – 9
00 9
Dairy cattle (million)
20 – 0
02 1
20 – 0
04 3
20 – 0
06 5
20 – 0
08 7
20 – 0
10 9
20 – 1
12 1
20 – 1
14 3
20 – 1
16 5
20 – 1
18 7
Total cattle (million)
20 – 1
20 9
–2
1fGRAINS INSIGHTS
OVERVIEW
+ Strong global and domestic grains prices - Fertiliser prices have surged recently on the
continue being supported by drought back of ammonia production shutdowns in
conditions in Northern America Saudi Arabia
+ Good seasonal conditions in Australia’s grain - Freight costs are also skyrocketing as a result of
growing areas as resulted in early forecasts of lack of capacity which is having mixed impacts
strong, above-average harvest for Australian producers
+ Depreciation in the Australian dollar has also - Grains prices in Russia have been volatile in
supported domestic prices recent months indicating that there is some
inherent instability in global prices
Continuing strong domestic and global wheat STRONG GLOBAL WHEAT PRICES CONTINUE
prices, a lower Australian dollar and forecast lower ON THE BACK OF CONCERNS OVER QUALITY
global production are all contributing to good The global grains market is being dominated by the
conditions for local producers. However, a number twin price pressures of surging global food prices,
of clouds are on the horizon which are tempering and soaring global shipping costs. Global wheat
the global grains outlook, including soaring global prices - which jumped in May coinciding with an
freight costs, high fertiliser costs and volatile increase in global food prices reaching their highest
grains prices in the Black Sea region. While global level since 2011 – were being primarily driven by
production forecasts for both volume and quality maize prices. And while maize prices have come off,
have been shifting up and down from month to global wheat prices have remained relatively stable,
month, demand for Australian exports has been being supported by recent downgrades in forecasts
strengthening across south-east Asia – and most for global production.
recently, in China.
PAGE 11DOMESTIC WHEAT PRICES STEADY
500
400
A$/MT
300
200
100
5
6
7
8
9
0
1
15
16
17
18
19
20
21
01
01
01
01
01
02
02
20
20
20
20
20
20
20
l/2
l/2
l/2
l/2
l/2
l/2
l/2
n/
n/
n/
n/
n/
n/
n/
Ju
Ju
Ju
Ju
Ju
Ju
Ju
Ja
Ja
Ja
Ja
Ja
Ja
Ja
Milling Wheat (APW) Feed Wheat (ASW)
Source: Bloomberg, ANZ
GLOBAL GRAINS PRICES REMAIN STRONG
200
Rebased to Jan 2015
150
100
50
-
5
6
7
8
9
0
1
5
16
17
18
19
20
21
01
01
01
01
01
02
02
01
20
20
20
20
20
20
l/2
l/2
l/2
l/2
l/2
l/2
l/2
2
n/
n/
n/
n/
n/
n/
n/
Ju
Ju
Ju
Ju
Ju
Ju
Ju
Ja
Ja
Ja
Ja
Ja
Ja
Ja
Wheat (HRW) Rice (Rough) Corn Soybean
Source: Bloomberg, ANZ
The global production outlook has been mixed impacts in Canada and the United States, and
with drought in the United States and Canada, more recently, torrential rain and above-average
and a downgrade in Russia’s expected bumper temperatures in parts of Ukraine.
crop being offset by production levels in the
To offset record production, the USDA also is
European Union, Ukraine and the United Kingdom.
forecasting record wheat consumption, primarily
The forecast Russian wheat crop is slowly
as a result of higher feed and residual use by the
being downgraded by a number of local and
EU and Russia. Trade in 2021-22 is also forecast at
international analysts which are continuing to put
a record 203.2 million tonnes based on increased
upward pressure on global prices. Despite this, the
exports by Ukraine and India. Ending stocks are
United States Department of Agriculture (USDA) is
expected to increase slightly, however notably
forecasting a record global wheat harvest, based
ending stocks are expected to fall for the first time
primarily on production in the EU, Ukraine and
in many years in China, while also remaining tight
Australia. The driving factor behind strong prices is
in major exporting countries which is considered a
the ongoing concern around supply of high quality
primary measure of supply.
wheat following the drought and ‘heat dome’
PAGE 12AUSTRALIAN WHEAT EXPORTS While Chinese buying is reported to be sporadic, it
INCREASING TO CHINA has marked a turn in the trading relationship.
One of the major impacts of the drought in the Booming global freight rates which have come
US and Canada and the continuing downgrade in from a lack of capacity on major freight routes as
Russia’s wheat crop has also created an opening a result of COVID-19 lockdowns are having mixed
in Asian export markets for Australian grain. Large impact for Australian producers. While it has
increases in exports to Indonesia and Vietnam in impacted margins for exports to European and
2021-21 have been followed by large shipments Middle Eastern export markets, it has also resulted
of Australian grain to South Korea, Indonesia in Australian grains into Asia becoming more
and Thailand in the current year. As prices have competitive with Black Sea region and European
increased in the US as a result of the season, there competitors.
has been an increase in buying activity from China.
GLOBAL FREIGHT RATES SOARING
400
350
300
250
200
150
100
50
0
1/1/13 1/1/14 1/1/15 1/1/16 1/1/17 1/1/18 1/1/19 1/1/20 1/1/21
Argentina Australia Brazil Black Sea Canada Europe US
Source: International Grains Council
2021-22 WHEAT CROP ESTIMATES Booming canola prices as a result of the heat dome
APPROACHING 30 MILLION TONNES and drought in the United States and Canada
The latest Australian Bureau of Agricultural and have also resulted in a 25 per cent increase in
Resource Economics and Sciences (ABARES) crop canola plantings to 3 million hectares while barley
estimate is for a solid domestic grains production plantings are expected to fall slightly. Chickpea
season with the winter crop expected to be 13 per plantings are also expected to increase area 20% to
cent above the 10-year average. While harvest is 607,000 hectares also as a result of high prices and
expected to be down on last year’s record harvest, good planting conditions in Queensland and New
good rains in many cropping regions in Western South Wales. On the down side, booming global
Australia, New South Wales and Queensland are fertiliser prices are also expected to hit producers’
expected to support a strong year. Mouse plague bottom line and curtail fertilising at a time when
issues still remain across much of New South Wales, producers would normally be looking to invest
increased baiting will mitigate the major impact, heavily in soil condition. The boom in fertiliser
however the additional costs will hit producers’ prices is expected to be temporary however, as
bottom line. While total area sown to wheat is unanticipated shutdowns in ammonia production
anticipated to reach a new record level, lower have flowed through to other classes of fertiliser.
yields in New South Wales and patchy conditions
in Victoria will impact the final harvest. Early USDA
estimates of the Australian wheat crop are for a 28.5
milllion tonne harvest.
PAGE 13EARLY ESTIMATES FOR AUSTRALIA’S WINTER CROP
ARE FOR A STRONG, ABOVE-AVERAGE HARVEST.
PAGE 14SHEEP INSIGHTS
OVERVIEW
+ The ongoing strong prices for lambs and older - As with cattle, restockers could find high sheep
sheep continue to be welcomed by producers prices challenging
+ The good season, and ample grass, may well see - Domestic consumption of both lamb and
some of the higher lambing percentages and mutton remains lower than the industry would
heaviest lambs in some time ideally prefer
+ Demand remains strong, particularly into China, - COVID-19 disruptions have meant the
and especially for mutton exports cancellation of a number of major Australian
sheep events for the second year in a row
With Spring just around the corner, the outlook for could potentially be impacted by colder conditions
most sheep producers remains relatively bright. In or above-average rainfall. While the season is far
most regions, conditions over the past few months preferable to recent drought periods, recent strong
have been largely good for lambing, with the rains across a number of regions have raised some
majority of producers in Australia nearing the end concerns of a reduction in forecast percentages
of lambing and considering their farm strategies and lamb conditions.
for coming months. Across the board for both
Given the current high lamb prices, strategic
livestock and meat, prices remain strong, driven by
sheep producers – and their stock agents – will be
both restocking, as well as domestic and export
watching the market, and judging whether they will
meat demand.
be better off selling lambs earlier, even if not in peak
condition. While the normal scenario would see
GOOD SEASON LEADING TO STRONG LAMBING the volume of lambs from the spring flush pushing
For sheep producers, the rain and seasonal prices down, this year’s high prices may see this
conditions at this time of year arguably provide a volume hit the saleyards earlier than normal.
greater impact than on almost any other major agri For heavy lambs, in the over 22 kg category, recent
sector. The relatively good conditions since the start prices of around 957 c/kg have hit their highest
of the year saw ewes come into lambing in better levels since 2019, when prices peaked in the 900s.
average condition than they had been for some Importantly, as a portend for coming months,
time, leading to good initial lambing percentages. prices in 2019 subsequently fell steadily, dropping
That said, the coming few months will be very by 30 percent in the six months to the end of 2019,
important, in determining whether sucker lambs although subsequently regained most of this fall to
reach peak condition before sale, or whether they climb to 956 c/kg by March 2020.
PAGE 15SEASONAL PRICE DROP EXPECTED commitment of being able to conduct everything
IN COMING MONTHS online, until the rams or other sheep arrive at the
Looking ahead, assuming that market dynamics purchaser’s property.
play out as forecast, lamb prices are likely to come
off current highs over the coming month or two. CONFIDENCE IN MUTTON MARKET
One factor which may slow this trend down this Away from the lamb price forecasts, the signs for
year could be the potential for some producers to mutton continue to be strong. Export demand
hold onto more of their lambs than usual, not just remains high, largely from China, and a softening
to continue restocking their properties, but to avoid in the Australian dollar has only further increased
paying high prices for ewes to build farm numbers. the attractiveness of mutton exports. As a result,
The variation in seasonal conditions across different mutton export volumes are up around 30 percent
regions has seen different sale patterns in different on the same time last year. At the same time,
areas. In Victoria’s Wimmera Mallee region, tighter mutton prices continue their steady growth, up
feed conditions earlier in the year saw a reasonable around 26 percent from the price last September.
sell-off of ewes and lambs, which is likely to see a A sign of the confidence in the mutton market has
noticeably reduced volume of spring flush lambs. been that recent larger yardings, particularly in
In these areas, some producers are likely to seek NSW and Victoria, have had no downward impact
advantage of current high mutton prices, by selling on mutton prices.
cull ewes, or weaning early to sell older ewes.
A question which continues to be asked by many
COVID DISTRUPTIONS CONTINUE in the sheep sector, just as it has been with beef
producers, is whether the pace of the restocking
The resurfacing of COVID-19 cases in a number process may finally be slowing, or whether it is
of states over recent weeks, and the subsequent likely to remain strong. Given the forecast for a
cross border restrictions between a number of good spring, it may mean that many producers will
states have created some disruptions for the be selling heavier lambs than they have for a few
sheep industry, though potentially likely to have years, and that even if prices fall slightly based on
minimal impact. Frustratingly, a number of major supply, overall profitability may well be good.
sheep events, including Hamilton’s Sheepvention,
Bendigo’s Australian Sheep and Wool Show, and Given the combination of ongoing good feed,
the Royal Melbourne Show have all been called as well as industry confidence, it is likely that the
off again in 2021, robbing a number of producers restocking process will continue, potentially with
of the opportunity to take part in major industry a focus on replacement of ewes for the previous
competitions, and to increase the visibility of their season’s culls. In other times, if the returns on
rams. Similarly, recent border closures are likely to sheep were far more attractive than cattle or grain,
limit the ability of buyers to attend ram sales in then there may well be a move by some mixed
different states, although the delay in the ability to producers to increase their flock considerably,
deliver rams will hopefully be only short term. while reducing the level of crops or other livestock.
However, given the relative high prices of all major
Longer term, it will be interesting to see what agri commodities this year, any rise in the flock
the impact of the disruptions will be on not only numbers is likely to be muted.
major sheep related events, but on the traditional
ram sale calendar. Many producers have now had
around two years’ experience of utilising online
methods for buying and selling their rams, as well
as other stock. While this may have lacked the
social aspect of these events, many producers may
well have taken note of the reduced costs and time
PAGE 16AUSTRALIA’S SHEEP FLOCK REMAINS LOW BUT FLAT
200 30
180
25
Cattle and Sheep (million)
Crop Acreage (million ha)
160
140
20
120
100 15
80
10
60
40
5
20
- -
70/71
73/74
76/77
79/80
82/83
85/86
88/89
91/92
94/95
97/98
00/01
03/04
06/07
09/10
12/13
15/16
18/19
21/22f
Crop acreage (RHS) Cattle numbers
Sheep numbers
Source: ABARES, ANZ
MEAT SHEEP CONTINUE TO DISPLACE WOOL SHEEP
1,800 180
Sheep Meat & Wool Production (kt)
1,500 150
Sheep Numbers (million)
1,200 120
900 90
600 60
300 30
- -
85/86
87/88
89/90
91/92
93/94
95/96
97/98
99/00
01/02
03/04
05/06
07/08
09/10
11/12
13/14
15/16
17/18
19/20
21/22f
Wool Production ('000 tonne gr. eq.) Sheep Numbers (RHS)
Sheep Meat Production ('ooo tonne cw)
Source: ABARES, ANZ
PAGE 17WOOL INSIGHTS
OVERVIEW
+ After the price dip of the last year, the ongoing - The wool market’s renowned unpredictability
wool price rises are welcomed by growers is causing some nervousness after the mid-year
auction break finishes
+ High sheep prices are allowing many wool
producers with the opportunity to hold their - With purchases for European winter garments
clip back to an auction time of their choosing largely already sold, there may be a reduction in
demand
+ Recent wool prices stayed high, despite
increased volumes on the market - Farmers selling sheep skins are seeing increased
competition from synthetics, challenging historic
high prices
While Australian wool sales were until recently Another positive sign for many growers was the
paused for the mid-year auction recess, the strong prices for the medium and coarse microns.
medium term signs for the industry are looking For much of the recent rises in overall wool prices,
relatively good. Prices are strong, despite higher the finer wools have accounted for almost all
volumes of wool hitting the market, and the most growth. However, in the weeks leading up to the
recent gains have been felt by some of the high mid-year recess, medium wools saw even stronger
microns, rather than just the fine wool. growth than fine wool.
In the industry’s final sale before the break, the Looking ahead, in particular with the auctions
benchmark Eastern Market Indicator (EMI) closed at starting again mid-August, a number of industry
1428 c/kg, its highest price in sixteen months, and observers are predicting that the market will follow
up over 60 percent on its low of September 2020. its normal pattern for that time of the year, and
At the same time, wool sale volumes were also slow or dip slightly. Prices are likely to be driven
up considerably. For the first two sales of 2021/22, by several major variables. There is still likely to be
around 10,000 more bales were sold per week than a large volume of wool in the market, including
the previous year. stocks which had been held back for some time
by producers whose high meat sheep returns
From the increased volumes, it appeared that many
meant they had no great necessity to sell, but
growers who may have been holding their wool
who are now choosing to take advantage of the
clips back, waiting for higher prices, finally took the
higher prices.
opportunity to sell.
PAGE 18COMBINED HIGH WOOL AND LAMB PRICES BENEFITTING GROWERS
2,500 1,000
2,000
750
ESTLI (AC/kg (cwt))
EMI (Ac/kg)
1,500
500
1,000
250
500
- -
5
6
7
8
9
0
1
15
16
17
18
19
20
21
01
01
01
01
01
02
02
20
20
20
20
20
20
20
l/2
l/2
l/2
l/2
l/2
l/2
l/2
n/
n/
n/
n/
n/
n/
n/
Ju
Ju
Ju
Ju
Ju
Ju
Ju
Ja
Ja
Ja
Ja
Ja
Ja
Ja
Wool (EMI) ESTLI (RH axis)
Source: MLA, Bloomberg, ANZ
In terms of buying activity, a lot of the wool Sheep skins have evolved in their uses, major
required for garments for the coming Northern markets, and their competition, all of which have
Hemisphere winter will have already been impacted their prices. Traditionally, sheep skins
purchased, for processing and manufacture. were used for shoes and clothing, but are now
In addition, the impact of COVID-19 may also increasingly competing with synthetics, which
play a role. On one hand, the recovery by major can have the advantage of being cheaper to
economies could see a resurgence in demand produce. Lamb skins in particular were also popular
for woollen products, although the major social for footwear or medical use, though are less in
changes the disruptions have caused – such as demand than in previous years.
the growth in working from home leading to a
While Turkey and Russia had been major buyers
permanent shift in the demand for suits – may also
for sheep skins in the past, China is now the major
indicate as easing in demand.
customer.
An interesting side effect of the recent rise on wool
Despite the long term fall in lamb skin prices, there
prices has been an increase in the value of sheep
has been some recent recovery. Lamb skins, which
skin prices. While these are usually a small part of
had once fetched around $25-30, had fallen to $2-3,
most sheep producers’ operations, their price is
but over the past year had risen strongly to $7-8.
often the subject of industry discussion, and can
also be seen as one barometer of the industry’s
strength.
In recent months, the price of merino skins in
particular has continued to strengthen. For merino
skins with a 1.5 – 2 inch wool length, prices rose
by 30 percent in one month to June 2021, to reach
1742 cents. For skins with a 3 inch wool length,
prices reached 2633 cents. For each of these
specifications, the prices are largely driven by the
wool content of the skin.
PAGE 19DAIRY INSIGHTS
OVERVIEW
+ Consumers looking to connect more with - Property prices being driven up by producers
where their food comes from, spending more from other markets leading to farmers exiting
on branded cheese dairy
+ Opening prices increased as processors start - Global Dairy Trade auction prices have declined
bidding war for milk following a strong start to the year
+ Good seasonal conditions continue leading
to high expectations for a profitable year for
dairy farmers
Dairy farms, like much of agriculture in Australia, DAIRY FARM NUMBERS CONTINUE TO DECLINE
are going one of two ways, consolidation for scale Unfortunately, while the outlook is good for dairy
or boutique farm to table. During lockdowns the farmers there remain concerns in the industry
consumer demand for a link between farm and that a series of difficult years has led to many dairy
table is ever increasing. Consumers are looking farmers leaving the industry and taking advantage
to connect more with their food, hear the story of strong land prices. According to ABARES
behind the produce and farmers in a position to survey data, while the number of dairy businesses
provide this are receiving premium for this offering. operating is at an all-time low so too is the amount
Major supermarket brands are also direct sourcing of land under dairy as the average area operated
product for their home brands. Supermarkets are also declines. The ongoing strong price for beef and
moving up the value chain in many fresh produce other commodities is driving strong demand for
sectors and in dairy, they have already begun dairy country with land owners taking advantage of
investing directly in farmers selling their milk high prices.
through stores as a ‘shed to shelf’ offering.
It is likely supermarkets will be looking to take
advantage of the increase in sales of everyday
cheese ~4% which is currently being driven by
increased consumer spending on higher end
branded cheese as conscious consumers focus
on quality produce. Or, stuck at home during
lockdowns, are choosing to splurge on a nice
cheese platter.
PAGE 20DAIRY FARM BUSINESS NUMBERS CONTINUE TO FALL
16,000 350
14,000 300
12,000
250
Estimated farm numbers
Avg area operated (ha)
10,000
200
8,000
150
6,000
100
4,000
2,000 50
0 0
90
92
94
96
98
00
02
04
06
08
10
12
14
16
18
20
19
19
19
19
19
20
20
20
20
20
20
20
20
20
20
20
Source: ABARES, ANZ
DOMESTIC INDUSTRY EXPECTING IMPROVED Farmgate prices are on the up since a strong
PROFITABILITY start to the new season. A bidding war has put
With good seasonal conditions continuing in producers in the driver’s seat with processor
much of the country, increased rainfall is improving demand for milk driving up prices. The global
soil conditions and filling ground water reserves. position is looking good for domestic prices as
Improved grazing conditions has supported well, as production growth remains relatively
increased pasture grazing and this, along with constrained despite increasing demand as the
lower feed costs, has greatly improved farmer global economy recovers.
confidence. Opening prices were strong and have lifted with
The lower cost of feed along with strong opening a price bidding war playing out in the market.
prices has improved profitability for dairy farmers Fonterra lifted their average farmgate milk price
with Dairy Australia Situation and Outlook Report to $6.95/kg milk solids, up from the opening offer
indicating 88% of farmers are expecting a profit this of $6.55/kg milk solids. Meanwhile Saputo revised
financial year. their opening up 20cents to 6.85/kg milk solids just
3 days after the opening with Bega and Lactalis
also announcing increases in their price offered by
around 10 cents.
PAGE 21SOLID GLOBAL DAIRY DEMAND Global dairy prices have been in decline since a
International demand, particularly from Asia, for very strong start to the year. This has, however, seen
dairy products, especially milk powder, is being the solid gains from earlier in the years cemented
driven both by an economic recovery, as well as a at historically strong levels. The most recent GDT
post-COVID-19 increased focus on healthier diets. auction saw an overall fall in the average price of
Given these strong fundamentals, dairy assets are 2.9 per cent to $US3,839. This represents the 7th
likely to remain attractive to investors. month of price index decline.
AUSTRALIAN FARMGATE PRICES LAG GLOBAL DAIRY TRADE AUCTIONS
7,000 56
6,000 54
52
5,000
50
4,000
48
3,000
46
2,000
44
1,000 42
0 40
Apr-18
May-18
Jun-18
Jul-18
Aug-18
Sep-18
Oct-18
Nov-18
Dec-18
Jan-19
Feb-19
Mar-19
Apr-19
May-19
Jun-19
Jul-19
Aug-19
Sep-19
Oct-19
Nov-19
Dec-19
Jan-20
Feb-20
Mar-20
Apr-20
May-20
Jun-20
Jul-20
Aug-20
Sep-20
Oct-20
Nov-20
Dec-20
Jan-21
Feb-21
Mar-21
Apr-21
May-21
Jun-21
Jul-21
Whole milk powder - GDT Skim milk powder - GDT Cheddar - GDT
Milk fat - GDT Farmgate price (RH axis)
Source: GDT, ABARES, ANZ
PAGE 22COTTON INSIGHTS
OVERVIEW
+ Cotton fibre as a sustainable plant-based option - Unpredictable access to water impacting cotton
is becoming more popular farmers ability to plant consistently
+ Cotton prices improving to above $600 per - Limited infrastructure increasing costs for
bale farmers moving to new regions
The unpredictable nature of cropping in the Murray While some producers seek to secure land with
Darling Basin is leading to some cotton farmers more secure water rights Cotton Australia is seeking
venturing north to seek out more secure rainfall buyers for what some are saying may be a record
in central and north Australia. Often considered crop in 2022 just 2 years after the 40 year lows of
desert, parts of north-west Queensland and 2020. The USDA is predicting Australia to reach 3.9
the Northern Territory, Gulf country, receives million bales in 2021/22.
huge volumes of water during the wet season.
Harnessing this could change the landscape for AUSTRALIAN COTTON AS A SUSTAINABLE
Australian cotton. FIBRE OPTION
Cotton Australia has named Katherine, Kununurra Cotton Australia will aim to promote Australian
and Georgetown as emerging cotton growing cotton fibre as sustainable, renewable and
areas. It’s early days with many of these farmers in biodegradable. As traceability improves, buyers
their first couple of years and limited infrastructure can ensure they are purchasing from farms using
for cotton processing is forcing them to ship bails water sustainably and as a plant-based fibre there
south to gins in central and southern Queensland. is also the possibility to market the product as
While this may appear an expensive exercise, local Carbon Positive and environmentally sustainable,
support has made this a worthwhile and valuable making it an excellent choice for environmentally
experiment. Time will tell if this bet will pay off for conscious consumers concerned about the life
the early leaders. cycle of their apparel.
PAGE 23INCREASED CONSUMER CONFIDENCE The two largest producers are expected to be
STRENGTHENING GLOBAL DEMAND FOR India at 24 percent, with China contributing 22
COTTON
percent of cotton production. China’s production is
Not only has it been a better year for planting projected to fall 9 percent to 27 million bales with
cotton but cotton prices have improved, edging both a reduction in area and yield expected.
above $600 per bale. This is due to increased World mill use is improving, up around 4 percent
demand from countries returning to post COVID-19 on 2020/21 with increased global confidence in
normal and projected cotton stocks dropping to improving economies.
the lowest level in 3 years. The predictions for stock
to use ratio has also increased to around 71%.
The USDA global cotton projection indicates an
expected increase of 6 percent in 2021/22 year to
119million bales.
WATER STORAGE INCREASES IN THE NORTHERN MURRAY DARLING BASIN ARE LEADING TO
INCREASES PLANTING AND PRODUCTION EXPECTATIONS
3,000 90
80
2,500
70
2,000 60
50
1,500
40
1,000 30
20
500
10
0 0
2019–20
1990–91
1991–92
1992–93
1993–94
1994–95
1995–96
1996–97
1997–98
1998–99
1999–00
2000–01
2001–02
2002–03
2003–04
2004–05
2005–06
2006–07
2007–08
2008–09
2009–10
2010–11
2011–12
2012–13
2013–14
2014–15
2015–16
2016–17
2017–18
2020–21 f
2018–19
Gross Value $m Area '000 ha Northern MDB water storage (%) (RH axis)
Source: BOM, ABARES, ANZ
PAGE 24ECONOMIC INSIGHTS
Delta to hit economic activity in the short term,
but a strong rebound is likely
ECONOMY TO SHRINK IN Q3 DUE TO DELTA Sydney as well as Melbourne, flowing through to
Persistent lockdowns will remove any chance lower household incomes.
of growth in economic activity through Q3, as
household consumption and businesses are limited HOUSEHOLDS HAVE MORE MONEY AND
CONFIDENCE THAN LAST YEAR
by physical restrictions. While Melbourne is likely to
see lockdown end by September or October, it is National consumer confidence has now fallen to a
likely that the Sydney lockdown continues into Q4, similar extent as the decline during Victoria’s second
slowing the recovery in economic activity. The much lockdown, but the level of confidence is much
greater transmissibility of the Delta variant and the higher than last year. This is because the economy
possibility of a longer lockdown in Sydney or further was in a stronger position at the start of the Sydney
contagion into other states is a key element of lockdown than it was when Victoria’s began.
uncertainty for the remainder of 2021 and into 2022. The turn in confidence during Victoria’s second
lockdown came when daily case numbers started
BUSINESSES ARE MORE CONFIDENT to fall, even though the lockdown extended well
THAN LAST YEAR DESPITE WIDESPREAD beyond that. We think this pattern will likely repeat.
LOCKDOWNS
The latest business confidence and conditions SPENDING USUALLY BOUNCES BACK RIGHT
data has been impacted by recent lockdowns, but AFTER LOCKDOWNS
they remain well above historical lows. Indeed, Ongoing fiscal support, strong housing price
business conditions were at record highs before the growth, resilient household incomes and low
recent Sydney and Melbourne lockdowns. While interest rates will support household spending
the Sydney outbreak and lockdown has removed outcomes once restrictions ease. The recoveries
the likelihood of positive economic growth in Q3, in ANZ-observed spending from Melbourne’s
business balance sheets are in good shape and fourth and fifth lockdowns were immediate,
most will be able to recover quickly post-lockdown. and we should see a swift rebound in Sydney
and Melbourne spending once their respective
WE EXPECT THE UNEMPLOYMENT RATE TO lockdowns are over.
INCREASE SOON BUT THEN FALL IN Q4
Employers are likely to hold onto their employees WE NO LONGER EXPECT THE AUD TO MOVE
through lockdowns, particularly because of the UP TO 0.80 USD
current difficulty to find workers. This, combined The AUD has continued to undershoot our forecasts
with fiscal support including disaster payments, as it remains untethered to the performance of
will mitigate the lockdowns’ effects on employment commodity markets. We don’t see this relationship
and the unemployment rate. We expect the normalising in the next 12 months. We expect that
unemployment rate (4.6% as at the latest July the AUD can re-test USD0.78 by year-end, but a
data) to rise only modestly over the next couple of move to USD0.80 looks like a stretch. The weaker
months, before resuming its downward trend. outlook for the AUD will help the competitiveness of
While the rise in the unemployment rate will be exports, including agricultural goods.
quite modest, hours worked will fall sharply in
PAGE 25SPENDING TENDS TO SPIKE AFTER LOCKDOWNS, WHICH COULD SPEED UP AN ECONOMIC
RECOVERY AS RESTRICTIONS EASE
180 Christmas
Post Post
lockdown lockdown
spike spike
160
ANZ-observed spending (week-to)
Post
Index: Week to 7 Jan 2020 = 100.0
lockdown
spike
140
#2 #3
#1 #4 #5
120
100
Easter
80
60
1-Jan-20
1-Feb-20
1-Mar-20
1-Apr-20
1-May-20
1-Jun-20
1-Jul-20
1-Aug-20
1-Sep-20
1-Oct-20
1-Nov-20
1-Dec-20
1-Jan-21
1-Feb-21
1-Mar-21
1-Apr-21
1-May-21
1-Jun-21
1-Jul-21
1-Aug-21
AU Total Melbourne Total
Source: ANZ Research
CONSUMER CONFIDENCE IS DOWN ACROSS THE COUNTRY, BUT STILL FAR STRONGER THAN
LAST YEAR
140
132
124
116
108
100
92
84
76
68
60
17 18 19 20 21
Sydney Melbourne Australia National average since 1990
Source: ANZ-Roy Morgan
PAGE 26CONTACTS
MARK BENNETT IAN HANRAHAN
Head of Agribusiness & Specialised Commercial, Head of Food, Beverage & Agribusiness,
Commercial Banking Australia – Institutional Banking
T: +61 3 8655 4097 T: +61 7 3947 5299
E: mark.bennett@anz.com E: ian.hanrahan@anz.com
AUTHORS
MICHAEL WHITEHEAD MADELEINE SWAN
Head of Agribusiness Associate Director Agribusiness Research,
Insights, Institutional Commercial Banking
T: +61 3 8655 6687 T: +61 419 897 483
E: michael.whitehead@anz.com E: madeleine.swan@anz.com
BRYONY CALLANDER ADELAIDE TIMBRELL
Associate Director Agribusiness Research, Economist, ANZ Research
Commercial Banking T: +61 466 850 588
T: +61 3 8654 2563 E: adelaide.timbrell@anz.com
E: bryony.callander@anz.com
SWATI THAKUR
Analyst, Institutional Client Insights & Solutions
T: +91 8067 953 039
E: swati.thakur@anz.com
PAGE 28DISCLAIMER
The distribution of this document or streaming of this video broadcast (as applicable, (“Affiliates”), do not make any representation as to the accuracy, completeness or
“publication”) may be restricted by law in certain jurisdictions. Persons who receive currency of the views or recommendations expressed in this publication. Neither
this publication must inform themselves about and observe all relevant restrictions. ANZ nor its Affiliates accept any responsibility to inform you of any matter that
1. Disclaimer for all jurisdictions, where content is authored by ANZ Research: subsequently comes to their notice, which may affect the accuracy, completeness
or currency of the information in this publication.
Except if otherwise specified in section 2 below, this publication is issued and
distributed in your country/region by Australia and New Zealand Banking Group Except as required by law, and only to the extent so required: neither ANZ nor its
Limited (ABN 11 005 357 522) (“ANZ”), on the basis that it is only for the information Affiliates warrant or guarantee the performance of any of the products or services
of the specified recipient or permitted user of the relevant website (collectively, described in this publication or any return on any associated investment; and, ANZ
“recipient”). This publication may not be reproduced, distributed or published by and its Affiliates expressly disclaim any responsibility and shall not be liable for
any recipient for any purpose. It is general information and has been prepared any loss, damage, claim, liability, proceedings, cost or expense (“Liability”) arising
without taking into account the objectives, financial situation or needs of any directly or indirectly and whether in tort (including negligence), contract, equity or
person. Nothing in this publication is intended to be an offer to sell, or a solicitation otherwise out of or in connection with this publication.
of an offer to buy, any product, instrument or investment, to effect any transaction If this publication has been distributed by electronic transmission, such as
or to conclude any legal act of any kind. If, despite the foregoing, any services or e-mail, then such transmission cannot be guaranteed to be secure or error-free
products referred to in this publication are deemed to be offered in the jurisdiction as information could be intercepted, corrupted, lost, destroyed, arrive late or
in which this publication is received or accessed, no such service or product is incomplete, or contain viruses. ANZ and its Affiliates do not accept any Liability as
intended for nor available to persons resident in that jurisdiction if it would be a result of electronic transmission of this publication.
contradictory to local law or regulation. Such local laws, regulations and other ANZ and its Affiliates may have an interest in the subject matter of this publication
limitations always apply with non-exclusive jurisdiction of local courts. Before as follows:
making an investment decision, recipients should seek independent financial,
legal, tax and other relevant advice having regard to their particular circumstances. • They may receive fees from customers for dealing in the products or services
described in this publication, and their staff and introducers of business may
The views and recommendations expressed in this publication are the author’s. share in such fees or receive a bonus that may be influenced by total sales.
They are based on information known by the author and on sources which the
author believes to be reliable, but may involve material elements of subjective • They or their customers may have or have had interests or long or short
judgement and analysis. Unless specifically stated otherwise: they are current positions in the products or services described in this publication, and may at
on the date of this publication and are subject to change without notice; and, any time make purchases and/or sales in them as principal or agent.
all price information is indicative only. Any of the views and recommendations • They may act or have acted as market-maker in products described in this
which comprise estimates, forecasts or other projections, are subject to significant publication.
uncertainties and contingencies that cannot reasonably be anticipated. On this ANZ and its Affiliates may rely on information barriers and other arrangements to
basis, such views and recommendations may not always be achieved or prove to control the flow of information contained in one or more business areas within
be correct. Indications of past performance in this publication will not necessarily ANZ or within its Affiliates into other business areas of ANZ or of its Affiliates.
be repeated in the future. No representation is being made that any investment
will or is likely to achieve profits or losses similar to those achieved in the past, or Please contact your ANZ point of contact with any questions about this publication
that significant losses will be avoided. including for further information on these disclosures of interest.
Additionally, this publication may contain ‘forward looking statements’. Actual 2. Country/region specific information:
events or results or actual performance may differ materially from those reflected Australia. This publication is distributed in Australia by ANZ. ANZ holds an
or contemplated in such forward looking statements. All investments entail a risk Australian Financial Services licence no. 234527. A copy of ANZ’s Financial
and may result in both profits and losses. Foreign currency rates of exchange may Services Guide is available at http://www.anz.com/documents/AU/aboutANZ/
adversely affect the value, price or income of any products or services described FinancialServicesGuide.pdf and is available upon request from your ANZ point of
in this publication. The products and services described in this publication are contact. If trading strategies or recommendations are included in this publication,
not suitable for all investors, and transacting in these products or services may they are solely for the information of ‘wholesale clients’ (as defined in section 761G
be considered risky. ANZ and its related bodies corporate and affiliates, and the of the Corporations Act 2001 Cth). Persons who receive this publication must
officers, employees, contractors and agents of each of them (including the author) inform themselves about and observe all relevant restrictions.You can also read