Baseline global longitudinal strain predictive of anthracycline-induced cardiotoxicity
←
→
Page content transcription
If your browser does not render page correctly, please read the page content below
Araujo-Gutierrez et al. Cardio-Oncology    (2021) 7:4
https://doi.org/10.1186/s40959-021-00090-2

 RESEARCH                                                                                                                                          Open Access

Baseline global longitudinal strain
predictive of anthracycline-induced
cardiotoxicity
Raquel Araujo-Gutierrez1, Kalyan R. Chitturi1,2, Jiaqiong Xu1,3, Yuanchen Wang1, Elizabeth Kinder1, Alpana Senapati1,
L. Bindu Chebrolu1, Mahwash Kassi1 and Barry H. Trachtenberg1*

  Abstract
  Background: Cancer therapy-related cardiac dysfunction (CTRD) is a major source of morbidity and mortality in
  long-term cancer survivors. Decreased GLS predicts decreased left ventricular ejection fraction (LVEF) in patients
  receiving anthracyclines, but knowledge regarding the clinical utility of baseline GLS in patients at low-risk of
  (CTRD) is limited.
  Objectives: The purpose of this study was to investigate whether baseline echocardiographic assessment of global
  longitudinal strain (GLS) before treatment with anthracyclines is predictive of (CTRD) in a broad cohort of patients
  with normal baseline LVEF.
  Methods: Study participants comprised 188 patients at a single institution who underwent baseline 2-dimensional
  (2D) speckle-tracking echocardiography before treatment with anthracyclines and at least one follow-up
  echocardiogram 3 months after chemotherapy initiation. Patients with a baseline LVEF  10% from baseline and an
  overall reduced LVEF
Araujo-Gutierrez et al. Cardio-Oncology   (2021) 7:4                                                         Page 2 of 8

Introduction                                                   regional tracking in > 2 myocardial segments), an abnor-
Routinely used in the treatment of hematologic malig-          mal left ventricular ejection fraction (LVEF)  180 mmHg or diastolic blood
within the first year of treatment in patients who are         pressure > 100 mmHg before treatment were excluded
monitored prospectively. Known risk factors include            (Fig. 1). Each chart was accessed for baseline
high cumulative dose (i.e. doxorubicin ≥250 mg/m2) or
any dose combined with radiation therapy in the heart
field, sequential use of HER 2? her-2 antagonists, age>
60 years, cardiovascular risk factors, and compromised
cardiac function (e.g. LVEF
Araujo-Gutierrez et al. Cardio-Oncology   (2021) 7:4                                                            Page 3 of 8

demographics (including age, vitals, cardiovascular (CV)       survival at 1-year, 3-year, and 5-year intervals between
risk factors, medical comorbidities), echocardiography         decreased and normal GLS were compared with the
studies, and clinical outcomes (symptomatic heart fail-        pseudo-value approach [12]. Cumulative incidence of
ure, CV mortality, and non-CV death).                          cardiovascular related mortality was calculated after ad-
  Pre-existing cardiovascular risk factors and medical         justed for the competing risk of non-cardiovascular
comorbidities extracted from the electronic medical re-        death. Univariable and multivariable Cox proportional
cords, included: body mass index (BMI), tobacco use,           hazards regression models were used to examine associ-
diabetes, hypertension, hyperlipidemia, coronary artery        ations between demographics and clinical variables with
disease, hypothyroidism, and a family history of athero-       CTRD. The multivariable model included baseline GLS
sclerotic cardiovascular disease. Cumulative anthracy-         and variables selected from backward elimination with
cline dose was calculated based on the following rapid         the significance level for removal from the model of
infusion doxorubicin CTRD equivalence: epirubicin,             0.05. The full model included all statistically significant
0.66; daunorubicin, 0.75; and idarubicin, 0.53 [10, 11].       variables with p-value < 0.05 in the univariable models.
                                                               Subsequently, the same multivariable analysis was done
Echocardiography strain protocol and endpoints                 when GLS modeled as a categorical variable (decreased
The primary endpoint of the study was CTRD, defined            vs. normal). The Cox proportionality assumption was
as an LVEF  10% in LVEF             verified by including time-dependent interactions of co-
from baseline echocardiography. LVEF was calculated            variates with survival time in the models. There were no
using quantitative (modified Simpson’s biplane method)         violations of this assumption in all models. The Hosmer
and/or visual analysis of LVEF according to the Ameri-         and Lemeshow type goodness-of-fit statistics for the Cox
can Society of Echocardiography standards [12].                proportional hazards model was used to check the
  The vendors utilized in the strain analysis included the     model fitting [14].
most recent upgraded versions of GE EchoPAC and                  All analyses were performed with STATA version 16
TomTec Image-Arena. The endocardial borders were               (StataCorp. 2019. Stata Statistical Software: Release 16.
traced from 3 apical viewers. Global longitudinal strain       College Station, TX: StataCorp LLC). Statistical signifi-
was calculated by measuring the entire endocardial line        cance was defined as two-tailed p < 0.05 for all tests.
length at the end-diastole and end-systole in each view
and averaging the results from the 3 views. Each meas-
urement was taken from the average of 3 consecutive            Results
cardiac cycles. The strain quality was assessed objectively    CTRD vs normal
by a second observer as bad if more than two segments          A total of 188 patients were included in our study.
were un-visualized.                                            Twenty-three patients (12.23%) had CTRD during their
  Secondary end points of all-cause mortality and CV           treatment course. Baseline characteristics are presented
mortality were assessed between the patients with nor-         by CTRD in Table 1. The mean baseline GLS of patients
mal and decreased baseline GLS. Decreased baseline             who experienced cardiotoxicity CTRD during treatment
GLS was defined as ≥-18% [13].                                 with anthracyclines significantly differed from the mean
                                                               baseline GLS of patients who did not have CTRD
Statistical analysis                                           (-17.51% ± 2.77% vs -19.36% ± 2.86%; p = 0.004). Patients
Baseline characteristics were summarized according to          in the CTRD group were more likely to be male (52.17%
CTRD status and baseline GLS status (abnormal vs nor-          vs 30.30%, p = 0.056) and were older (60.87 ± 10.89 vs
mal). All data were presented as mean ± SD for continu-        52.92 ± 14.59, p = 0.013). A history of hypertension was
ous variables and number and % for categorical                 more common in the CTRD group (69.57% vs 38.79%,
variables. Chi-square or Fisher’s exact test for categorical   p = 0.007) and CTRD patients also had higher baseline
variables and t-test or Mann-Whitney test for continu-         systolic blood pressure (137.74 ± 23.86 vs 128.22 ± 16.35,
ous variables were used to determine association of pre-       p = 0.015). In addition, patients with CTRD were more
treatment variables with decreased baseline GLS and            likely to be treated for a hematologic malignancy
CTRD. The normality assumption was tested by the Sha-          (78.26% vs 49.09%, p = 0.018). Although within normal
piro –Wilk tests.                                              values, LVEF was significantly lower in the CTRD group
  Kaplan-Meier survival curves for overall mortality was       (61.7 ± 4.60 vs 64.43 ± 3.73, p = 0.002). Cumulative
calculated in strata defined by decreased vs. normal           anthracycline dose was lower in the CTRD group
GLS. Time-on-study was used as time scale in all sur-          (118.02 mg/m2 ± 93.32 mg/m2 vs 175.62 mg/m2 ± 102.49
vival analyses: Time begins at first anthracycline dose        mg/m2, p = 0.013). However, there was no significant
and ends in date of death or date of last follow-up. Two-      difference in the total number of cycles in patients with
sided log rank tests defined significance. The overall         CTRD vs controls, when grouping by breast cancer vs all
Araujo-Gutierrez et al. Cardio-Oncology (2021) 7:4 Page 4 of 8
Table 1 Baseline characteristic by cardiotoxicity (defined as drop EF>10% from baseline and EF< 50% at each time measurement)
Total Cardiotoxicity P-
N = 188 value
No Yes
N = 165 N = 23
Age (years) 53.89 ± 14.40 52.92 ± 14.59 60.87 ± 10.89 0.013
Male 62 (32.98) 50 (30.3) 12 (52.17) 0.056
BMI (kg/m2) 28.40 ± 6.08 28.40 ± 6.20 28.44 ± 5.19 0.98
Race 0.40
Asian 5 (2.66) 5 (3.03) 0 (0.00)
Black 24 (12.77) 21 (12.73) 3 (13.04)
Caucasian 99 (52.66) 84 (50.91) 15 (65.22)
Hispanic 50 (26.60) 47 (28.48) 3 (13.04)
Other 10 (5.32) 8 (4.85) 2 (8.70)
Systolic 129.42 ± 17.68 128.22 ± 16.35 137.74 ± 23.86 0.015
Diastolic 70.97 ± 10.66 70.67 ± 10.62 73.09 ± 10.93 0.31
Heart Rate 76.38 ± 13.31 76.23 ± 13.28 77.53 ± 13.85 0.69
Family history of Heart Disease 19 (10.11) 15 (9.09) 4 (17.39) 0.26
Diabetes 35 (18.62) 29 (17.58) 6 (26.09) 0.39
Hypertension 80 (42.55) 64 (38.79) 16 (69.57) 0.007
Hyperlipidemia 52 (27.66) 44 (26.67) 8 (34.78) 0.46
Coronary Artery Disease 9 (4.79) 8 (4.85) 1 (4.35) 1.00
Hypothyroidism 21 (11.17) 20 (12.12) 1 (4.35) 0.48
Smoking 48 (25.53) 33 (20.00) 15 (65.22) < 0.001
Ejection Fraction 64.09 ± 3.94 64.43 ± 3.73 61.70 ± 4.60 0.002
Baseline GLS -19.13 ± 2.91 -19.36 ± 2.86 -17.51 ± 2.77 0.004
Cancer type 0.018
Breast 80 (42.55) 76 (46.06) 4 (17.39)
Hematologic 99 (52.66) 81 (49.09) 18 (78.26)
Other 9 (4.79) 8 (4.85) 1 (4.35)
Chemotherapy dose 168.70 ± 102.91 175.62 ± 102.49 118.02 ± 93.32 0.013
Data were presented as mean ± SD for continuous variables and number (%) for categorical variables. Chi-square or Fisher’s exact test (categorical variables) and t-
test or Mann-Whitney test (continuous variables) were used to compare patients between cardiotoxicity status
other cancers (4.5 vs 3.9, P value 0.25, for breast cancer with CTRD (HR = 1.20, 95% CI: 1.05, 1.38; p = 0.01 for
and 3.3 vs 3.9, P value 0.26, for all other cancers). continuous and HR = 4.44, 95% CI: 1.83, 10.8; p < 0.001 as
categorical). In addition to GLS, age, male gender, baseline
Decreased versus normal baseline GLS systolic pressure, baseline LVEF, history of hypertension
Patients with an decreased baseline GLS were most and tobacco use, breast cancer, and cumulative chemo-
likely male (43.94% vs 27.05%, p = 0.023), had a higher therapy dose were found significant in the univariable
BMI (30.03 ± 5.99 vs 27.53 ± 5.96, p = 0.007), and had a model for CTRD. In the multivariable analysis, baseline
lower baseline LVEF (62.39% ± 4.43% vs. 65.01% ± 3.32%, GLS as continuous variable or decreased GLS (≥(-18%)),
p < 0.001). There were no differences in age, comorbidi- baseline systolic pressure, history of tobacco use, and
ties, baseline blood pressure and heart rate (by echocar- chemotherapy dose were significant (Table 3). The final
diogram report) or cancer type (Table 2). models fitted well (the p-values for the Hosmer-
Lemeshow type goodness-of-fit from likelihood-ratio test
Univariable and multivariable analyses were p = 0.79 when GLS as continuous variable and p =
Median time to > 10% reduction in LVEF was 107 days 0.51 when GLS as categorical variable).
(range 12.5-729). In a univariable Cox proportional haz- The optimal cutoff point for GLS at baseline with
ards regression analysis, baseline GLS as continuous vari- CTRD was -18.05%. The sensitivity was 0.70 and specifi-
able or categorical variable was significantly associated city was 0.70. The area under ROC curve was 0.70.Araujo-Gutierrez et al. Cardio-Oncology (2021) 7:4 Page 5 of 8
Table 2 Baseline characteristic by baseline GLS [Decreased GLS defined as GLS≥(-18%)]
Total Decreased Baseline GLS P-
N = 188 value
No Yes
N = 122 N = 66
Age (years) 53.89 ± 14.40 53.62 ± 14.86 54.38 ± 13.60 0.73
Male 62 (32.98) 33 (27.05) 29 (43.94) 0.023
BMI (kg/m2) 28.40 ± 6.08 27.53 ± 5.96 30.03 ± 5.99 0.007
Race 0.91
Asian 5 (2.66) 4 (3.28) 1 (1.52)
Black 24 (12.77) 14 (11.48) 10 (15.15)
Caucasian 99 (52.66) 65 (53.28) 34 (51.52)
Hispanic 50 (26.60) 33 (27.05) 17 (25.76)
Other 10 (5.32) 6 (4.92) 4 (6.06)
Systolic 129.42 ± 17.68 127.97 ± 16.42 132.17 ± 19.69 0.13
Diastolic 70.97 ± 10.66 69.97 ± 9.84 72.86 ± 11.91 0.083
Heart Rate 76.38 ± 13.31 76.06 ± 12.80 76.95 ± 14.27 0.68
Family History of Heart Disease 19 (10.11) 13 (10.66) 6 (9.09) 0.81
Diabetes 35 (18.62) 19 (15.57) 16 (24.24) 0.17
Hypertension 80 (42.55) 50 (40.98) 30 (45.45) 0.64
Hyperlipidemia 52 (27.66) 35 (28.69) 17 (25.76) 0.73
Coronary Artery Disease 9 (4.79) 4 (3.28) 5 (7.58) 0.28
Hypothyroidism 21 (11.17) 16 (13.11) 5 (7.58) 0.33
Smoking 48 (25.53) 27 (22.13) 21 (31.82) 0.16
Ejection Fraction 64.09 ± 3.94 65.01 ± 3.32 62.39 ± 4.43 < 0.001
Cancer type 0.24
Breast 80 (42.55) 57 (46.72) 23 (34.85)
Hematologic 99 (52.66) 60 (49.18) 39 (59.09)
Other 9 (4.79) 5 (4.10) 4 (6.06)
Chemotherapy dose 168.70 ± 102.91 165.56 ± 95.49 174.27 ± 115.47 0.58
Data were presented as mean ± SD for continuous variables and number (%) for categorical variables. Chi-square or Fisher’s exact test (categorical variables) and t-
test or Mann-Whitney test (continuous variables) were used to compare patients between abnormal and normal GLS
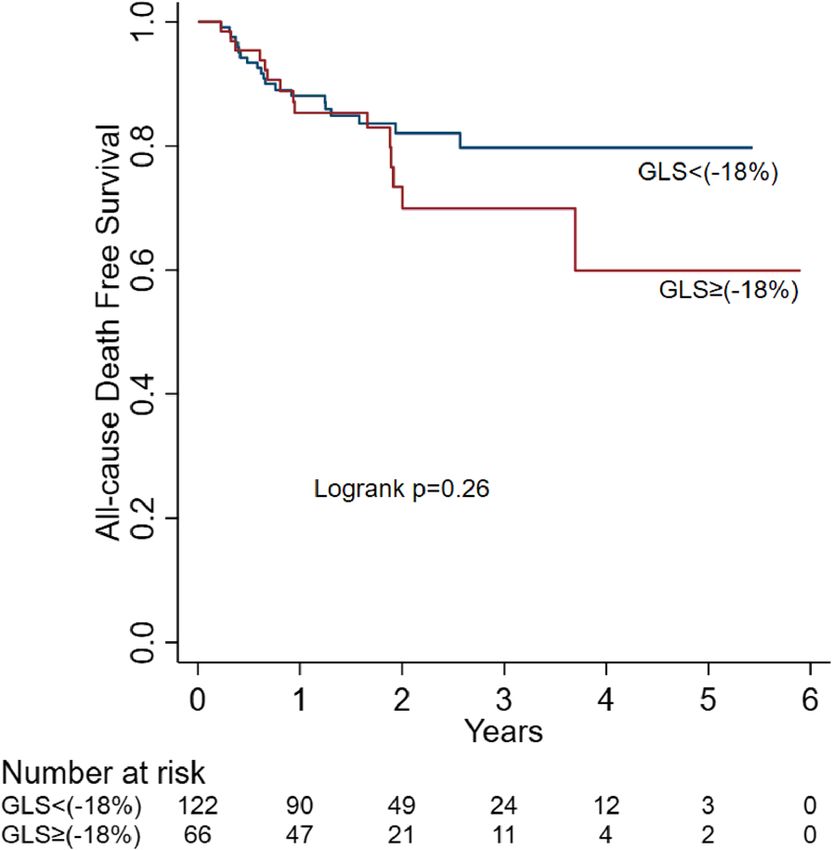
There was no significant difference in overall all-cause group with an abnormal baseline GLS despite a lower cu-
mortality between patients with decreased vs. normal mulative anthracycline dose in this group compared to
baseline GLS strain (log-rank p = 0.26). The p values for controls.
the survival comparison between GLS≥ (-18%) vs GLS< The American Society of Clinical Oncology (ASCO)
(-18%) are 0.67 at 1 year, 0.33 at 3 years and 0.13 at 5 recommends heightened monitoring for patients at higher
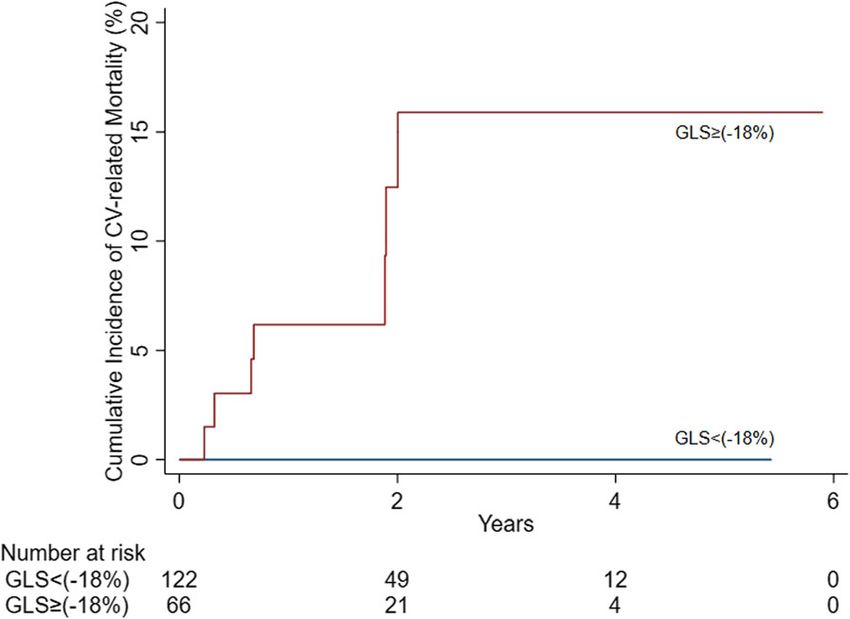
years, respectively (Fig. 2, Table 4). However, CV-related risk of CTRD, and these risk factors include higher dose,
mortality was significantly higher in the decreased concomitant her-2 antagonists or chest radiation, age,
GLS>-18% group (Log-rank p < 0.001) (Fig. 3). traditional cardiac risk factors, and prior myocardial in-
farction. In addition, compromised cardiac function by
Discussion imaging --specifically valvular disease or LVEF < 55%-- are
In this study, we found that patients with normal LVEF and considered risk factors. The use of baseline strain assess-
decreased baseline GLS were more likely not only to de- ment by itself as a risk assessment (as opposed to its meas-
velop CTRD, defined by a drop of EF > 10% points and to urement only to establish a baseline to measure
final value -18% was as- to emerging data that shows that consideration should be
sociated with a greater than 4-fold increased risk of CTRD. given to the inclusion of baseline GLS as risk factor by
Furthermore, there was an increased risk of CTRD in the itself.Araujo-Gutierrez et al. Cardio-Oncology (2021) 7:4 Page 6 of 8
Table 3 Hazards ratio (HR) and 95% CI for developing cardiotoxicity
Univariable Multivariable
HR (95% CI) p-value HR (95% CI) p-value
GLS 1.20 (1.05,1.38) 0.01 1.17 (1.00,1.36) 0.044
GLS[≥(-18%) vsAraujo-Gutierrez et al. Cardio-Oncology (2021) 7:4 Page 7 of 8
In addition to highlighting the increased risk associ-
ated with abnormal baseline GLS abnormalities, it re-
mains unknown if that risk can be mitigated by
cardioprotective strategies, Recently, for the first time,
the use of strain to guide clinical decision making has
been studied, demonstrating that using cardioprotective
medications for patients with a change in strain (12%
relative reduction) during chemotherapy can reduce the
incidence of CTRD. Future studies should investigate
cardioprotective strategies in patients with baseline GLS
abnormalities [17].
Study limitations
First, this is a single center study that was performed
Fig. 3 Cumulative incidence of CV-related mortality adjusted for retrospectively. Another limitation is that even though
competing risk of non-cardiovascular death patients with an LVEF < 55% were excluded from the
study, there was a small but statistically significant lower
less established, but other studies have also found that it baseline LVEF in the CTRD group. However, decreased
may predict CTRD. Our study has two important distin- baseline GLS was more predictive than LVEF in predict-
guishing features from the prior studies. First, most of ing CTRD, reinforcing the concept that baseline GLS
these studies have only been in patients with has additional utility in identifying patients at low pre-
hematological malignancies, which have a higher upfront treatment risk of anthracycline CTRD. Finally, there
anthracycline exposure. This is the first study to date to were important baseline differences and thus potential
our knowledge evaluating decreased baseline GLS in a confounding factors between the groups, including
broad cohort of cancer patients with lower pre- higher blood pressure, history of hypertension, increased
treatment risk of developing anthracycline CTRD per age and more prevalent smoking history in the CTRD
ASCO. Patients with hematological malignancies were group. Regardless, baseline GLS was more predictive of
more likely to have CTRD than breast cancer patients. each of these factors in the multivariate analysis.
The second notable difference is that our study is the
only, to our knowledge, to exclude patients with border- Conclusion
line LVEF. Our study did not include anyone with an EF Baseline GLS has predictive value in identifying patients
< 55%, thus affirming that decreased baseline GLS has with low-to-moderate pre-treatment risk of anthracy-
clinical utility in predicting anthracycline CTRD in pa- cline CTRD. Furthermore, decreased baseline GLS may
tients with normal LVEF. One study found an abnormal be associated with increased CV mortality among pa-
baseline GLS (cutoff defined as >-15) to be the highest tients receiving anthracyclines. The results of this study
predictive factor in their risk score of patients with acute favor broader implementation of STE in cardio-oncology
leukemia. Importantly, 30 of the 450 patients in this practice for thorough risk stratification and identification
study had an LVEF < 53% at baseline and this character- of patients at higher risk for developing anthracycline-
istic was included in their risk score [9]. induced CTRD than indicated by pre-treatment comor-
In addition, decreased GLS was associated with an in- bidities and cancer therapy related risk factors.
crease in CV mortality. This reinforces findings from
other anthracycline studies. In a study of 450 patients Abbreviations
STE: 2-dimensional speckle tracking strain protocol echocardiography;
with hematological malignancies, baseline GLS >-17.5 BMI: Body mass index; CABG: Coronary artery bypass grafting; GLS: Global
was associated with a combination of cardiac death or longitudinal strain; LVEF: Left ventricular ejection fraction
symptomatic heart failure [7]. Although confounded by
Acknowledgements
inclusion of patients with a borderline LVEF 50-55%, Not applicable.
Kang et al. found that a GLS> -15 was associated with
all-cause mortality [9]. Currently, abnormal GLS in and Disclosures
The authors have no relevant disclosures.
of itself is not established in guidelines to represent
Stage B heart failure, although there is evidence and de- Authors’ contributions
bate in favor of the inclusion [15, 16]. Our study adds RA, KC, and YC retrospectively collected and analyzed all clinical data. JX
additional support that decreased GLS represents may performed statistical analyses. AS and CB analyzed echocardiogram images
and data. RA and BT were major contributors in writing the manuscript. EK,
represent microstructural changes in myocardium with MK and JX contributed to manuscript writing and editing. BT verified and
significant prognostic implications. supervised all the findings of this work. All authors discussed the results andAraujo-Gutierrez et al. Cardio-Oncology (2021) 7:4 Page 8 of 8
contributed to the final manuscript. All authors read and approved the final 12. Voigt JU, Pedrizzetti G, Lysyansky P, et al. Definitions for a common
manuscript. standard for 2D speckle tracking echocardiography: consensus document of
the EACVI/ASE/Industry Task Force to standardize deformation imaging. J
Funding Am Soc Echocardiogr. 2015;28:183–93.
Internal funding sources were used for the purpose of this study. 13. Liu JE, Barac A, Thavendiranathan P, Scherrer-Crosbie M. Strain imaging in
cardio-oncology. JACC CardioOncol. 2020;2:677–89.
Availability of data and materials 14. Balakrishnan N, Rao CR. Advances in survival analysis, vol. 23. 1st ed.
The datasets used and/or analyzed during the current study are available Amsterdam; Boston: Elsevier North-Holland; 2004. p. 383–94.
from the corresponding author on reasonable request. 15. Wang Y, Yang H, Huynh Q, Nolan M, Negishi K, Marwick TH. Diagnosis of
nonischemic stage B heart failure in type 2 diabetes mellitus: optimal
Ethics approval and consent to participate parameters for prediction of heart failure. JACC Cardiovasc Imaging. 2018;
This study was performed under our Institutional Review Board Approval. 11:1390–400.
16. Kale P, Afzal A. Stage B heart failure: to strain or not to strain. JACC
Cardiovasc Imaging. 2018;11:1401–4.
Consent for publication
17. Negishi T, Thavendiranathan P, Penicka M, et al. Cardioprotection using
Consent to participate and consent for publication were not applicable to
strain-guided management of potentially cardiotoxic cancer therapy: 1 year
this retrospective chart review study.
results of the SUCCOUR trial. Eur Heart J. 2020;41(Supplement_2):ehaa946–
3282.
Competing interests
The authors declare that they have no competing interests. The authors
report no disclosures or conflicts of interest. Publisher’s Note
Springer Nature remains neutral with regard to jurisdictional claims in
Author details published maps and institutional affiliations.
1
Houston Methodist DeBakey Heart and Vascular Center, 6550 Fannin St.,
Suite 1901, Houston, Texas 77030, USA. 2Department of Medicine, Division of
Cardiovascular Medicine, University of Missouri-Columbia, Columbia, Missouri,
USA. 3Center for Outcomes Research, Houston Methodist Research Institute,
Houston, Texas, USA.
Received: 27 September 2020 Accepted: 19 January 2021
References
1. Armenian SH, Lacchetti C, Barac A, et al. Prevention and monitoring of
cardiac dysfunction in survivors of adult cancers: American Society of
Clinical Oncology Clinical Practice Guideline. J Clin Oncol. 2017;35:893–911.
2. Thavendiranathan P, Poulin F, Lim KD, Plana JC, Woo A, Marwick TH. Use of
myocardial strain imaging by echocardiography for the early detection of
cardiotoxicity in patients during and after cancer chemotherapy: a
systematic review. J Am Coll Cardiol. 2014;63:2751–68.
3. Charbonnel C, Convers-Domart R, Rigaudeau S, et al. Assessment of global
longitudinal strain at low-dose anthracycline-based chemotherapy, for the
prediction of subsequent cardiotoxicity. Eur Heart J Cardiovasc Imaging.
2017;18:392–401.
4. Oikonomou EK, Kokkinidis DG, Kampaktsis PN, et al. Assessment of
prognostic value of left ventricular global longitudinal strain for early
prediction of chemotherapy-induced cardiotoxicity: a systematic review and
meta-analysis. JAMA Cardiol. 2019;4:1007–18.
5. Plana JC, Galderisi M, Barac A, et al. Expert consensus for multimodality
imaging evaluation of adult patients during and after cancer therapy: a
report from the American Society of Echocardiography and the European
Association of Cardiovascular Imaging. J Am Soc Echocardiogr. 2014;27:911–
39.
6. Seidman A, Hudis C, Pierri MK, et al. Cardiac dysfunction in the trastuzumab
clinical trials experience. J Clin Oncol. 2002;20:1215–21.
7. Ali MT, Yucel E, Bouras S, et al. Myocardial strain is associated with adverse
clinical cardiac events in patients treated with anthracyclines. J Am Soc
Echocardiogr. 2016;29:522–527.e3.
8. Hatazawa K, Tanaka H, Nonaka A, et al. Baseline global longitudinal strain as
a predictor of left ventricular dysfunction and hospitalization for heart
failure of patients with malignant lymphoma after anthracycline therapy.
Circ J. 2018;82:2566–74.
9. Kang Y, Assuncao BL, Denduluri S, et al. Symptomatic heart failure in acute
leukemia patients treated with anthracyclines. JACC CardioOncol. 2019;1:
208–17.
10. Zamorano JL, Lancellotti P, Rodriguez Munoz D, et al. 2016 ESC position
paper on cancer treatments and cardiovascular toxicity developed under
the auspices of the ESC Committee for Practice Guidelines: the task force
for cancer treatments and cardiovascular toxicity of the European Society of
Cardiology (ESC). Eur Heart J. 2016;37:2768–801.
11. Ewer MS. Cancer and the heart. 3rd ed. Raleigh: PMPH USA; 2019. p. 1.
online resourceYou can also read