BASF in Antwerp
Report 2017
←
→
Page content transcription
If your browser does not render page correctly, please read the page content below
BASF in Antwerp Report 2017
FACTS & FIGURES

                   €167
                    INVESTMENTS
                                                            MILLION                                  33%
                                                                                                       ENVIRONMENTAL IMPACT
                    BASF has invested €160 million on average over                                     Our relative environmental impact, i.e. atmospheric
                    the past few years in ongoing expansion of the site.                               and water emissions and landfill waste per tonne of
                    In 2017, this sum went towards items including                                     manufactured product, has been cut by 33% over
                    optimisation in the steam cracker supply chain,                                    the past 10 years. In 2017, we succeeded in cutting
                    SAP and infrastructure.                                                            our volume of waste sharply.

€6,321
SALES/MILLION

In 2017, BASF Antwerp sales rose with al-
most 22%. The high availability factor of our
facilities together with increased prices and
volumes contributed substantially to this.

                            0.9
                            LOST TIME INJURY RATE
                                                                                                  90%
                                                                                                  HEAT RECOVERY

                            The lost time injury rate measures the                                We cover 90% of our heat requirement
                            number of incidents with lost time per mil-                           using a smart network between exothermic
                            lion worked hours. Safety is the top priority                         and endothermic chemical processes.
                            for BASF Antwerp.

                              3,159                                                                               175
                                                                     EMPLOYEES

                                                                     (END OF 2017)

                                                                                           NUMBER OF WORK PLACEMENTS/YEAR
                                                                                                                  This ranges from short observation
                                                                                                                  and experience placements to theses
                                                                                                                  and projects for an entire academic
                                                                                                                  year. Dual learning, in which students
                                                                                                                  spend up to 16 weeks on the shop
                                                                                                                  floor is the most intensive form.

  Cover photo: We form the best team, one of the strategic principles of the BASF Group.
Chemicals
The Chemicals segment comprises our business with Key data Chemicals 1 (million €)
basic chemicals and intermediates. Its portfolio ranges
from solvents and plasticizers to high-volume monomers 2017 2016 Change in %
and glues as well as raw materials for detergents, plas- Sales 16,331 12,905 27
tics, textile fibers, paints and coatings, crop protection Thereof Petrochemicals 6,389 5,035 27
and medicines. In addition to supplying customers in the Monomers 6,963 5,189 34
chemical industry and numerous other sectors, we also
Intermediates 2,979 2,681 11
ensure that other BASF segments are supplied with
chemicals for producing downstream products. EBITDA 5,374 3,114 73
Income from operations (EBIT) 4,208 1,953 115
EBIT before special items 4,233 2,032 108
Performance Products
Our Performance Products lend stability, color and bet- Key data Performance Products 1 (million €)
ter application properties to many everyday products.
Our product portfolio includes vitamins and other food 2017 2016 Change in %
additives in addition to ingredients for pharmaceuticals, Sales 16,217 15,558 4
personal care and cosmetics, as well as hygiene and Thereof Dispersions & Pigments 5,398 5,086 6
household products. Other products from this segment Care Chemicals 5,079 4,735 7
improve processes in the paper industry, in oil, gas and
Nutrition & Health 1,844 1,932 (5)
ore extraction, and in water treatment. They furthermore
enhance the efficiency of fuels and lubricants, the effec- Performance Chemicals 3,896 3,805 2
tiveness of adhesives and coatings, and the stability of EBITDA 2,427 2,577 (6)
plastics. Income from operations (EBIT) 1,510 1,678 (10)
EBIT before special items 1,416 1,777 (20)
Functional Materials & Solutions
In the Functional Materials & Solutions segment, we Key data Functional Materials & Solutions (million €)
bundle system solutions, services and innovative
products for specific sectors and customers, especially 2017 2016 Change in %
the automotive, electrical, chemical and construction Sales 20,745 18,732 11
industries, as well as applications for household, sports Thereof Catalysts 6,658 6,263 6
and leisure. Our portfolio comprises catalysts, battery Construction Chemicals 2,412 2,332 3
materials, engineering plastics, polyurethane systems,
Coatings 3,969 3,249 22
automotive coatings, surface treatment solutions and
concrete admixtures as well as construction systems like Performance Materials 7,706 6,888 12
tile adhesives and decorative paints. EBITDA 2,251 2,906 (23)
Income from operations (EBIT) 1,545 2,199 (30)
EBIT before special items 1,617 1,946 (17)
Agricultural Solutions
The Agricultural Solutions segment provides innovative Key data Agricultural Solutions (million €)
solutions in the areas of chemical and biological crop
protection, seed treatment and water management as 2017 2016 Change in %
well as for nutrient supply and plant stress. Sales 5,696 5,569 2
EBITDA 1,282 1,305 (2)
Income from operations (EBIT) 1,015 1,037 (2)
EBIT before special items 1,033 1,087 (5)
Oil & Gas
In the Oil & Gas segment, we focus on exploration and Key data Oil & Gas (million €)
production in oil and gas-rich regions in Europe, North
Africa, Russia, South America and the Middle East. 2017 2016 Change in %
Together with our Russian partner Gazprom, we are also Sales 3,244 2,768 17
active in the transportation of natural gas in Europe. EBITDA 2,069 1,596 30
Income from operations (EBIT) 1,043 499 109
EBIT before special items 793 517 53
Net income 719 362 99
1
On January 1, 2017, the Monomers and Dispersions & Pigments divisions’ activities for the electronics industry were merged into the global Electronic Materials business unit and allocated to the
Dispersions & Pigments division. For better comparability, the affected figures for 2016 have been adjusted accordingly.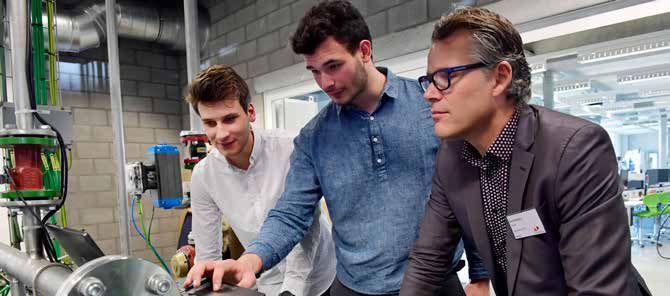
4   Index                                                                                              BASF in Antwerp Report 2017

    Index

    Welcome/Introduction	                                  5

    BASF Group at a glance                                 6

    BASF Group                                             8

    BASF in Antwerp                                       16

    BASF Antwerp - Overview                                18

    Safety, health and environment                         21

    Sustainability                                         26

    Employees and society                                  27

    More information                                       31

                                                                     Mobile devices make process operators' tasks more
                                                                     efficient.

    About this report
    The “BASF in Antwerp” Report is published annually as a concise document about the performance of our activities
    across the three dimensions of sustainability – economy, environment and society – in Antwerp. The reporting period for
    this publication is the financial year 2017. This report also carries an overview of BASF Group along with its financial
    performance, prepared in accordance with the requirements of the International Financial Reporting Standards (IFRS),
    and, where applicable, the German Commercial Code as well as the German Accounting Standards (GAS). The emis-
    sions, waste, energy and water use of consolidated joint operations are included pro rata, based on our stake. The
    employee numbers refer to employees within the BASF Group scope of consolidation as of December 31, 2017.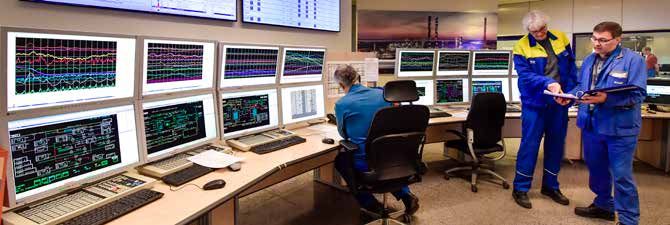
BASF in Antwerp Report 2017                                                                                                     Welcome    5

Welcome
Letter from the Executive Board

In 2017, we improved our safety performance in every way,           Our culture is inextricably linked with safety. Our facilities are of
saw our sales grow by almost 22%, welcomed 160 new re-              course protected and we lay down precise procedures in or-
cruits, implemented dual learning and focused on industry 4.0.      der to avoid incidents. It is our intention to commit to a safety
In other words, we achieved a great deal. The fact that we          culture in which everyone feels responsible for safety and
were able to achieve these results is entirely down to the cul-     takes initiative themselves. We encourage employees to take
ture on our site.                                                   their focus on safety home with them rather than leaving it
    First and foremost, we encourage a culture of continuous        behind at the factory gate, since safe behaviour is the number
improvement. Our facilities operated at 92% availability in         one priority on the road as well.
2017, a fine sample of operational excellence. In late 2017 we           Safe and smooth traffic was a major challenge in 2017.
ran the first production of the latest generation of superabsor-    Time to reflect structurally on mobility in the region. The result?
bent polymers. And we must keep looking ahead. As far as            A mobility plan resting on the pillars of bus transport, carpool-
digitalization is concerned, we have a team ready to proceed        ing and bike leasing.
from a pilot to implementation. What is more, we have invest-            Finally, we come to the most important ingredient in keep-
ed heavily in creating flexibility in the steamcracker supply       ing our facilities in prime condition year after year: our employ-
chain. We are continuing to look for major and minor improve-       ees, who make up a vibrant network of knowledge and expe-
ments in all four corners of the business.                          rience. This network comprises more than our own employees
    Continuous improvement and innovation go hand in hand           and trainees, partner companies and contractors contribute to
with sustainability. The interconnectedness of our facilities en-   it as well. We help all talent to get to the right place and have
ables us to maintain a balance between the heat requirements        close ties with education in order to generate enthusiasm
for various processes, a vast energy saving from the outset.        among youth for science and engineering. What is more, we
Over the past few years we have been looking for additional         are expanding our network by engaging in dialogue with our
energy savings in each facility. We are also extending this ap-     neighbours, the wider port community and other stakeholders.
proach from the energy field across to atmospheric emissions,       Policymakers are also part of this dialogue.
water management and waste, achieving success 		                         In this way, a culture of continuous improvement, sustain-
in doing so. In 2017, we were awarded the ISO 50001 certifi-        ability, safety and connectedness forms the basis of our well-
cate for energy management and renewed certificates for en-         oiled chemical manufacturing site. A site that keeps innovating.
vironmental protection and quality assurance.                       We thank everyone who contributed to this success, confident
                                                                    that in 2018 this will also be the key to perform well.

 Wouter De Geest                                                    Bernd Brian
 CEO BASF Antwerpen                                                 Member Management Committee
 since 2007                                                         In Antwerp since 2016
 Joined BASF in 1982                                                Joined BASF in 1984
6 BASF Group 2017 at a glance BASF in Antwerp Report 2017
BASF Group 2017 at a glance
Economic data
2017 2016 Change in %
Sales million € 64,475 57,550 12.0
Income from operations before depreciation and amortization (EBITDA)
and special items million € 12,527 10,327 21.3
EBITDA million € 12,724 10,526 20.9
Amortization and depreciation1 million € 4,202 4,251 (1.2)
Income from operations (EBIT) million € 8,522 6,275 35.8
Special items million € 194 (34) .
EBIT before special items million € 8,328 6,309 32.0
Financial result million € (722) (880) 18.0
Income before taxes and minority interests million € 7,800 5,395 44.6
Net income million € 6,078 4,056 49.9
EBIT after cost of capital million € 2,727 1,136 140.1
Earnings per share € 6.62 4.42 49.8
Adjusted earnings per share € 6.44 4.83 33.3
Dividend per share € 3.10 3.00 3.3
Research and development expenses million € 1,888 1,863 1.3
Personnel expenses million € 10,610 10,165 4.4
Number of employees 115,490 113,830 1.5
Assets million € 78,768 76,496 3.0
Investments2 million € 4,364 7,258 (39.9)
Equity ratio % 44.1 42.6 –
Return on assets % 10.8 8.2 –
Return on equity after tax % 18.9 13.3 –
Net debt million € 11,485 14,401 (20.2)
Cash provided by operating activities million € 8,785 7,717 13.8
Free cash flow million € 4,789 3,572 34.1
1
Amortization of intangible assets, depreciation of property, plant and equipment, impairments and reversals of impairments
2
Additions to intangible assets and property, plant and equipment (including acquisitions)
Value added 20173
4
Creation of value added (million €) Business
1
2017 2016 performance
Business performance 67,176 59,852 €67,176 million
1 Cost of raw materials and merchandise (29,224) (25,450)
2016:
2 Services purchased, energy costs and other expenses (14,520) (13,658)
3 Amortization and depreciation (4,202) (4,251) 3 €59,852 million
4 Value added 19,230 16,493
Use of value added 2
2017 2016 4.5
4.1 Employees 55.2% 61.6% 4.4
4.3
4.2 Government 8.9% 8.6% 4.2
4.3 Creditors 2.9% 4.0%
4.4 Minority interests 1.4% 1.2%
4.5 Shareholders (dividend and retention) 31.6% 24.6%
3
Value added results from the company’s performance minus goods and services purchased, depreciation and
amortization. Business performance includes sales revenues, other operating income, interest income and 4.1
net income from shareholdings. Value added shows the BASF Group’s contribution to both private and public
income as well as its distribution among all stakeholders.
BASF in Antwerp Report 2017                                                                                                                  BASF Group 2017 at a glance   7

Innovation

                                                                                                                                  2017        2016         Change in %
Research and development expenses                                                                      million €                 1,888        1,863                  1.3
Number of employees in research and development at year-end                                                                    10,110         9,966                  1.4

Employees and society

                                                                                                                                  2017        2016         Change in %
Employees
Employees at year-end                                                                                                         115,490       113,830                  1.5
Apprentices at year-end                                                                                                          3,103        3,120                 (0.5)
Personnel expenses                                                                                     million €               10,610        10,165                  4.4
Society
Donations and sponsorship                                                                              million €                  56.0         47.0                 19.1

Environment, health, safety and security

                                                                                                                                  2017        2016         Change in %
Safety, security and health
Transportation incidents with significant impact on the environment                                                                   0          0                     0
Process safety incidents                                                       per one million working hours                        2.0         2.0                    0
Lost-time injuries 4                                                           per one million working hours                        1.4         1.5                 (6.6)
Health Performance Index                                                                                                          0.97         0.96                  1.0
Environment
Primary energy use5                                                                                million MWh                    57.3         57.4                 (0.2)
Energy efficiency in production processes                                  kilograms of sales product/MWh                          625         617                   1.3
Total water withdrawal                                                                    million cubic meters                   1,816        1,649                 10.1
Withdrawal of drinking water                                                              million cubic meters                    20.3         20.7                 (1.9)
Emissions of organic substances to water6                                               thousand metric tons                      14.1         15.9                (11.3)
Emissions of nitrogen to water6                                                         thousand metric tons                        2.8         2.9                 (3.4)
Emissions of heavy metals to water6                                                                 metric tons                   24.8         23.2                  6.9
Emissions of greenhouse gases 4                                       million metric tons of CO2 equivalents                      22.6         22.0                  2.7
Emissions to air (air pollutants)6                                                      thousand metric tons                      25.7         26.0                 (1.2)
Waste                                                                                       million metric tons                   2.12         2.10                  1.0
Operating costs for environmental protection                                                          million €                 1,024        1,011                  1.3
Investments in environmental protection plants and facilities                                         million €                   234         206                   3.6
4
    The 2016 figure has been adjusted due to updated data.
5
    Primary energy used in BASF’s plants as well as in the plants of our energy suppliers to cover energy demand for production processes
6
    Excluding emissions from oil and gas production

Audits along the value chain

                                                                                                                                  2017        2016         Change in %
Suppliers
Number of on-site sustainability audits of raw material suppliers                                                                  120         104                  15.4
Responsible Care Management System
Number of environmental and safety audits                                                                                          109         121                  (9.9)
Number of short-notice audits                                                                                                        63         37                  70.2
Number of occupational medicine and health protection audits and health performance
control visits                                                                                                                       44         30                     –
8   BASF Group                                                                                                      BASF in Antwerp Report 2017

    BASF Group

    At BASF, we create chemistry for a sustainable future. We             where. This not only saves us raw materials and energy, it also
    combine economic success with environmental protection                avoids emissions, lowers logistics costs and leverages synergies.
    and social responsibility. The approximately 115,000 em-                  We also make use of the Verbund principle for more than
    ployees in the BASF Group work on contributing to the                 production, applying it for technologies, know-how, employ-
    success of our customers in nearly all sectors and almost             ees, customers and partners, as well. Expert knowledge is
    every country in the world. Our portfolio is arranged into five        pooled in our global research platforms.
    segments: Chemicals, Performance Products, Functional
    Materials & Solutions, Agricultural Solutions and Oil & Gas.          Procurement and sales markets

    Organization of the BASF Group                                        ▪▪ Around 130,000 customers; broad customer portfolio
                                                                          ▪▪ More than 70,000 suppliers
    ▪▪ Thirteen divisions grouped into five segments
    ▪▪ Regional divisions, functional units and corporate and             BASF supplies products and services to around 130,000
       research units support our business                                customers from various sectors in almost every country in the
                                                                          world. Our customer portfolio ranges from major global cus-
    Our 13 divisions are aggregated into five segments based on           tomers and medium-sized businesses to end consumers.
    their business models. The divisions bear operational respon-             We work with over 70,000 suppliers from different sectors
    sibility and are organized according to sectors or products.          worldwide. They supply us with important raw materials,
    They manage our 55 global and regional business units and             chemicals, investment goods and consumables, and perform
    develop strategies for the 86 strategic business units.               a range of services. Some of our most important raw materials
         Our regional units are responsible for optimizing local infra-   are naphtha, natural gas, methanol, ammonia and benzene.
    structure, and contribute to tapping our market potential. For
    financial reporting purposes, we organize the regional divisions      Business and competitive environment
    into four regions: Europe; North America; Asia Pacific; South
    America, Africa, Middle East.                                         BASF’s global presence means that it operates in the context
         Eight functional units and seven corporate units support         of local, regional and global developments and is bound by
    the BASF Group’s business activities. The functional and cor-         various conditions. These include:
    porate units provide services in areas such as finance, investor      ––Global economic environment
    relations, communications, human resources, engineering and           ––Legal and political requirements (such as European Union
    site management, as well as environmental protection, health            regulations)
    and safety. Our research and development organization has             ––Trade agreements like the North American Free Trade
    around 10,000 employees in global research units and safe-              Agreement (NAFTA)
    guards our innovative capacity and competitiveness.                   ––Environmental agreements (such as the E.U. Emissions
         Business processes are the shared responsibility of the            Trading System)
    divisions and the functional units. They closely coordinate the       ––Social aspects (such as the U.N. Universal Declaration of
    procurement of raw materials and services, production and               Human Rights)
    transport to customers.
                                                                          BASF holds one of the top three market positions in around
    Sites and Verbund                                                     75% of the business areas in which it is active. Our most im-
                                                                          portant global competitors include AkzoNobel, Clariant,
    ▪▪ Six Verbund sites with intelligent plant networking                Covestro, DowDuPont, DSM, Evonik, Formosa Plastics,
    ▪▪ 347 additional production sites worldwide                          Huntsman, SABIC, Sinopec, Solvay and many hundreds of
    ▪▪ Global Technology and Know-How Verbund                             local and regional competitors. We expect competitors from
                                                                          Asia and the Middle East in particular to gain increasing signif-
    BASF has companies in more than 80 countries. We operate              icance in the years ahead.
    six Verbund sites and 347 additional production sites world-
    wide. Our Verbund site in Ludwigshafen, Germany, is the               Corporate legal structure
    world’s largest integrated chemical complex owned by a single
    company. This was where the Verbund principle was originally          As the publicly traded parent company, BASF SE takes a
    developed and continuously optimized before being imple-              central position: Directly or indirectly, it holds the shares in the
    mented at additional sites.                                           companies belonging to the BASF Group, and is also the
         The Verbund system is one of BASF’s great strengths.             largest operating company. The majority of Group companies
    Here, we add value as one company by using our resources              cover a broad spectrum of our business. In the BASF Group
    efficiently. The Production Verbund intelligently links produc-       Consolidated Financial Statements, 286 companies including
    tion units and their energy supply so that, for example, the          BASF SE are fully consolidated. We consolidate eight joint
    waste heat of one plant provides energy to others. Further-           operations on a proportional basis, and account for 35 com-
    more, one facility’s by-products can serve as feedstock else-         panies using the equity method.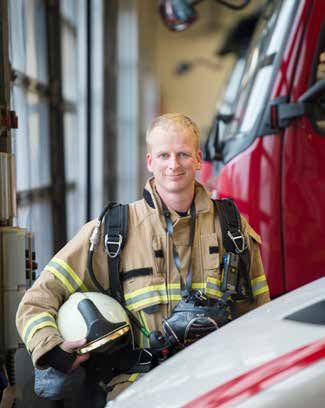
BASF in Antwerp Report 2017 BASF Group 9
Our Strategy
With the “We create chemistry” strategy, BASF has set itself We drive sustainable solutions. In the future, sustainability
ambitious goals. We want to contribute to a sustainable future will more than ever serve as a starting point for new business
and have embedded this into our corporate purpose: “We cre- opportunities. That is why sustainability and innovation are
ate chemistry for a sustainable future.” becoming significant drivers for our profitable growth.
In 2050, nearly 10 billion people will live on Earth. While the We form the best team. Committed and qualified employees
world’s population and its demands will keep growing, the around the world are the key to making our contribution to a
planet’s resources are finite. On the one hand, population sustainable future. Because we want to form the best team,
growth is associated with huge global challenges; and yet we we offer excellent working conditions and inclusive leadership
also see many opportunities, especially for the chemical based on mutual trust, respect and dedication to top perfor-
industry. mance.
Our corporate purpose Our values
▪▪ We create chemistry for a sustainable future Our conduct is critical for the successful implementation of our
strategy: This is what our values represent. They guide how
We want to contribute to a world that provides a viable future we interact with society, our partners and with each other.
with enhanced quality of life for everyone. We do so by creat-
ing chemistry for our customers and society and by making Creative: In order to find innovative and sustainable solutions,
the best use of available resources. we have the courage to pursue bold ideas. We link our areas
of expertise from many different fields and build partnerships
We live our corporate purpose by: to develop creative, value-adding solutions. We constantly
––Sourcing and producing responsibly improve our products, services and solutions.
––Acting as a fair and reliable partner
––Connecting creative minds to find the best solution Open: We value diversity – in people, opinions and experi
for market needs ences. That is why we foster dialog based on honesty, respect
and mutual trust.
For us, this is what successful business is all about.
Responsible: We act responsibly as an integral part of soci-
As an integrated global chemical company, we make import- ety. In doing so, we strictly adhere to our compliance stan-
ant contributions in the following three areas: dards. And in everything we do, we never compromise on
––Resources, environment and climate safety.
––Food and nutrition
––Quality of life Entrepreneurial: All employees contribute to BASF’s success
– as individuals and as a team. We turn market needs into
In doing so, we act in accordance with four strategic principles. customer solutions. We succeed in this because we take
ownership and embrace accountability for our work.
Our strategic principles
We add value as one company. Our Verbund concept is Our focus areas
unique in the industry. Encompassing the Production Verbund,
Technology Verbund and Know-How Verbund as well as all ▪▪ We set ourselves goals along the value chain for our
relevant customer industries worldwide, this sophisticated and focus areas
profitable system will continue to be expanded. This is how we
combine our strengths and add value as one company. Sustainability is key to the company’s long-term success and
as such, is embedded into our corporate strategy. We have
We innovate to make our customers more successful. We systematically formulated expectations for our conduct and
want to align our business optimally with our customers’ defined focus areas to meet the growing challenges along the
needs and contribute to their success with innovative and value chain:
sustainable solutions. Through close partnerships with cus- ––We source responsibly
tomers and research institutes, we link expertise in chemistry, ––We produce safely for people and the environment
biology, physics, materials science and engineering to jointly ––We produce efficiently
develop customized products, functional materials, and sys- ––We value people and treat them with respect
tem solutions as well as processes and technologies. ––We drive sustainable products and solutions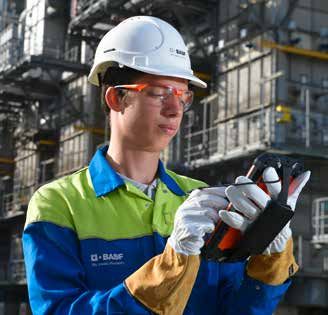
10 BASF Group BASF in Antwerp Report 2017
Goals
We carry out our corporate purpose, “We create chemistry for We are focusing on issues where we as a company can make
a sustainable future,” by pursuing ambitious goals along our a significant contribution.
entire value chain. In this way, we aim to achieve profitable
growth and take on social and environmental responsibility.
Goal areas along the value chain
Suppliers BASF Customers
Growth and profitability; Employees;
Procurement Production; Product stewardship; Products and solutions
Energy and climate protection; Water
Procurement
2020 Goal Status at end of 2017
Assessment of sustainability performance of relevant suppliers; 1 development of action plans where
improvement is necessary 70% 56%
1
Our suppliers are evaluated based on risk due to the size and scale of our supplier portfolio. We define relevant suppliers as those showing an elevated sustainability risk potential as
identified by our risk matrices and our purchasers’ assessments. We also use further sources of information to identify relevant suppliers such as evaluations from Together for Sustaina-
bility (TfS), a joint initiative of chemical companies for sustainable supply chains.
Growth and profitability
As determined in 2015, our aim for the years ahead is, on
Average
average, to grow sales slightly faster and EBITDA considerably
Change since change since
faster than global chemical production (excluding pharmaceu- 2017 2016 2015
ticals; 2017: 3.5%; average change since 2015: 3.5%), and to Sales €64.5 billion 12.0% 3.7%2
earn a significant premium on our cost of capital. Moreover, EBITDA €12.7 billion 20.9% 13.1%2
we strive for a high level of free cash flow each year, either Dividends per share
raising or at least maintaining the dividend at the prior-year paid out €3.00 €0.10
level.
Premium on cost of
capital €2.7 billion
Free cash flow €4.8 billion
2
Baseline 2015: excluding the gas trading and storage business transferred to Gazprom
Employees
2021 Goal Status at end of 2017
Proportion of women in leadership positions with disciplinary
responsibility 22–24% 20.5%
Long-term goals
International representation among senior executives 3 Increase in proportion of non-German senior executives
(baseline 2003: 30%) 38.9%
Senior executives with international experience Proportion of senior executives with international experience
over 80% 84.6%
Employee development Systematic, global employee development as shared responsibility Project implemented
of employees and leaders based on relevant processes and tools worldwide
3
The term “senior executives” refers to leadership levels 1 to 4, whereby level 1 denotes the Board of Executive Directors. In addition, individual employees can attain senior executive
status by virtue of special expertise.BASF in Antwerp Report 2017 BASF Group 11
Production
2025 Goals Status at end of 2017
Reduction of worldwide lost-time injury rate per one million working hours ≤0.5 1.4
Reduction of worldwide process safety incidents per one million working hours ≤0.5 2.0
Annual goal
Health Performance Index >0.9 0.97
Product stewardship
2020 Goal Status at end of 2017
Risk assessment of products that we sell in quantities of more than one metric ton per year worldwide >99% 76.2%
Energy and climate protection
2020 Goal Status at end of 2017
Coverage of our primary energy demand by introducing certified energy management systems
(ISO 50001) at all relevant sites4 90% 54.3%
Reduction of greenhouse gas emissions per metric ton of sales product (excluding Oil & Gas,
baseline 2002) (40%) (35.5%)
4
The selection of relevant sites is determined by the amount of primary energy used and local energy prices.
Water
2025 Goals Status at end of 2017
Introduction of sustainable water management at all production sites in water stress areas and at all
Verbund sites (excluding Oil & Gas) 100% 45.2%
Products and solutions
2020 Goal Status at end of 2017
Increase the proportion of sales generated by products that make a particular contribution to
sustainable development (Accelerator products) 28% 27.3%12 BASF Group BASF in Antwerp Report 2017
BASF in the regions
BASF Group sales 2017: €64,475 million;
EBIT 2017: €8,522 million
NORTH AMERICA
15,937
Sales1 (in million €)
1,236
EBIT1 (in million €)
18,295
Employees2
Florham Park
Geismar
SOUTH AMERICA, Freeport
AFRICA, MIDDLE
EAST
4,102
Sales1 (in million €)
335 São Paulo
EBIT1 (in million €)
7,286
Employees2
Regional centers
Selected sites
Verbund sites 1
In 2017, by location of company
Selected research and development sites 2
At year-end 2017BASF in Antwerp Report 2017 BASF Group 13
EUROPE
ASIA PACIFIC
30,778
Sales1 (in million €)
4,742
EBIT1 (in million €)
13,658
Sales1 (in million €)
71,653
Employees2
2,209
EBIT1 (in million €)
Antwerp
18,256
Employees2
Ludwigshafen
Nanjing
Hongkong
Kuantan14 BASF Group BASF in Antwerp Report 2017
BASF on the capital market
The BASF share price rose by 3.9% in 2017, trading at would have increased to €2,676 by the end of 2017. This
€91.74 at the year-end. We stand by our ambitious divi- represents an annual yield of 10.3%, placing BASF shares
dend policy and paid a dividend of €3.10 per share – an above the returns for the DAX 30 (4.8%), EURO STOXX 50
increase of 3.3% compared with the previous year. BASF (0.8%) and MSCI World Chemicals (6.8%) indexes.
enjoys solid financing and good credit ratings.
Long-term performance of BASF shares compared with indexes
(Average annual increase with dividends reinvested)
BASF share performance
2012 – 2017 8.9%
▪▪ BASF share gains 3.9% in 2017 11.1%
▪▪ Long-term performance continues to clearly exceed 8.8%
benchmark indexes 12.2%
2007 – 2017 10.3%
The BASF share closed the 2017 stock market year with a 4.8%
closing price of €91.74. This equates to a 3.9% rise in the 0.8%
value of BASF shares compared with the previous year’s clos- 6.8%
ing price, which also marked the high for 2016. Assuming that
dividends were reinvested, BASF shares gained 7.4% in value BASF share DAX 30 EURO STOXX 50 MSCI World Chemicals
in 2017. The benchmark indexes of the German and European
stock markets – the DAX 30 and the EURO STOXX 50 – rose
by 12.5% and 9.2% over the same period, respectively. The Weighting of BASF shares in important indexes
global industry index MSCI World Chemicals gained 23.6%. as of December
31, 2017
The BASF share reached a new high of €97.46 over the
DAX 30 8.1%
course of 2017. Viewed over a 10-year period, the long-term
EURO STOXX 50 3.5%
performance of BASF shares still clearly surpasses the Ger-
MSCI World Chemicals 8.6%
man, European and global benchmark indexes. The assets of
an investor who invested €1,000 in BASF shares at the end of
2007 and reinvested the dividends in additional BASF shares
Change in value of an investment in BASF shares in 2017
(With dividends reinvested; indexed)
130 130
120 120
110 110
100 100
90 90
Jan Feb Mar Apr May Jun Jul Aug Sep Oct Nov Dec
BASF share 7.4% DAX 30 12.5 % EURO STOXX 50 9.2 % MSCI World Chemicals 23.6 %BASF in Antwerp Report 2017 BASF Group 15
Dividend of €3.10 per share Broad base of international shareholders
For 2017, we paid a dividend of €3.10 per share.We stand by With over 500,000 shareholders, BASF is one of the largest
our ambitious dividend policy and paid out nearly €2.8 billion publicly owned companies with a high free float. An analysis of
to our shareholders. the shareholder structure carried out at the end of 2017
Based on the year-end share price for 2017, BASF shares showed that, at around 20% of share capital, the United
offer a high dividend yield of 3.4%. BASF is part of the DivDAX States and Canada made up the largest regional group of in-
share index, which contains the 15 companies with the high- stitutional investors. Institutional investors from Germany ac-
est dividend yield in the DAX 30. We aim to increase our divi- counted for around 11%. Shareholders from the United King-
dend each year, or at least maintain it at the previous year’s dom and Ireland hold 12% of BASF shares, while investors
level. from the rest of Europe hold a further 17% of capital. Approx-
imately 29% of the company’s share capital is held by private
investors, nearly all of whom reside in Germany. BASF is
Dividend per share (€ per share) therefore one of the DAX 30 companies with the largest per-
centage of private shareholders.
3.00 3.10
2.80 2.90
2.60 2.70
2.50
2.20 Shareholder structure (by region, rounded)
1.95 6
1.70 5
1 Germany 40%
2 United States and Canada 20%
4 1
3 United Kingdom and Ireland 12%
4 Rest of Europe 17%
5 Rest of world 5%
3
2008 2009 2010 2011 2012 2013 2014 2015 2016 2017 6 Not identified 6%
2
Employees becoming shareholders
In many countries, we offer share purchase programs that
turn our employees into BASF shareholders. In 2017, for
example, 23,700 employees (2016: approximately 24,000)
purchased employee shares worth €63 million (2016:
€59 million).16 BASF Group BASF in Antwerp Report 2017
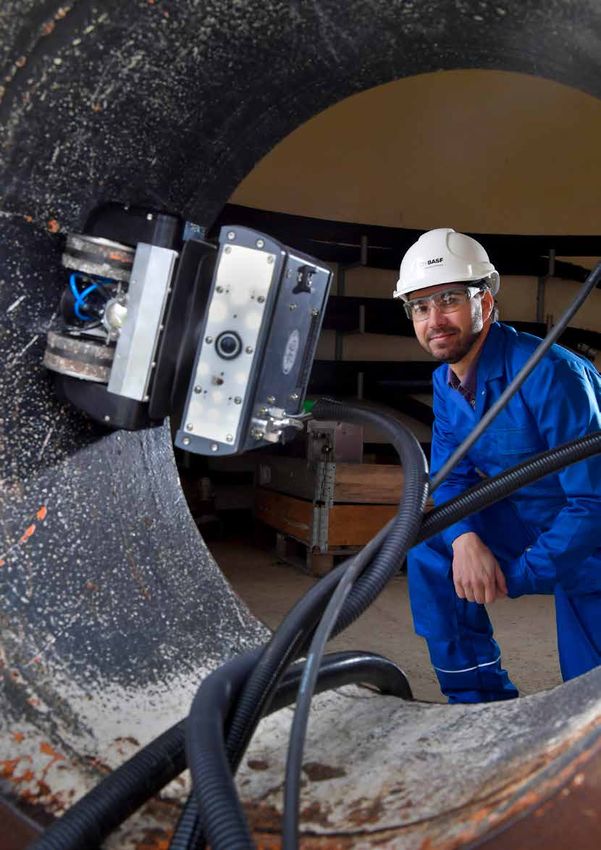
Robotics in Antwerp
Intelligent use of robotics technology can improve
the quality and safety of our maintenance and in-
spection activities. Innovations are studied and
pilots are started where appropriate.BASF in Antwerp Report 2017 BASF Antwerp 17
„
It is only by
engaging in
dialogue with our
employees and the
surrounding area
that we will be
able to continue
developing our
site sustainably.
“
Wouter De Geest
CEO
BASF Antwerp
„
Continuous
improvement is a
must for a
manufacturing site
like ours. We are
constantly looking
for methods to
work with ever-
increasing safety
and efficiency.
“
Bernd Brian
Member of the Management Committee
BASF Antwerp18 BASF Antwerp at a glance BASF in Antwerp Report 2017
BASF Antwerp
At a glance
BASF Antwerp plays a key role within the BASF Group and
in the Antwerp chemical cluster. Around 50 facilities divid-
ed into 16 clusters make chemical products day in, day
out, which are the basis for a great many everyday items.
Sales and investment
▪▪ Sales up by almost 22%
Turnover in Antwerp (million €)
2017 6,321
2016 5,183
BASF Antwerp sales rose in 2017 by almost 22% to €6,321 million.
The sharp increase in selling prices and increase in sales vol-
umes explain this growth.
Our products are being used in many industries, for example to make
On average, we invest €160 million per year. The most sporting goods using our polyurethane Infinergy®.
significant projects we can list include the ongoing optimisa-
tion of the steam cracker supply chain and the introduction of Taking one example as an illustration: our steam cracker
new technology for the manufacture of a new generation of ‘cracks’ naphtha into various products, including propylene
superabsorbent polymers. We have upgraded and extended and benzene. From benzene we make nitrobenzene, followed
our existing facilities for this new generation of polymers. This by aniline and then MDI. MDI is a primary product for polyure-
year, we also invested in the construction of a new ammonia thane, which you find virtually everywhere, from insulation to
tank. Furthermore, we are continuing to invest in projects to footwear and cars.
ensure the safety, efficiency and profitability of our site and its
facilities. Where are we located?
▪▪ Ideal location makes BASF Antwerp logistics hub
BASF Antwerp is located on a site covering around 600 ha in
the northern part of the port of Antwerp. Our location offers
many logistical advantages. The proximity of a large seaport
and direct access to the European road, inland waterway, rail
and pipeline network makes our location a logistical hub. We
make the most of this and take responsibility within the BASF
Group for logistics scheduling in the Benelux countries and
France.
Sales at BASF Antwerp rose by almost 22%
What do we make?
▪▪ BASF products found in a broad range of sectors
The BASF Antwerp product range comprises base and speci-
ality chemicals, synthetics and primary products, refining
products and inorganic chemicals. Our products are utilised in
virtually all processing sectors, such as the automotive indus-
try, the construction sector, paper and leather manufacturing,
sports equipment, as well as the textile, food and pharmaceu- BASF Antwerp takes advantage of an ideal location close to many
tical sectors. waterways, railroads and highways.BASF in Antwerp Report 2017 BASF Antwerp at a glance 19
In this plant, we make products our clients use to make yarn of industrial quality, sporting goods and nylon.
Innovation and 60 kilometer of roads on site. The Combinant multimodal
terminal handles 120 containers on average per working day.
▪▪ Aimed at our production processes Our location in the port of Antwerp is a perfect operating base
to supply the European market. And because we want to
Research, development and innovation at BASF Antwerp are avoid superfluous road traffic, we convey most of our products
aimed primarily at improving production processes. Opera- by ship, pipeline and rail.
tional excellence and high availability of our facilities are at the
core of our success. We are consistently committed to digita- Knowledge Verbund
lization and are working in a structured and cross-functional
manner on a number of key strategic areas such as big data, BASF Antwerp employs over 3,100 people. Together with
mobile applications and robotics. Furthermore, BASF Antwerp partner companies and contractors, on a daily basis there are
is keeping its finger on the pulse of new technological im- over 5,000 people working in close collaboration on our site.
provements in the field of energy efficiency. Feasibility studies All these people constitute a valued knowledge network, our
and pilot tests are being carried out where relevant. ‘Knowledge Verbund’.
Verbund: interweaving our facilities
Strategic partners
In production
Our Verbund is not restricted to our own production facilities.
The Verbund-principle is the foundation of our site. Far-reach- Over the past ten years, BASF has redeployed a number of its
ing integration is being implemented in our production: all pro- operations and we have entered into joint ventures. We also
duction steps, from raw material to final product, are close to- work closely with a number of partners for utilities.
gether. By-products from one process are used as the raw
materials for another process. Facilities are interconnected via Production Verbund Utilities and infrastructure
pipelines. Verbund
INEOS Styrolution Air Liquide
Energy
Styrene plastics Process gasses
A further useful benefit of our Verbund is energy integration. EuroChem Zandvliet Power (joint venture
Processes that release heat – known as exothermic – are Mineral fertilisers with BASF and Engie)
Combined heat and power
connected via a steam network to processes that absorb heat
station
– known as endothermic. This means that useful heat is re-
used optimally rather than wasted. Not only is this a financial Inovyn Combinant (Hupac, Hoyer
saving, it is also an advantage for the environment. Ethylene dichloride and BASF joint venture)
Multimodal rail terminal
Logistics Dow Chemical, Solvay Evides
and BASF joint venture Industrial water
We apply the Verbund philosophy to logistics, too. We have Hydrogen peroxide and
over 500 kilometer of pipelines, 44 kilometer of railway track propylen oxide20 BASF Antwerp at a glance BASF in Antwerp Report 2017
Digitalization
Industry 4.0 points to the current trend towards automa-
tion and connected systems in industry. Big data, cloud
computing and the internet of things are part of Industry
4.0. BASF Antwerp is investigating and implementing a
great many innovative technologies and intends to give
employees the opportunity to derive maximum benefit
from this wave of digitalization.
Getting everything from data
▪▪ Big data everywhere
Data is the cornerstone of digitalization. We are working on it
with a targeted approach where we see clear added value. We
check first whether data is available and of good quality, then
we analyse the data to draw any possible conclusions and
then we try to predict how it will look in the future. For exam-
ple, we are able to monitor the condition of an equipment with
great precision based on measurement data from certain
equiments combined with process data, even remotely. What Already now, process operators mostly use a smartphone for their in-
is more, we are implementing tools to enable employees with spection rounds. Soon, they will be able to do a lot more.
no experience of statistical modelling to work with data on
their own. tionally, we have improved our 4G and wireless infrastructure
Furthermore, we are also committing to data analytics be- and provided many equipments with QR codes. This, for in-
yond the site boundaries. We support the NxtPort data plat- stance, enables employees on their rounds to bring up a trend,
form within the port of Antwerp area. This data platform is in- view manuals on video and document irregularities. The next
tended to collect and process the large amount of data within steps will of course be to extend smartphone functionalities, in-
the logistics chain, such that the right players have the infor- cluding providing smart technical drawings and access to vari-
mation available at the right time. NxtPort will make logistics in ous databases and software systems.
the port smarter.
Robotics
Mobile devices
▪▪ Using robots for maintenance
▪▪ Inspection rounds
A major part of automation is the deployment of smart robots:
By the end of 2017, employees in 80% of our facilities were in piping, in the atmosphere and in our tanks. They can com-
working with a smartphone for inspection rounds. These plete complex tasks efficiently. An example that comes to
smartphones are virtually the same as the one in in everyone's mind is a drone capable of inspecting a flare head from above.
pocket, except that they are made in such a way that they Or a robot that checks the inside of a tank. BASF is investigat-
comply with our stringent safety regulations. ing robotics capabilities especially in the maintenance field,
These smartphones are equipped with a specialised app with a focus on non-invasive inspection methods. In 2017, we
that synchronises with the computers in the control room. Addi- demonstrated a diverse range of robot types to over 300 em-
ployees and visitors. This enabled each one of them to discov-
er for their own specialist area what robotics technology has in
store for them.
Because we believe it is important to test innovations relat-
ing to maintenance, including robotics, in practice at an early
stage, we are part of the ‘Smart Tooling’ cross-border project,
together with other players such as Ghent University and Dow
Chemical. BASF Antwerp will function as a test location.
John Baekelmans of Imec gave a talk about the advantages of
digitalization.BASF in Antwerp Report 2017 Safety, health and environment 21
Safety, health and environment
Safety
Prevention
▪▪ Safety culture
Our safety policy rests on five pillars: process safety, leader-
ship in safety, contractor safety, thorough risk and incident
analysis and focus on preventive action. We renew our com-
mitment to these five fundamental principles every year.
In addition to technical measures and procedures, behavi-
our, culture and ownership are the necessary ingredients to
keep our site safe. That is why we worked on ownership inten-
sively in 2017. We organised workshops in virtually all teams
and shifts, in which we encouraged employees to take action
themselves, with success. Since the workshops started, our
employees have registered and developed over 500 initiatives
on safety. Ownership also means tackling others – colleagues
and contractors – if you notice an unsafe situation.
We extend our safety culture to contractors and partners
as well. For example, we conduct audits for the allocation of
contracts, providing assistance at the start of works and invol-
ving them in our safety campaigns.
Process safety remains a major pillar of our safety policy.
We must avoid any product escapes. Production facilities pool
their knowledge and learn from one another to do better and
better in terms of process safety.
Our team is always ready to intervene, inside and outside of our site.
Safety is the top priority within the BASF Group, including Emergency response
the BASF manufacturing site in Antwerp. Avoiding inci-
dents is at the forefront, nevertheless our emergency ▪▪ On and off site
response service is always at the ready. The figures prove
that our focus on safety is bearing fruit. We can count on a thoroughly trained emergency response
service if, in spite of everything, something does go wrong. 60
The figures firefighters and 17 emergency response vehicles are at the
ready 24/7. In addition, we have specialised equipment availa-
▪▪ Few accidents in 2017 ble, such as a TurboJet that can extinguish fires from a great
distance, and a mobile flare.
Besides, BASF Antwerp also deploys its emergency res-
Frequency rate (workplace accidents with time off work/million hours worked)
ponse service in the public interest. We are part of the Belintra
2017 0.9 agreement with the Belgian state. Our emergency response
2016 2.7 service can thus be deployed in the event of accidents with
chemical substances in which we are not directly involved. We
In 2017, the number of workplace accidents with time off work were called to action 10 times in 2017. BASF Antwerp even
per million hours worked declined from 2.7 the year before to operates as a national coordination centre for Dutch-language
0.9. In absolute figures it boiled down to 4 accidents with time callouts under Belintra.
off work. The frequency rate for contractors also declined in
2017. Their frequency rate was 1.3 in 2017, a good deal less
than 2.5 the year before. What is more, the severity of the ac-
cidents has also declined, for both employees and contrac-
tors.
2017 was also positive in terms of commuting to and from
work, despite the complex traffic situation and the increase in
the number of e-bikes on the go.22 Safety, health and environment BASF in Antwerp Report 2017
Health
Promoting and maintaining our employees’ health is 753 employees completed the questionnaire. 75 employees
something we are in favour of. Our medical department took part in smoking cessation counseling. Once it was over,
transposes BASF Group directives into practical meas- 80% of the participants had stopped smoking. We organized
ures tailored to the various target groups on our site. workshops on breathing techniques and air quality jointly with
the emergency response service and the environment depart-
ment.
Trained team always at the ready
Our medical team is always alert. You can go to the physicans
and nurses at any time for advice or first aid. In addition, we
have well-equipped ambulances available and an emergency
service vehicle able to render assistance on the move as well.
We monitor and limit exposure to chemical substances, noise,
vibration and extreme temperatures as much as possible.
Medical department staff undergo regular training in order to
keep their knowledge up to date. In addition, they also provide
training themselves on health topics such as hearing protec-
Healthy food is an important pillar of health promotion, we always tion.
provide healthy options.
Health and ergonomics
The BASF Group
Members of the B-Fit@BASF workgroup promote healthy nutri-
▪▪ Global policy, local interpretation tion, exercise and balance. They do this in a fun, ongoing and
low-threshold manner. In this way we organize exercise ses-
The BASF Group lays down global standards in order to guar- sions such as yoga and tai chi, as well as providing workshops
antee the health of its employees and translates these into a on stress and sleep patterns. What is more, we provide a
directive. A global network of experts transposes this directive healthy offer in the canteen and have fruit available at the work-
into practice within the constraints of the local legal frame- place.
work. The aim is to promote and maintain employees' health In 2017, our ergonomics specialists gave personalized ad-
and productivity worldwide. This policy was given added im- vice 216 times on a healthy workplace and a healthy work
petus by many emergency exercises and health promotion posture. They organize training sessions and monitor the ergo-
measures. In 2017, the Global Health Campaign of the BASF nomic layout of the workplace.
Group focused on respiratory health and healthy lungs.
BASF makes employees aware of health topics with a
target-group-oriented approach. Health promotion is based
on preventive health checks. Employees are given the oppor-
tunity on a regular basis to take part in these check-ups.
The BASF Group measures health-related performance
based on the Health Performance Index (HPI). This HPI con-
sists of five components: recognized occupational diseases,
medical emergency preparedness, first aid,
preventive medicine and health promotion. The aim is to
achieve a score above 0.9 every year. Accordingly, with an HPI
of 0.97, the BASF Group again achieved its target.
BASF Group Health Performance Index
2017 0.97
2016 0.96
Respiratory health in Antwerp
We took part in the BASF Global Health Campaign. Our em-
ployees were provided with a self-assessment questionnaire
to identify their individual risk of respiratory and lung diseases. Chair yoga is offered during movement sessions at lunchtime.BASF in Antwerp Report 2017 Safety, health and environment 23
Environment
We can post good figures for air, water as well as waste in Water
2017. What is more, our efforts were rewarded with the ISO
standard for energy efficiency and reconfirmation of the ▪▪ We are frugal with water
ISO standards for environmental protection and quality ▪▪ The right water for the right use
assurance. Total water intake (million m3)
2017 250
Emissions to air 2016 188
▪▪ Emissions dropped by 49% last 10 years
▪▪ Relative environmental impact was down by 33% Water intake by source – surface water (in %)
2017 99.5
Atmospheric emissions (in tons)*
2016 99.4
2017 2,341
2016 2,486
*CO, NOX, NMVOS, SOX, stof, andere anorganische stoffen Water intake by source – drinking water (in %)
2017 0.52
Greenhouse gases (in tons of CO2 equivalents)
2016 0.61
2017 3,755,399
2016 3,407,858
Production water usage (million m3)
We can report lower atmospheric emissions in 2017 compared to 2017 11
2016. Various process optimisations, including on the cyclohex- 2016 10
anone and acrylic acid facilities, are at the root of this drop.
As regards greenhouse gases, we note a slight rise of from
Cooling water usage (million m3)
3.4 to 3.8 million tonnes of CO2 equivalents. This rise is due to
2017 700
the fact that our ammonia facility was operational for a full year
2016 648
in 2017. This facility was at a standstill for a while in 2016 on
account of a maintenance shutdown.
Long term, we are performing excellently in terms of the Using water frugally and using the right water for each applica-
environment, for air, water as well as waste. Our atmospheric tion is at the core of our water policy. We use water from the
emissions have been cut by 49% over the past ten years, docks to cool our processes and surface water from the ‘De
while our production output rose. Relative environmental im- Biesbosch’ freshwater tidal area in the Netherlands for our pro-
pact, i.e. atmospheric and water emissions and landfill waste duction processes. We use a small amount of drinking water for
per ton of manufactured product, has been cut by 33% over sanitation purposes.
the past ten years.
When we took our water treatment plant in use in 1980, we were one of the first companies in the area to biologically treat waste water.24 Safety, health and environment BASF in Antwerp Report 2017
will be discharged as wastewater. This wastewater does not
leave the site until it has been treated. BASF has a central bio-
logical treatment plant where the biodegradable substances
are removed. Our water treatment basins boast a total capaci-
ty of 44 million litres and are capable of treating wastewater for
a population of 460,000. We also treat water from partner
companies on site. BASF Antwerp was one of the first compa-
nies in the port area to start treating waste water biologically.
Our water treatment plant achieves high removal efficiency.
Over the past ten years we have succeeded in bringing down
our water emissions by 42%. We brought this about not only
by closely monitoring the operation of our water treatment
plant but also by improving the residual water quality in our
production facilities before the water goes for treatment.
Waste
▪▪ Total volume of waste declined
▪▪ Re-utilisation at a record high
We cover 90% of our thermal needs by a smart steam network,
balancing exothermic and endothermic chemical processes. Total volume of waste (in tons)
2017 48,975
In 2017, our water intake rose from 188 to 250 million m3, 2016 52,405
which can be explained by malfunctions in the cooling water
circuit which hampered recirculation. Our cooling water usage
Waste treatment (2017) 2 34
was also higher in 2017 on account of higher temperatures. We
1 Utilisation 91.3%
re-use our cooling water as much as possible and strive to make
2 Incineration 5.1%
optimum use of our cooling water circuit. In 2017, we used 1
3 Other methods 2.5%*
cooling water around three times.
4 Landfill 1.1%
We continue looking for sustainable ways of managing wa-
*mainly biological cleaning
ter. That is why, together with a number of other companies,
government agencies and knowledge institutions, we are taking
part in the IMPROVED Interreg project, a cross-border research BASF Antwerp opts for the best treatment process for each
project to treat different types of water in such a way that we can type of waste. It is our intention here to avoid waste in the first
utilise it optimally in our production processes. place. If this is not an option, we go for re-utilisation. We then
look for solutions which consist of recycling the material, other-
Water emissions wise it is incinerated and energy is recovered from it. Finally, we
opt for incineration as the method of disposal and landfill only
▪▪ Water emissions declined by 42% over the past 10 years as the last resort. We are constantly seeking better treatment
Water emissions, organic substances methods. Our Verbund plays an important role in this: we are
(in tonnes of COD – chemical oxygen demand) constantly seeking and finding in-house solutions for our pro-
2017 827 duct and by-product flows so they can be utilised to the maxi-
2016 1,122 mum extent in another facility.
We made great strides in 2017. The total volume of waste
went down because we generated less of it through sophisti-
Water emissions, nitrogen (in tons)
cated operational management. As a result of energy recovery
2017 136
from a major waste stream, the share of waste that was useful-
2016 121
ly utilized rose from almost 78% in 2016 to 91% in 2017.
Water emissions, heavy metals (in tons)
2017 1.31
2016 1.33
The water in our production facilities is reused as often as
possible. However, once it actually becomes contaminated, itBASF in Antwerp Report 2017 Safety, health and environment 25
Energy
▪▪ Less fuel for boilers
Electricity consumption (MWh)
2017 1,667,770
2016 1,665,309
Steam consumption (in tons)
2017 5,861,934
2016 5,888,268 We monitor our emissions closely and search for solutions to reduce
them even lower.
Fuels for energy, boilers (MWh)
Our steam and electricity consumption remained stable com-
2017 896,057
pared to 2016. The amount of fuel for the boilers declined
2016 1,076,557
because of a drop in demand for steam by external partners.
As a rule, we use up our steam surpluses from production and
We recover surplus energy from one facility and feed it into only then do we draw it from our boilers.
others. A smart steam network keeps heat surpluses and
shortages in balance. We meet 90% of our heat requirement in Licence to operate
this way. If we need extra steam, then it will come from sources
including our steam boilers and Zandvliet Power, the combin- ▪▪ ISO certificate for energy efficiency
ed heat and power station on site (a joint venture with Engie, ▪▪ Completing renewal of environmental permits
an energy supplier). We have various generators at our dispo-
sal which convert any surpluses of steam into electricity. BASF Antwerp applies considerable effort to energy efficiency.
Electric power is also supplied by the 6 wind turbines on site, Over the past two years we saved a great deal of energy by all
which are capable of generating 12 MW. manner of minor and major improvements, such as an additi-
onal heat exchanger in our ethylene oxide facility. Our efforts
were rewarded by obtaining ISO 50001 certification. In doing
so we have fulfilled a group objective and are demonstrating
that energy efficiency is anchored structurally in our organisa-
tion.
What is more, we are taking part in the Flanders Energy Policy
Agreement (EBO in Dutch) for the 2015-2020 period. The EBO
also requires us to embed energy efficiency and lay down
measures in an energy plan. The results of the first EBO period
were positive throughout Flanders, which is why an extension
was announced until 2022. BASF Antwerp is also going along
with this extension.
We constantly monitor our facilities in terms of the environ-
ment and follow technological developments with a positive
impact meticulously. We take care to ensure that we are fully
compliant with all legislation and procedures. This is being re-
ceived favourably. Once again, we achieved standards ISO
9001 for quality assurance and ISO 14001 for environmental
protection.
Furthermore, we completed a relicensing round for facili-
ties including the following: MDI, polyetherols, amines, water
treatment plant, aniline/nitrobenzene, workshops, cooling
water, central lab and our tank farm. We examined each facili-
ty in all its technical details and meticulously checked all data
in the licensing file. Moreover, over the past year we have taken
on a great deal of work to prepare ourselves for the merging of
the environmental and building permits into a single environ-
A focus on energy efficiency and a correct management system were mental permit.
recognized by achieving ISO 50001 certification.You can also read