Basic Needs Security Among Washington College Students - Washington Student Experience Survey: Findings Report
←
→
Page content transcription
If your browser does not render page correctly, please read the page content below
Basic Needs Security Among Washington College Students
  Washington Student Experience Survey: Findings Report
                      January 2023
Washington Student Experience Survey: Findings Report
Contents:
Executive Summary 1
Project Overview 2
Survey Development
Survey Administration
Measuring Insecurity
Participant Information 4
Participating Institutions
Population Demographics
Respondent Characteristics
Survey Findings
Basic Needs Insecurity Rates 6
Overall Rates
Rates by Sector and Region
Rates by Student Demographics
Other Basic Needs 11
Childcare Access
Healthcare Access
Technology Access
Resource Utilization 15
Conclusion 17
Appendix A: Full Survey Instrument 18
Appendix B: Aggregate and Disaggregated Response Counts 25
Basic Needs Items
Demographic Items
About:
The administration of the Washington Student Experience Survey and the development of this report were
completed by staff at Western Washington University on behalf of the Washington Student Achievement
Council. Questions about the survey or this report can be directed to amim@wsac.wa.gov.
Lead Researcher, Lead Report Writer: Matt Bryant, Western Washington University
Project Manager, Supporting Report Writer: Ami Magisos, Washington Student Achievement Council
Suggested citation: Washington Student Achievement Council. (2023) Basic Needs Security Among
Washington College Students. https://wsac.wa.gov/sites/default/files/2023.BasicNeedsReportBasic Needs Security Among Washington College Students
Washington Student Experience Survey: Executive Summary
In Fall 2022, students at 39 colleges and universities across Washington State participated in a survey
administered by Western Washington University in partnership with the Washington Student
Achievement Council.
Over 9,700 students responded to the survey, with broad representation: 45.3% students of color, 39.5%
low-income students, and 51.8% first-generation students. Responding students shared their experience.
Nearly half of students (49.4%) experienced basic needs insecurity
Students at two-year and four-year colleges Washington students struggled with food and
had similar insecurity rates, with 1 in 2 housing insecurity at high rates:
experiencing food and/or housing insecurity. • 4 out of 10 students (38.3%)
2-year colleges 4-year colleges experienced food insecurity in the last 30
days
• 3 out of 10 students (34.2%)
experienced housing insecurity in the last
Secure Insecure Secure Insecure 12 months
49.9% 50.1% 51.2% 48.8%
• 1 out of 10 students (11.3%)
experienced homelessness the last
12 months
Students experienced high rates of basic Some students experienced basic needs
needs insecurity in all regions of the state. insecurity at higher rates than their peers:
• American Indian/Alaska Native and
Black/African American students
experienced significantly higher rates of
insecurity than White students.
South Central 57.9% Southeast 48.8%
South Puget Sound 54.1% Southwest 48.0%
Northeast 53.8% North Central 47.9%
Northwest 50.1% North Puget Sound 45.0%
Peninsula/Coastal 48.8%
Less than half of students experiencing • Former foster youth had the highest rates
insecurity accessed basic needs support of basic needs insecurity among all
resources in the last 6 months: subpopulations:
• 48.9% accessed public resources - 67.5% experienced food insecurity
• 33.77% accessed campus resources - 58.9% experienced housing insecurity
- 23.7% experienced homelessnessWashington Student Experience Survey: Project Overview
Survey Development
Why basic needs data? Sufficient food, safe and adequate housing, access to childcare and
healthcare, and other basic needs are foundational for postsecondary students’ stability, as well
as success in their educational goals – yet unmet basic needs represent an increasing barrier to
students’ success and Washington’s state goal of 70% postsecondary attainment. Recent research
from The Hope Center at Temple University 1 shows that basic needs barriers are exacerbated by
our current economic and public health crises and are impacting a growing population of
students, particularly students of color and students with low incomes.
Washington has made some strides in recent years toward increasing awareness and state support
of students’ basic needs but has lacked state and regional information to drive larger-scale
policies, programs, and investments to address the attainment barriers associated with basic
needs insecurity. State and regional data on unmet basic needs can help Washington more
effectively tackle basic needs barriers to postsecondary attainment by:
• Increasing awareness of the true scale of basic needs insecurity, particularly in communities
and education sectors where it may be “invisible” or counter to popular perception.
• Pointing to disparate impacts in particular student populations through the lenses of
student status, race/ethnicity, veteran, or employment status, etc.
• Serving as an advocacy tool for data-driven solutions on campus, regional, and state levels.
To address this information gap, in 2021 a statewide Basic Needs Data Work Group 2 proposed a
coordinated basic needs survey across Washington higher education institutions. Facilitated by
Washington Student Achievement Council, and with representatives from multiple community/
technical colleges and baccalaureate institutions from across the state, the work group built
consensus that critical basic needs data can drive change in institutions, regions, and the state.
Building on existing campus assessment efforts and national best practices, the Basic Needs Data
Work Group spent over a year creating and piloting a data collection instrument and developing a
plan for statewide implementation. The instrument, known as the Washington Student Experience
Survey (WSES), was informed by The Hope Center #RealCollege survey and was designed to serve
as a common survey for use across Washington state. The work group agreed on a limited set of
questions focused on food security, housing security and homelessness, childcare access,
healthcare access, technology access, and use of public and campus basic needs support
resources. Additionally, demographics questions were included to be able to understand the
prevalence of basic needs insecurity across different student populations, to better understand
disparate impacts on specific student populations, and to see trends in basic needs insecurity
over time. (See Appendix A for the full WSES instrument.)
1
The Hope Center Survey 2021:
https://hope.temple.edu/sites/hope/files/media/document/HopeSurveyReport2021.pdf
2
For more information about the Basic Needs Data Work Group:
https://drive.google.com/file/d/1o7Pvm_rXAPxEb1sTUGHqaqvejq9LulY4/
2Survey Administration
WSAC partnered with Western Washington University (WWU) to serve as Lead Partner Institution for
administration, analysis, and reporting for the WSES. In addition to WWU, 38 colleges and
universities across the state agreed to serve as participating institutions in the WSES (see
Participating Institutions, page 4). WWU received IRB approval for administering the survey,
analyzing the data, and reporting on the findings.
WWU administered the WSES instrument using the Qualtrics survey platform. The instrument was
open for responses from 09/09/2022 until 11/30/2022. The survey was distributed via email using
anonymous weblinks to current students enrolled in credit-bearing courses at the 39 participating
institutions, including WWU (for more information see Participant Information, pages 4-5).
Measuring Insecurity
Food security: Food security was assessed using the items from the 6-item Household Food
Security Survey Module from the U.S. Department of Agriculture (USDA) 3. These items assess access
to food, quality of food available, and frequency of experiencing hunger (Appendix A, items 1-6).
Food security for each respondent is assessed based on affirmative responses to these items: 0
affirmative responses indicate “high” food security, 1 affirmative response indicates “marginal”
food security, 2-4 affirmative responses indicate “low” food security, and 5-6 affirmative responses
indicate “very low” food security. Those with “low” and “very low” food security are considered to
be “food insecure” (as per USDA guidance for the module). This rate has been calculated for
respondents who answered all food insecurity items.
Housing security: Housing security was assessed using a modified item recommended by The Hope
Center, which was adapted from the national Survey of Income and Program Participation (SIPP)
Adult Well-Being Module 4. This item assesses access and ability to pay for safe and reliable
housing (Appendix A, item 8). Respondents who provided an affirmative response to parts 1-8 of
this item are considered to be “housing insecure” (as per Hope Center guidance). This rate has
been calculated for respondents who answered both housing items.
Homelessness: Homelessness was assessed using a modified item recommended by The Hope
Center, which was developed based on the definition of homelessness in the McKinney Vento
Homeless Assistance Act4. This item assesses where an individual has slept due to loss of housing,
economic hardship, or similar reasons (Appendix A, item 9). Respondents who provided an
affirmative response to parts 1-9 of this item are considered to be “homeless” (as per Hope Center
guidance). This rate has been calculated for respondents who answered both housing items.
Other basic needs: Other areas of basic needs were assessed using items developed by the Basic
Needs Data Work Group (see Appendix A for all items), including childcare access (item 22),
healthcare access (items 10 and 11), and technology access (items 12 and 13).
3
For more information about the USDA module: https://www.ers.usda.gov/media/8282/short2012.pdf
4
Guide to Assessing Basic Needs Insecurity in Higher Education:
https://drive.google.com/file/d/1Zqm4P_tPEUtKlGcZAGIlgHJj29kuNoOv/
3Washington Student Experience Survey: Participant Information
Participating Institutions
39 colleges and universities from across Washington state participated in the WSES, including all
public baccalaureate institutions, the majority of community/technical colleges, and one
independent institution. Participating institutions included:
Bellevue College Shoreline Community College
Bellingham Technical College South Puget Sound Community College
Big Bend Community College South Seattle College
Cascadia College Spokane Community College
Central Washington University Spokane Falls Community College
Columbia Basin College Tacoma Community College
Eastern Washington University The Evergreen State College
Everett Community College University of Washington - Bothell
Grays Harbor College University of Washington - Seattle
Green River College University of Washington - Tacoma
Highline College Walla Walla Community College
Lake Washington Institute of Technology Washington State University - Everett
Lower Columbia College Washington State University - Global
North Seattle College Washington State University - Pullman
Olympic College Washington State University - Spokane
Peninsula College Washington State University - Tri-Cities
Pierce College Washington State University - Vancouver
Renton Technical College Western Washington University
Seattle Central College Whatcom Community College
Seattle University
Population Demographics
Institutions solicited participation from all students enrolled in credit-bearing courses during Fall
2022 5. In total, 246,409 students received an invitation to participate, including 121,474 students at
two-year institutions and 124,935 students at four-year institutions. This group of students
represents the population for this study. The demographic categories rates for this population are
presented in Table 1 below (which excludes unknown categories).
Table 1. Population Rates by Demographic Category
Two or more races/
African American/
Hispanic or Latinx
American Indian/
Pacific Islander/
Native Hawaiian
First-generation
Other Gender
Alaska Native
Pell-eligible/
low-income
CATEGORY
ethnicities
Part-time
Full-time
Female
White
Asian
Black
Male
RATE 69.3% 29.8% 55.5% 41.4% 3.1% 5.3% 0.8% 13.7% 11.6% 0.5% 45.4% 11.1% 30.8% 20.3%
5
Excluding currently incarcerated students who were excluded from the IRB approval for this study.
4Respondent Characteristics
In total, 9,771 students provided valid responses to the survey. This included 4,855 students at two-
year institutions and 4,916 students at four-year institutions. This group of respondents represents
the sample for this study. The demographic category rates for this sample are presented in Table 2
below (which excludes unknown categories).
Table 2. Sample Rates by Demographic Category
Two or more races/
African American/
Hispanic or Latinx
American Indian/
Pacific Islander/
Native Hawaiian
First-generation
Other Gender
Alaska Native
Pell-eligible/
low-income
CATEGORY
ethnicities
Part-time
Full-time
Female
White
Asian
Black
Male
RATE 76.0% 23.9% 63.2% 29.7% 5.8% 5.7% 1.3% 11.8% 10.3% 0.8% 54.7% 9.0% 51.8% 39.5%
With 9,771 of 246,409 students responding to the survey, this provided an overall response rate of
3.97%. While seemingly low, this response rate is not atypical of this type of an opt-in survey
administered without incentives. 6 The opt-in survey style was selected by the Basic Needs Data
Work Group in order to maximize the total number of responses and to ensure all current students
had an opportunity to respond. While an opt-in survey does not allow for calculating a margin of
error 7 for generalizing findings to the overall population, with such a large survey population, even
a low response rate yields a robust sample. Additionally, efforts were made to minimize self-
selection bias, including avoiding references to basic needs in the survey title and solicitation,
avoiding the use of incentives, and ensuring consistent administration procedures. It is also worth
noting that the rates of basic needs insecurity identified among WSES respondents are consistent
with the most recent report from The Hope Center (the leading source for national higher
education basic needs data), providing evidence for the accuracy of WSES findings (this is
discussed further in the conclusion of this report). Nevertheless, readers are encouraged to use
discretion in generalizing WSES findings, noting the differences in the composition of the sample
relative to the overall population (as detailed in Tables 1 and 2 above).
6
Incentives were not provided for this survey for consistency of administration across institutions and to avoid
potential response bias. The Hope Center notes, “Without providing incentives to students, such as a gift card, you
should anticipate low response rates, from 5% to 10%.” Guide to Assessing Basic Needs Insecurity in Higher Education,
page 6: https://drive.google.com/file/d/1Zqm4P_tPEUtKlGcZAGIlgHJj29kuNoOv/
7
Margin of error is a measure specific to probability sampling; opt-in surveying use non-probability sampling.
5Washington Student Experience Survey: Survey Findings
Basic Needs Insecurity Rates
Using the measures for food security, housing security, and homelessness described in the Project
Overview section, the responses to the Washington Student Experience Survey (WSES) were
analyzed to determine rates for basic needs insecurity. Rates for the overall population are
highlighted below, followed by rates by sector and region, and rates by student population. These
rates are presented in detail in Tables 3 and 4 on Page 10.
Rates Overall
Across the state, students responding to the WSES reported significant levels of basic needs
insecurity:
• One in every two students experienced basic needs insecurity. Overall, 49.4% of respondents
experienced either food insecurity or housing insecurity.
• One in every three students experienced food insecurity. Overall, 38.3% of respondents
experienced food insecurity in the last 30 days.
• One in every three students experienced housing insecurity. Overall, 34.2% of respondents
experienced housing insecurity in the last 12 months.
• One in every four students experienced both food insecurity and housing insecurity. Overall,
23.5% of respondents experienced both food insecurity and housing insecurity.
• One in every ten students experienced homelessness. Overall, 11.3% of respondents
experienced homelessness in the last 12 months.
Figure 1. Basic Needs Insecurity Rates (Overall)
60%
49.4%
50%
38.3%
40% 34.2%
30%
23.5%
20%
11.3%
10%
0%
Either Insecurity Food Insecurity Housing Insecurity Both Insecurities Homelessness
6Rates by Sector and Region
Basic needs insecurity rates reported by WSES respondents were similar in both two-year and
four-year institutions and in all regions across the state 8.
• Students at two-year and four-year colleges experienced similar basic needs insecurity
rates. Overall, 50.1% of respondents at two-year colleges and 48.8% of respondents at four-
year colleges experienced either food insecurity or housing insecurity.
Figure 2. Basic Needs Insecurity Rates by Sector
Students at 2-year colleges: Students at 4-year colleges:
Secure Insecure Secure Insecure
49.9% 50.1% 51.2% 48.8%
• Rates of food insecurity were comparable for students at two-year and four-year colleges.
Overall, 39.1% of respondents at two-year colleges and 37.6% of respondents at four-year
colleges experienced food insecurity.
• Students at two-year colleges experienced housing insecurity and homelessness at greater
rates than students at four-year colleges. Overall, 37.6% of respondents at two-year colleges
and experienced housing insecurity compared to 31.0% of respondents at four-year
colleges; and 13.1% of respondents at two-year colleges experienced homelessness
compared to 9.6% of respondents at four-year colleges.
• Students experienced high rates of basic needs insecurity in every region across the state.
Though respondents from the South Central region had the highest insecurity rate at 57.9%,
even respondents from the region with the lowest rate, North Puget Sound, still had an
insecurity rate of 45.0%.
Figure 3. Basic Needs Insecurity Rates by Region
South Central 57.9% Southeast 48.8%
South Puget Sound 54.1% Southwest 48.0%
Northeast 53.8% North Central 47.9%
Northwest 50.1% North Puget Sound 45.0%
Peninsula/Coastal 48.8%
8
Basic Needs Insecurity Rates by Sector and Region are presented in detail in Table 3 on page 10.
7Rates by Student Demographics
Significant disparities in basic needs security were present for WSES respondents based on
gender, race/ethnicity, parental education, income, and other demographic characteristics 9.
• Disparities by gender: Male respondents experienced basic needs insecurity at a rate of
45.7%, female respondents experienced basic needs insecurity at a rate of 51.3%, and
respondents who indicated other genders experienced basic needs insecurity at a rate of
56.4%.
• Disparities by race/ethnicity: American Indian/Alaskan Native and Black/African-American
respondents experienced the highest rates of basic needs insecurity based on respondent
race/ethnicity.
Figure 4. Basic Needs Insecurity Rates by Respondent Race/Ethnicity
American Indian/Alaska Native 67.8%
Asian/Asian-American 40.5%
Black/African-American 66.8%
Hispanic/Latinx 58.5%
Pacific Islander/Native Hawaiian 55.6%
Two or more races/ethnicities 55.7%
White 47.1%
30% 35% 40% 45% 50% 55% 60% 65% 70%
• Disparities by parental education: Respondents who reported being first-generation
students (neither of their parents/guardians earned a bachelor’s degree) experienced basic
needs insecurity at a rate of 58.7%, which is 9.3 percentage points higher than the overall
population.
• Disparities by income: Respondents who reported being eligible for need-based financial
(an indicator of low-income status) experienced basic needs insecurity at a rate of 66.2%,
which is 16.8 percentage points higher than the overall population.
9
Basic Needs Insecurity Rates by Student Demographics are presented in detail in Table 4 on page 10.
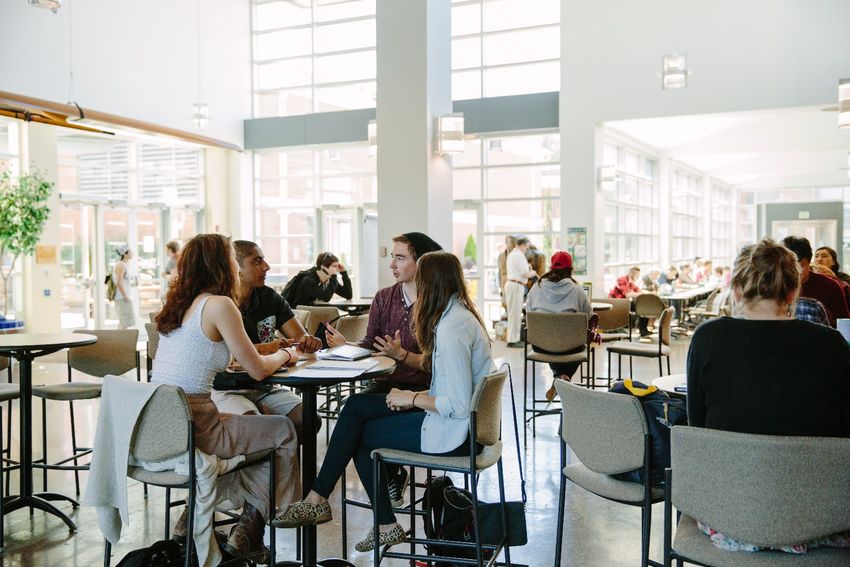
8• Other demographic disparities:
o Students who reported belonging to the LGBTQI+ community experienced basic needs
insecurity at a rate of 55.4%, which is 6.0 percentage points higher than the overall
population.
o Students who reported being the parent or guardian of a dependent experienced
basic needs insecurity at a rate of 61.1%, which is 11.7 percentage points higher than
the overall population.
o Students who reported living with a disability experienced basic needs insecurity at a
rate of 62.8%, which is 13.4 percentage points higher than the overall population.
o Students who reported being former foster youth experienced the highest rates of
basic needs insecurity among all demographic groups at a rate of 75.9%, which is 26.5
percentage points higher than the overall population.
67.5% experienced food insecurity
58.9% experienced housing insecurity
52.7% experienced both food and housing insecurity
23.7% experienced homelessness
Figure 5. Basic Needs Insecurity Rates by Other Respondent Demographics
80% 75.9%
70% 66.2%
62.8%
61.1%
58.7%
60%
55.4%
49.4%
50%
40%
30%
20%
10%
0%
Overall First-generation Low-income LGBTQI+ Students Students Former foster
w/disability w/dependent(s) youth
Either Insecurity Food Insecurity Housing Insecurity Both Insecurities Homelessness
9Basic Needs Insecurity Rate Tables
Table 3. Basic Needs Insecurity Rates by Sector and Region
South Puget Sound region
North Puget Sound region
South Central region
North Central region
Southwest region
Northwest region
Southeast region
Northeast region
Peninsula region
4-year colleges
2-year colleges
Overall
RATES BY
SECTOR/REGION
Food Insecurity 38.3% 39.1% 37.6% 37.0% 33.9% 42.9% 38.0% 38.5% 48.6% 41.9% 40.6% 36.0%
Housing Insecurity 34.2% 37.6% 31.0% 33.1% 31.6% 38.1% 33.3% 35.8% 36.9% 39.7% 23.4% 37.0%
Homelessness 11.3% 13.1% 9.6% 8.9% 10.1% 12.2% 11.2% 12.7% 12.2% 14.8% 5.7% 11.0%
Any Insecurity 49.4% 50.1% 48.8% 47.9% 45.0% 53.8% 50.1% 48.8% 57.9% 54.1% 48.8% 48.0%
Both Insecurities 23.5% 27.2% 20.4% 21.9% 20.6% 28.7% 21.7% 27.1% 29.1% 27.5% 16.3% 23.3%
Table 4. Basic Needs Insecurity by Student Demographics
RATES BY STUDENT Food Housing Any Both
Homelessness
DEMOGRAPHICS Insecurity Insecurity Insecurity Insecurities
Overall 38.3% 34.2% 11.3% 49.4% 23.5%
Female gender 38.7% 35.8% 10.7% 51.3% 24.2%
Male gender 34.9% 30.1% 11.7% 45.7% 20.1%
Other gender 45.7% 38.1% 14.4% 56.4% 28.5%
American Indian/Alaska Native 52.2% 59.6% 17.0% 67.8% 43.5%
Asian/Asian-American 29.7% 26.7% 7.6% 40.5% 16.3%
Black/African-American 56.0% 48.0% 19.9% 66.8% 38.6%
Hispanic/Latinx 46.5% 38.8% 10.7% 58.5% 27.4%
Pacific Islander/Native Hawaiian 48.1% 33.3% 15.0% 55.6% 25.5%
Two or more races/ethnicities 44.7% 35.5% 14.0% 55.7% 26.5%
White 34.8% 32.7% 10.4% 47.1% 21.4%
First-generation 46.2% 42.8% 14.3% 58.7% 31.6%
Eligible for need-based funding 52.2% 47.9% 15.1% 66.2% 34.8%
LGBTQI+ 43.8% 36.6% 13.2% 55.4% 26.8%
Students with dependent(s) 46.3% 51.7% 15.1% 61.1% 37.5%
Students with disability 49.2% 45.2% 15.8% 62.8% 33.6%
Former foster youth 67.5% 58.9% 23.7% 75.9% 52.7%
10Other Basic Needs
In addition to food security, housing security, and homelessness, WSES responses were also
analyzed to assess other basic needs, including childcare access, healthcare access, and
technology access. Rates for each of these areas are highlighted below 10.
Childcare Access
• One in every five students reported caring for a dependent. Overall, 18.7% of respondents
reported being the parent, primary caregiver, or guardian of a dependent(s), including 26.2%
of respondents at two-year colleges and 11.5% of respondents at four-year colleges. Of
those respondents, 30.2% reported needing to use childcare during the academic year.
• Of those needing to use childcare, two out of three students are unable to afford it. Of those
respondents who reported caring for a dependent and needing to use childcare, 66.5%
disagreed with the statement: “I can afford to pay for childcare.”
Figure 6. Ability to Afford Childcare (Overall)
To what extent do you agree with the following statement: I can afford to pay for childcare.
Strongly agree:
6.0%
Agree:
14.4%
Strongly disagree:
Undecided: 43.0%
13.1%
Disagree:
23.5%
• Inability to afford childcare was high across sectors and regions. Of those needing to use
childcare, 71.1% of respondents at two-year colleges and 57.3% of respondents at four-year
colleges reported being unable to afford childcare. Likewise, 83.3% of respondents from the
North Central and Southwest regions 11 (the regions with the highest rates) and 56.5% of
respondents from the North Puget Sound region (the region with the lowest rate) reported
being unable to afford childcare.
10
Rates for childcare and healthcare access are presented in detail in Tables 5 and 6 on Page 14.
11
The North Central and Southwest regions had the highest rates of respondents unable to afford childcare; however,
it is worth noting that the sample sizes for these specific observations were relatively small (6 and 12 individuals,
respectively). See Appendix B (item 22) for exact counts of responses by region.
11Healthcare Access
• Only half of students reported having reliable access to needed healthcare services. Overall,
only 50.5% of respondents indicated that they were always able to access the healthcare
services they needed in the past 12 months.
• Only one-third of students reported having reliable access to needed mental/behavioral
health services. Overall, 34.4% of respondents indicated that they were always able to
access the mental/behavioral health services they needed in the past 12 months.
Figure 7. Healthcare Access Rates Overall
In the past 12 months, I was able to access In the past 12 months, I was able to
the healthcare services I needed. access the mental/behavioral health
services I needed.
2.5%
4.5%
7.3%
5.6%
23.4% 34.4%
50.5%
34.1%
12.1%
25.5%
• Among students who reported limited access to health services, top barriers included:
o Healthcare
“I have health insurance, but it still costs too much” (27.0%)
“I wasn’t able to find a care provider” (24.2%)
“I was lacking information” (15.5%)
“I don’t have health insurance” (9.9%)
o Mental/behavioral health services
“I had difficulty finding an available appointment” (23.9%)
“I wasn’t able to find a care provider” (20.4%)
“I wasn’t sure where to go” (20.8%)
“I have health insurance, but it still costs too much” (20.4%)
12• There were significant gender, demographic, and regional disparities among students with
limited access to mental/behavioral health services.
o Disparities by gender: Among survey respondents, 29.2% of males, 39.2% of females,
and 61.7% of other gender students reported inadequate access to
mental/behavioral health services.
o Disparities by orientation and ability: Among survey respondents, 55.0% of LGBTQI+
students and 53.7% of students with disability reported inadequate access to
mental/behavioral health services, compared to 37.6% of students overall. These
rates represent a 17.5 percentage point disparity for LGBTQI+ respondents and a 16.1
percentage point disparity for respondents with disability.
o Disparities by region: Respondents from the Northwest region reported the highest
rates of inadequate access to mental/behavioral health services at 44.9%.
Respondents from the North Central region reported the lowest rates of inadequate
access to mental/behavioral health services at 29.0%.
Technology Access 12:
• Most students had regular access to a computer. Overall, 93.5% of respondents indicated
that they had regular access to a computer for their coursework in the past 30 days.
• About 1/10 of students did not have sufficient internet access. Overall, 10.0% of respondents
indicated that they did not have sufficient internet access to complete their coursework in
the past 30 days.
• There were significant race/ethnicity and regional disparities among students with
insufficient internet access.
o Disparities by race/ethnicity: Insufficient internet access was reported by 19.8% of
Black/African-American respondents (the race/ethnicity with the highest rate),
compared to 8.0% of Asian/Asian-American respondents (the race/ethnicity with the
lowest rate).
o Disparities by region: Insufficient internet access was reported by 18.5% of
respondents from the Southeast region (the region with the highest rate), compared
to 8.3% of respondents from the North Puget Sound region (the region with the
lowest rate).
12
Responses for technology access items are presented in detail in Appendix B (see items 12 and 13).
13Childcare and Healthcare Needs Rate Tables
Table 5. Childcare and Healthcare Access by Sector and Region
South Puget Sound
North Puget Sound
4-year colleges
2-year colleges
South Central
North Central
Southwest
Northwest
Southeast
Northeast
Peninsula
Overall
ACCESS BY
SECTOR/REGION
CHILDCARE ACCESS
Parent/guardian status
18.7% 26.2% 11.5% 19.5% 16.2% 22.8% 8.3% 33.3% 21.4% 26.0% 4.5% 24.6%
(Q22)
Childcare need
30.2% 29.5% 31.7% 26.1% 31.7% 29.2% 28.1% 26.2% 30.5% 30.4% 33.3% 30.0%
(Q22B)
Inability to afford
66.5% 71.1% 57.3% 83.3% 56.5% 74.0% 66.7% 65.4% 78.0% 70.2% 66.7% 83.3%
childcare (Q22C)
HEALTHCARE ACCESS
Inadequate healthcare
39.8% 37.5% 41.9% 29.0% 38.8% 37.3% 46.5% 33.5% 41.1% 40.7% 39.3% 48.6%
access (Q10)
Inadequate mental
37.6% 35.5% 39.6% 29.0% 36.8% 36.6% 44.9% 33.8% 37.0% 38.9% 38.6% 32.6%
healthcare access (Q11)
Table 6. Childcare and Healthcare Access by Student Population
CHILDCARE ACCESS HEALTHCARE ACCESS
ACCESS BY STUDENT Parent/ Childcare Inability to Inadequate Inadequate mental
POPULATION guardian need afford childcare healthcare healthcare
status (Q22) (Q22B) (Q22C) access (Q10) access (Q11)
Overall 18.7% 30.2% 66.5% 39.8% 37.6%
Female gender 22.3% 31.9% 67.4% 38.9% 39.2%
Male gender 13.9% 23.4% 63.6% 36.0% 29.2%
Other gender 6.0% 38.7% 66.7% 62.5% 61.7%
American Indian/Alaska Native 33.3% 21.2% 71.4% 30.0% 34.0%
Asian/Asian-American 14.9% 26.1% 38.9% 32.3% 29.0%
Black/African-American 33.0% 34.9% 69.2% 39.0% 31.9%
Hispanic/Latinx 23.0% 32.6% 70.0% 39.5% 39.4%
Pacific Islander/Native Hawaiian 34.4% 13.6% 100.0% 34.4% 28.1%
Two or more races/ethnicities 14.3% 41.7% 86.0% 41.0% 43.4%
White 17.3% 28.6% 66.2% 41.1% 39.9%
First-generation 25.9% 29.9% 71.5% 42.3% 39.5%
Eligible for need-based funding 24.7% 35.4% 76.0% 45.9% 42.6%
LGBTQI+ 9.0% 30.2% 62.5% 51.4% 55.0%
Students with dependent(s) 39.8% 35.3%
Students with disability 18.0% 27.4% 73.9% 51.4% 53.7%
Former foster youth 37.0% 38.5% 76.7% 46.0% 47.9%
14Resource Utilization
The WSES instrument also included items to assess the use of basic needs support resources,
including both community and public resources (item 14) and campus resources (item 15) 13.
• Only half of students experiencing basic needs insecurity used support resources. Overall,
48.9% of respondents experiencing basic needs insecurity accessed public basic needs
support resources, and 33.7% accessed campus basic needs support resources.
• Students from different sectors, regions, genders, ethnicities, and demographics used basic
needs support resources at significantly different rates.
o Utilization by sector: Respondents from two-year colleges reported a higher
utilization of public resources (60.0%) compared to those in four-year colleges
(46.7%). Conversely, respondents from two-year colleges reported a lower utilization
of campus resources (21.2%) compared to those in four-year colleges (44.9%).
o Utilization by region: Use of public resources by respondents spanned from 45.4% in
the Southeast region to 70.7% in the Peninsula/Coastal region. The reverse was true
for use of campus resources: the lowest level was reported by respondents from the
Peninsula/Coastal region (18.5%) and the highest level was reported by respondents
from the Southeast region (69.5%)
o Utilization by gender: Among survey respondents, 49.8% of males, 55.3% of females,
and 59.1% of other gender students reported utilizing public resources. Likewise,
31.8% of males, 30.6% of females, and 52.6% of other gender students reported using
campus resources.
o Utilization by race/ethnicity: Among race/ethnicity groups, Asian/Asian-American
respondents utilized public resources at the lowest rate (36.3%) and American
Indian/Alaska Native respondents utilized public resources at the highest rate
(78.9%). Conversely, American Indian/Alaska Native respondents utilized campus
resources at the lowest rate (29.2%) and Asian/Asian-American respondents utilized
campus resources at the highest rate (42.2%).
o Utilization by other demographics: Among other student populations, of note are the
low rates of campus resource use by online students (16.4%), students with
dependents (21.2%), and first-generation students (29.0%).
13
Rates for resource utilization are presented in detail in Tables 7 and 8 on Page 16. Responses by resource type are
presented in detail in Appendix B (see items 14 and 15).
15Resource Utilization Rate Tables
Table 7. Resource Utilization by Sector and Region
South Puget Sound
North Puget Sound
4-year colleges
2-year colleges
South Central
North Central
Southwest
Northwest
Southeast
Northeast
Peninsula
Overall
UTILIZATION BY
SECTOR/REGION
Public resources 53.3% 60.0% 46.7% 54.3% 47.0% 61.9% 45.7% 70.7% 58.4% 61.6% 45.4% 64.9%
Campus resources 37.8% 21.2% 44.9% 23.2% 31.1% 29.2% 49.0% 18.5% 34.5% 24.9% 69.5% 30.5%
Table 8. Resource Utilization by Student Population
UTILIZATION BY STUDENT POPULATION Public resources Campus resources
Overall 53.3% 37.8%
Female gender 55.3% 30.6%
Male gender 49.8% 31.8%
Other gender 59.1% 52.6%
American Indian/Alaska Native 78.9% 29.2%
Asian/Asian-American 36.3% 42.2%
Black/African-American 61.8% 32.1%
Hispanic/Latinx 57.1% 29.9%
Pacific Islander/Native Hawaiian 59.1% 36.6%
Two or more races/ethnicities 57.1% 35.3%
White 54.6% 30.9%
First-generation 65.0% 29.0%
Eligible for need-based funding 72.4% 32.8%
LGBTQI+ 55.8% 43.1%
Students with disability 66.4% 36.0%
Students with dependent(s) 76.7% 21.2%
Former foster youth 84.9% 30.6%
Attending fully online 62.5% 16.4%
16Washington Student Experience Survey: Conclusion
As the findings in the previous section demonstrate, the Washington Student Experience survey
identified considerable levels of basic needs insecurity among college students across the state. In
addition, the survey highlighted significant disparities for certain student groups, especially
American Indian/Alaska Native students, Black/African-American students, low-income students,
students with disability, students with dependents, and former foster youth.
The WSES findings are consistent with the most recent report from The Hope Center (the leading
source for national higher education basic needs data), The Hope Center Survey 2021 14 (HCS). Where
the WSES found an overall basic needs insecurity rate of 49% (for respondents in Washington), the
HCS found an overall basic needs insecurity rate of 58% (for respondents nationally). Likewise,
where the WSES found an overall food insecurity rate of 38%, the HCS found an overall food
insecurity rate of 34%. Worth noting is that while the WSES found a housing insecurity rate of 34%
and a homelessness rate of 11%, the HCS found a housing insecurity rate of 48% and a
homelessness rate of 14%. Worth noting here is that the HCS was administered in fall 2020 and the
WSES was administered in fall 2022, a full two years later. The differing circumstances of these
times, and particularly the differing impacts of the Covid-19 pandemic, likely account for some of
the differences observed in these rates. Nonetheless, the WSES findings build on the HCS findings,
confirming that basic needs insecurity is an ongoing issue for college students across the state 15.
The WSES findings provide insight into how to better support Washington college students, an
important step towards the state goal for postsecondary attainment. Supporting these students, as
The Hope Center suggests, “means implementing policies and practices that put the focus on their
humanity, through direct service, institutionally based policies and programs, and government
regulations … any change in, or development of, support for students must be forward thinking,
long-term, and grounded in sound, evidence-based research.” 16 The WSES now represents a source
of sound, evidence-based research to support the development of policies, programs, and
investments to address the attainment barriers associated with basic needs insecurity for college
students across Washington state.
14
The Hope Center Survey 2021, page 26:
https://hope.temple.edu/sites/hope/files/media/document/HopeSurveyReport2021.pdf
15
The dataset generated by the WSES also provides opportunities for additional analyses. Areas for further study may
include analysis of qualitative responses, weighting of quantitative responses based on respondent characteristics
(and the generation of corresponding confidence intervals), and regional and institution-level analyses.
16
The Hope Center Survey 2021, page 55:
https://hope.temple.edu/sites/hope/files/media/document/HopeSurveyReport2021.pdf
17Washington Student Experience Survey: Appendix A
Washington Student Experience Survey (Full Instrument)
INSTRUCTIONS TO STUDENTS
We are asking you to be in a research study. Participation is voluntary. The purpose of this form is to give
you the information you will need to help you decide whether to participate. Please read the form
carefully. You may ask questions about anything that is not clear. When we have answered all of your
questions, you can decide if you want to be in the study or not. This process is called “informed consent.”
DESCRIPTION OF THE SURVEY Colleges in Washington want to learn about the best ways to help students
succeed and are working with the Washington Student Achievement Council (https://wsac.wa.gov/) to
better understand challenges faced by students. Help them by sharing your real life experiences during
college by participating in this survey (you were invited to participate simply because you are currently
enrolled at a participating college in Washington). The survey questions will address your basic needs
(food, housing, etc.) and services available to you to meet those needs. Your responses will help colleges
to improve services for students and will be summarized in a report to state lawmakers to help them
better understand the support needs of college students.
WHAT WILL MY PARTICIPATION INVOLVE? This one-time survey should take less than 10 minutes to complete but will
make a big difference in colleges’ ability to understand and help students.
ARE THERE ANY BENEFITS TO ME? There are no direct benefits or compensation for participating in this
survey, however your participation in this survey may inform the development of new support services
which will benefit students in need at your college or university.
ARE THERE ANY RISKS TO ME? You may find some questions uncomfortable; remember you can reply
“prefer not to answer” to any questions. While the survey does not collect any personally-identifiable
information, there is a remote possibility that through a combination of demographic variables your
responses could be identified by researchers at your institution. However, individual-level responses will
be kept confidential (data will be saved on secure servers and accessible only to approved researchers at
participating colleges) and will not be included in any analyses or reports of survey results. (Note: Data
collected through this survey may be used for future studies on student needs without your additional
informed consent, but only by approved researchers at participating colleges.)
WHO SHOULD I CONTACT IF I HAVE QUESTIONS ABOUT THE SURVEY? Questions about the survey can be
directed to the Lead Partner Institution (Western Washington University) at ssi@wwu.edu. If you have
questions about your rights as a research participant, you can contact the Western Washington University
Office of Research and Sponsored Programs (RSP) at compliance@wwu.edu or (360) 650-2146.
AGREEMENT TO PARTICIPATE IN THIS SURVEY Your participation in this survey is completely voluntary. You
may stop the survey at any time. By participating in the survey you acknowledge you are currently enrolled
in a participating college and you consent to your responses being included in the survey dataset for
analysis and reporting purposes. You may print this page for your records.
Do you agree to participate?
a. Yes
b. No
What college or university do you attend? (drop-down menu)
18Module 1: Food security
First we will ask questions related to food.
1. In the last 30 days, the food that I bought just didn’t last, and I didn’t have money to get more.
a. Often true
b. Sometimes true
c. Never true
d. I prefer not to answer
2. In the last 30 days, I couldn’t afford to eat balanced meals.
a. Often true
b. Sometimes true
c. Never true
d. I prefer not to answer
⮚ If ‘Often true’ or ‘Sometimes true’ to question 1 or 2, ask:
3. In the last 30 days, did you ever cut the size of your meals or skip meals because there wasn’t enough money
for food?
a. Yes
b. No
c. I prefer not to answer
⮚ If ‘Yes’ to question 3, ask:
4. In the last 30 days, how many days did this happen?
a. Once
b. Twice
c. Three times
d. Four times
e. Five times
f. More than five times
g. I prefer not to answer
5. In the last 30 days, did you ever eat less than you felt you should because there wasn’t enough money for
food?
a. Yes
b. No
c. I prefer not to answer
6. In the last 30 days, were you ever hungry but didn’t eat because there wasn’t enough money for food?
a. Yes
b. No
c. I prefer not to answer
Module 2: Housing security
Next we will ask questions about housing.
7. Do you currently live in college housing?
a. Yes
b. No
c. I prefer not to answer
198. In the past 12 months, which of the following have you experienced (check all that apply):
a. I had a rent or mortgage increase that made it difficult to pay
b. I was unable to pay or underpaid my rent or mortgage
c. I was unable to pay or underpaid a utility bill (electricity, gas, water, etc.)
d. I had an account default or go into collections
e. I moved in with other people because of financial problems
f. I lived with others beyond the expected capacity of a house or apartment
g. I had to leave my household because I felt unsafe
h. I moved three or more times
i. None of the above, none of these apply to me.
j. I prefer not to answer
9. In the past 12 months, have you slept in any of the following places due to loss of housing, economic hardship,
or a similar reason (check all that apply)?
a. Temporarily staying with relative, friend or couch surfing until I find other housing
b. In a camper or RV without a permanent home to return to
c. Temporarily at a hotel or motel without a permanent home to return to
d. In closed area/space with roof not meant for human habitation (such as abandoned building; car,
truck, or van; encampment or tent; unconverted garage, attic, or basement; etc.)
e. At outdoor location (such as street, sidewalk or alley; bus or train stop; campground or woods, park,
beach, or riverbed; under bridge or overpass)
f. At a treatment center (such as detox, hospital, etc.)
g. In transitional housing or independent living program
h. At an overnight shelter
i. At a group home such as halfway house or residential program for mental health or substance abuse
j. None of the above.
k. I prefer not to answer.
⮚ If affirmative to question 7, and responded #8 a-h, ask
9B. Did you sleep in this place/these places because you had no access to campus housing between academic
terms?
a. Yes
b. No
c. I prefer not to answer
If you have questions about resources for food or housing, please contact (insert campus contact information).
Module 3: Healthcare access
Next we will ask questions about healthcare.
10. In the past 12 months, I was able to access the healthcare services I needed.
a. Always true
b. Sometimes true
c. Never true
d. Does not apply
e. I prefer not to answer
⮚ If sometimes/never to question 10, ask:
10B. What prevented you from accessing the healthcare services you needed? (Select all that apply)
a. I don’t have health insurance.
b. I have health insurance, but it still costs too much.
c. I wasn’t able to find a care provider.
d. I was lacking information.
e. Other/write in.
f. I prefer not to answer
2011. In the past 12 months, I was able to access the mental / behavioral health services I needed.
a. Always true
b. Sometimes true
c. Never true
d. Does not apply
e. I prefer not to answer
⮚ If sometimes/never to question 11, ask:
11B. What prevented you from accessing the mental health services you needed? (Select all that apply)
a. Financial reasons - I don’t have health insurance.
b. I have health insurance, but it still costs too much.
c. I wasn’t able to find a care provider.
d. I had difficulty finding an available appointment.
e. I wasn’t sure where to go.
f. Other/write in option
g. I prefer not to answer
Module 4: Technology access
Next we will ask you about technology and internet access.
12. In the last 30 days, have you had regular access to a suitable computer to use for your coursework?
a. Yes
b. No
c. Does not apply
d. I prefer not to answer
13. In the last 30 days, have you had sufficient internet access to complete your coursework?
a. Yes
b. No
c. Does not apply
d. I prefer not to answer
Module 5: Resource utilization
Next we will ask you about resources you may have used.
14. In the past 6 months, which of the following community and public resources have you used (check all that apply):
a. Tax refunds (including EITC)
b. Basic Food / SNAP (food benefits)
c. Medicaid or public health insurance
d. Any utility assistance programs (e.g.: help paying for heat or water)
e. Any community housing assistance programs
f. Any community transportation assistance programs
g. Veterans benefits
h. SSDI (social security disability income)
i. Childcare assistance
j. SSI (Supplemental Security Income)
k. Unemployment compensation or insurance
l. TANF (public cash assistance, formerly called ADC or ADFC)
m. Other / write in
n. I prefer not to answer
2115. In the past 6 months, have you used any campus services or resources for basic needs? (check all that apply)
a. Food resources
b. Housing resources
c. Healthcare
d. Mental/behavioral healthcare
e. Childcare
f. Navigation / case management
g. Other / write in
h. I prefer not to answer
16. Please share any additional comments related to your experiences: (text box)
Student demographics questions
17. In what year were you born? (drop-down menu)
18. How do you usually describe your race and/or ethnicity?
a. White
b. African, African American or Black
c. Hispanic or Latinx
d. American Indian or Alaska Native or Indigenous
e. Middle Eastern or North African or Arab or Arab American
f. Southeast Asian
g. Pacific Islander or Native Hawaiian
h. Asian or Asian-American
i. 2 or more races/ethnicities
j. Not listed
k. I prefer not to answer
19. With which gender do you most identify?
a. Woman
b. Man
c. Non-Binary
d. Not listed
e. I prefer not to answer
20. Do you identify as a member of the LGBTQI+ community?
a. Yes
b. No
c. I prefer not to answer
21. Are you living with a physical, mental/emotional or learning disability?
a. Yes
b. No
c. I prefer not to answer
22. Are you the parent, primary caregiver, or guardian (legal or informal) of any dependents?
a. Yes
b. No
c. I prefer not to answer
⮚ If yes for dependents, ask:
22B. Do you need, use, or plan to use childcare this academic year?
a. Yes
b. No
c. I prefer not to answer
22⮚ If yes for use of childcare, ask:
22C. To what extent do you agree with the following statement: I can afford to pay for childcare.
a. Strongly disagree
b. Disagree
c. Undecided
d. Agree
e. Strongly Agree
f. I prefer not to answer
23. Have you ever served, or are you currently serving, in the U.S. Armed Forces, Military Reserves, or National Guard?
a. Yes
b. No
c. I prefer not to answer
24. Have you ever been in foster care?
a. Yes
b. No
c. I prefer not to answer
If yes, ask:
24B. Were you in foster care after your 1st birthday?
a. Yes
b. No
c. I prefer not to answer
If yes, ask:
24C. Did you “age out” of foster care?
a. Yes
b. No
c. I prefer not to answer
25. Which of the following best describes your academic program?
a. Pre-college or basic education classes
b. Certificate
c. Apprenticeship
d. College general education requirements
e. Associate degree
f. Bachelor's Degree
g. Graduate Degree
h. Doctoral or professional degree
i. I am not pursuing a degree or certificate
j. I prefer not to answer
26. What is the highest level of education completed by any of your parents and/or guardians?
a. Eighth grade or lower
b. Between 9th and 12th grade (but no high school diploma)
c. High school diploma
d. GED
e. Some college (but no college degree)
f. College certificate or diploma
g. Associate’s degree
h. Bachelor’s degree
i. Graduate degree
j. Don’t know
k. I prefer not to answer
2327. As of today, are you attending college full-time or part-time?
a. Full-time (at least 12 credits)
b. Part-time (less than 12 credits)
c. I prefer not to answer
28. Are you attending classes fully online?
a. Yes
b. No
c. I prefer not to answer
29. Are you currently receiving income-based financial aid for your education (for example: Pell grant, Washington
College Grant, need-based scholarships, etc.)?
a. Yes
b. No
c. Don’t know
d. I prefer not to answer
30. What is your current employment status?
a. Employed full-time
b. Employed part-time
c. Working multiple part-time jobs
d. Currently seeking employment
e. Not currently seeking employment
f. Other
g. I prefer not to answer
> If graduate degree (g) for item 25, and responded a-c:
30B. Do you receive university funding for a graduate assistantship, or other university funding?
a. Yes
b. No
c. I prefer not to answer
24Washington Student Experience Survey: Appendix B
Response Counts: Basic Needs Items
Items 1-6 (Food Security):
25Items 7-8 (Housing Security):
26Item 9 (Homelessness):
27Items 10-11 (Healthcare Access):
28Items 12-13, 22 (Technology Access, Childcare Access):
29Items 14-15 (Resource Utilization):
30Response Counts: Demographic Items
Item Count Percent
COLLEGE SELECTION - What college or university do you attend?
Bellevue College 415 4.25%
Bellingham Technical College 34 0.35%
Big Bend Community College 135 1.38%
Cascadia College 151 1.55%
Central Washington University 566 5.79%
Columbia Basin College 177 1.81%
Eastern Washington University 453 4.64%
Everett Community College 75 0.77%
Grays Harbor College 86 0.88%
Green River College 184 1.88%
Highline College 122 1.25%
Lake Washington Institute of Technology 218 2.23%
Lower Columbia College 66 0.68%
North Seattle College 238 2.44%
Olympic College 115 1.18%
Peninsula College 166 1.70%
Pierce College 467 4.78%
Renton Technical College 64 0.65%
Seattle Central College 374 3.83%
Seattle University 188 1.92%
Shoreline Community College 95 0.97%
South Puget Sound Community College 291 2.98%
South Seattle College 158 1.62%
Spokane Community College 194 1.99%
Spokane Falls Community College 197 2.02%
Tacoma Community College 323 3.31%
The Evergreen State College 161 1.65%
University of Washington - Bothell 504 5.16%
University of Washington - Seattle 1342 13.73%
University of Washington - Tacoma 371 3.80%
Walla Walla Community College 93 0.95%
Washington State University - Everett 8 0.08%
Washington State University - Global 120 1.23%
Washington State University - Pullman 475 4.86%
Washington State University - Spokane 56 0.57%
Washington State University - Tri-Cities 74 0.76%
Washington State University - Vancouver 134 1.37%
Western Washington University 652 6.67%
Whatcom Community College 229 2.34%
Total 9771
31Item Count Percent
Q18 - How do you usually describe your race and/or ethnicity?
White 4378 54.72%
African, African American, or Black 454 5.67%
Hispanic or Latinx 827 10.34%
American Indian or Alaska Native or INdigenous 100 1.25%
Middle Eastern or North African or Arab or Arab American 80 1.00%
Southeast Asian 255 3.19%
Pacific Islander or Native Hawiian 64 0.80%
Asian or Asian-American 940 11.75%
Two or more race/ethnicies 722 9.02%
Other (please specify) 181 2.26%
Total 8001
Q19 - With which gender do you most identify?
Woman 5085 63.23%
Man 2389 29.71%
Non-binary 467 5.81%
Not listed 101 1.26%
Total 8042
Q20 - Do you identify as a member of the LGBTQI+ community?
Yes 2382 29.80%
No 5610 70.20%
Total 7992
Q21 - Are you living with a physical, mental/emotional, and/or learning disability?
Yes 2810 35.04%
No 5209 64.96%
Total 8019
Q22 - Are you the parent, primary caregiver, or guardian (legal or informal) of any
dependents?
Yes 1500 18.65%
No 6542 81.35%
Total 8042
Q23 - Have you ever served, or are you currently serving, in the U.S. Armed Forces, Military
Reserves, or National Guard?
Yes 355 4.39%
No 7724 95.61%
Total 8079
32Item Count Percent
Q24 - Have you ever been in foster care?
Yes 213 2.64%
No 7866 97.36%
Total 8079
Q24B - Were you in foster care after your 1st birthday?
Yes 166 77.93%
No 47 22.07%
Total 213
Q24C - Did you "age out" of foster care?
Yes 48 28.92%
No 118 71.08%
Total 166
Q25 - Which of the following best describes your academic program?
Pre-college or basic education classes 416 5.18%
Certificate 271 3.37%
Apprenticeship 23 0.29%
College general education requirements 484 6.02%
Associate degree 2134 26.56%
Bachelor's degree 3280 40.82%
Graduate degree 802 9.98%
Doctoral or professional degree 361 4.49%
I am not pursuing a degree or certificate 265 3.30%
Total 8036
Q26 - What is the highest level of education completed by any of your parents and/or
guardians?
8th grade or lower 330 4.11%
Between 9th and 12th grade (but no high school diploma) 291 3.63%
High school diploma 1132 14.10%
GED 170 2.12%
Some college (but no college degree) 973 12.12%
College certificate or diploma 469 5.84%
Associate's degree 611 7.61%
Bachelor's degree 1995 24.85%
Graduate degree 1708 21.28%
I don't know 348 4.34%
Total 8027
33Item Count Percent
Q27 - As of today, are you attending college full-time or part-time?
Full-time (at least 12 credits) 6075 76.06%
Part-time (less than 12 credits) 1912 23.94%
Total 7987
Q28 - Are you attending classes fully online?
Yes 2024 25.19%
No 6012 74.81%
Total 8036
Q29 - Are you currently receiving income-based financial aid for your education (for
example: Pell Grant, Washington College Grant, need-based scholarships, etc.)?
Yes 2896 36.06%
No 4436 55.24%
Don't know 698 8.69%
Total 8030
Q30 - What is your current employment status?
Employed full-time 1206 15.04%
Employed part-time 2445 30.48%
Working multiple part-time jobs 419 5.22%
Unemployed and currently seeking employment 1378 17.18%
Unemployed and not currently seeking employment 2043 25.47%
Other (please specify) 530 6.61%
Total 8021
Q30B - Do you receive university funding for a graduate assistantship or other university
funding for your employment?
Yes 139 26.68%
No 382 73.32%
Total 521
34You can also read