BCCDC Data Summary 7 October 2021
←
→
Page content transcription
If your browser does not render page correctly, please read the page content below
BCCDC Data Summary
     7 October 2021

                      1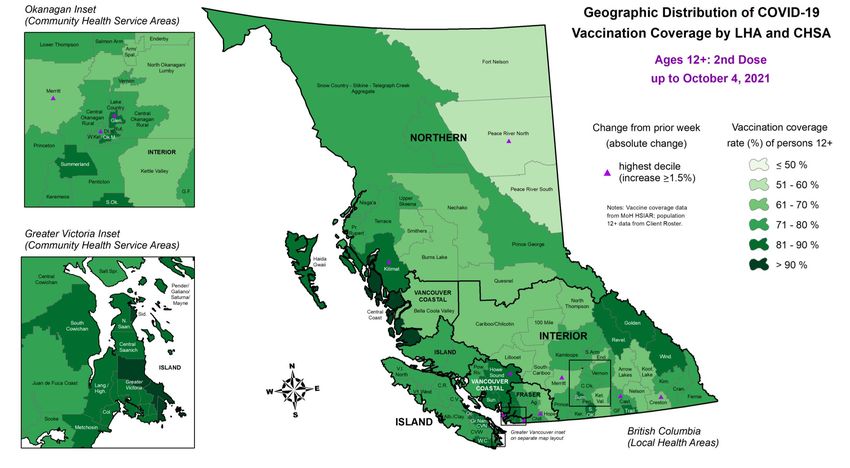
Purpose
The surveillance deck is a summary of COVID-19 related indicators that can help inform the pandemic
response in British Columbia. This surveillance monitoring constitutes the medical chart for population
health assessment that guides the public health community of practice. As such this is a working
document that reflects a snapshot in time and may differ from other published reports.
Data Sources
The collection, use and disclosure of case data is subject to the Public Health Act. COVID-19 cases are
reported under the Public Health Act to the health authority of residence. Public health case
notification, clinical management, contact tracing and follow-up contributes surveillance data for
regional and provincial COVID-19 monitoring. Each regional health authority have their own workflows
and information systems for capture of relevant data. This data foremost serves the public health and
clinical management of the case and their contacts.
Disclaimer
• Data and key messages within these documents are not finalized and considered to be work in
  progress that is subject to retroactive changes as more data and information become available.
• Accurate interpretation of figures may be difficult with the limited inclusion of data notes and
  methodology descriptions in this document.
                                                                                                   2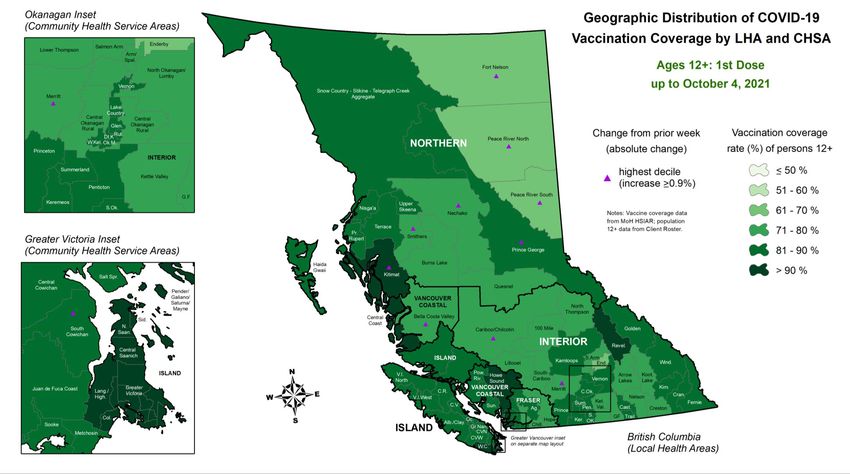
Table of Contents
 Overall Summary ……….…………………………………………………………………………………………………………………………..4

 Surveillance …………………………………………………………………………………………………………………………………………...5

       BC Epidemiology………………………………………………………………………………………………………………….…..5

       Outcomes by vaccine status……………………………………………………………………………………………………17

       Vaccinations…………………………………………………………………………………………………………………………..26

       Labs/Genomics…………………………………………………………………………………………….………………………...34

 Modelling…………………………………………………………………………………………………………………………………..………….43

 Pediatric Report…………………………………………………………………………………………………………………………………….44

 Additional Resources………………….……..………………………………………………………………………………………………….52
Overall Summary for surveillance data to Oct 5
• The majority of new cases and hospitalizations are among unvaccinated individuals.
• New hospitalizations are elevated and stable provincially; hospital/critical care census is stable
  provincially, but there is variation across BC; new deaths are low but slowly increasing.
• Hospitalization rates among children continue to remain very low.
• Case rates are increasing in NH and FH, stable and elevated in IH, and stable in VCH and VIHA.
    • All health authorities have local health regions with high case rates

• Test positivity among public tests is stable (~6% provincially), and is high and stable in NH (18%).
    • Testing rates are high and continue to increase in children (
Sep 30 to Oct 05: BC COVID-19 Profile
  191,124 total cases           1,992   total deaths
    4,879 new this week           39    new this week

   10,162 ever hospitalized   182,786   removed from isolation
     289 new this week          5,057   new this week

                                                                 4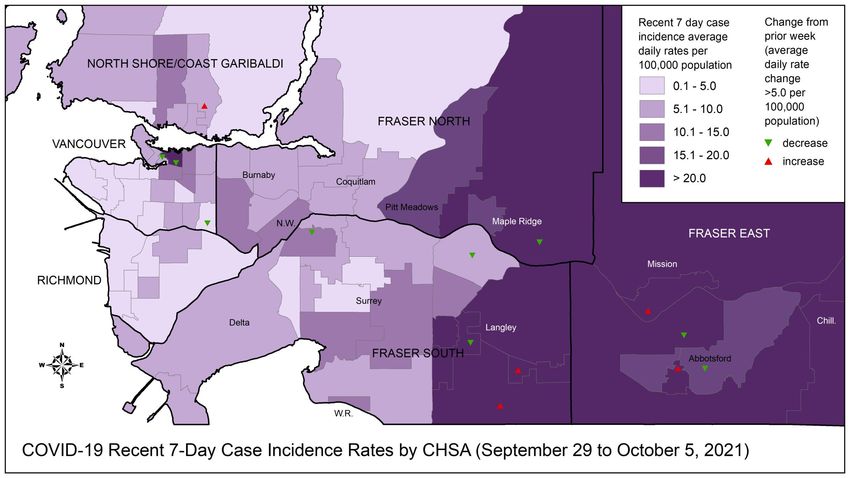
Case rates and new hospitalizations are elevated and stable at provincial level, but trends differ by HA –
note the steep rise in Northern region; new deaths are low but slowly increasing.

                                                                                                      For latest version of a graph similar to this one (difference:
                                                                                                      hospital census, not new hospitalizations), see the Epi App

                                     For latest version of a graph similar to this one (difference:                                                         6
                                     hospital census, not new hospitalizations), see the Epi App
The majority of new cases and hospitalizations continue to be among
unvaccinated individuals

                      For latest version of this figure, see COVID-19 Regional Surveillance Dashboard   7
Number of new hospital admissions elevated and relatively stable. Deaths are low, but have
increased in individuals 40-59 years in last couple of weeks.

                                                                                             8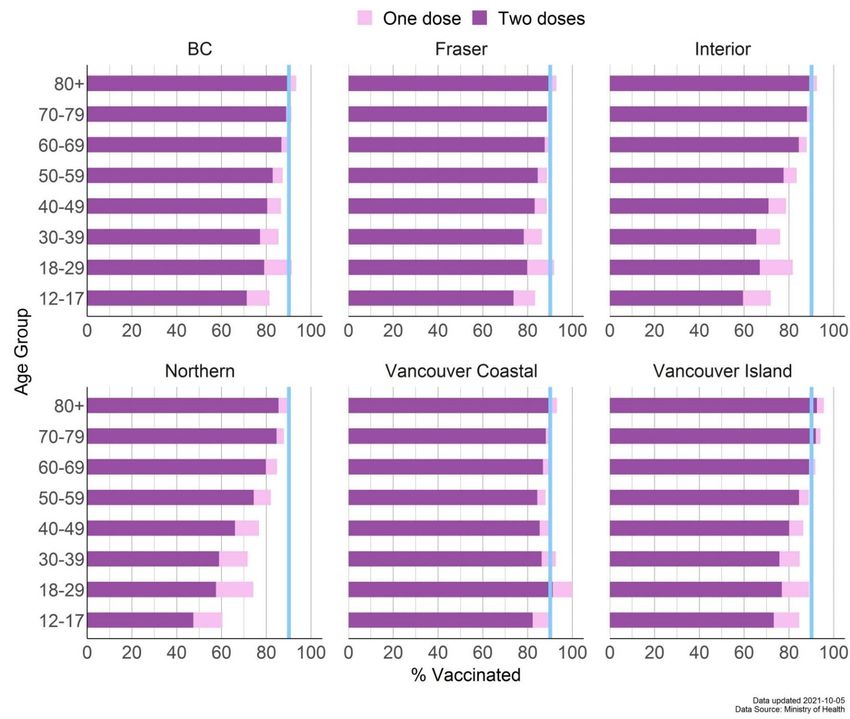
Trends in number and rate of new hospitalizations by age group, BC, 1 Jan – 2 Oct 2021

                                                                        Hospitalization counts and rates
                                                                        among children (0-19 years)
                                                                        continue to remain very low

                                                                                                           9
                              *Data based on admission date for hospitalizations
Hospital census is elevated and increasing in NH, elevated and decreasing in IH and stable
elsewhere. Critical care census is stable across province.

                                                                       % in critical care

                                                                                             10
Incidence among 0-11 year olds is elevated, but decreasing.
Note: testing rates among children are very high, see slides 44 and 45
11For all age groups, those who are vaccinated have very low case rates. Among those
unvaccinated, case rate is the lowest in the 0-11 age group even with higher testing rates.
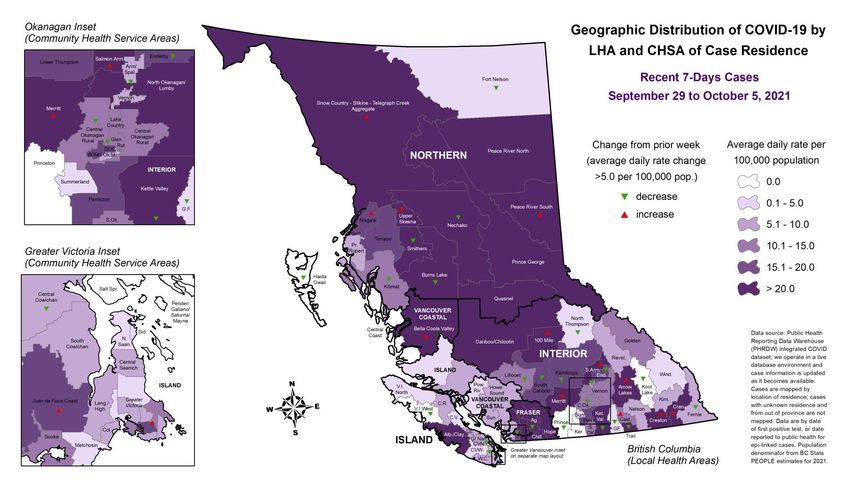
***NEW***For latest version of this figure, see COVID-19 Regional Surveillance Dashboard 12For latest version of this map (note: change symbols not 13 included), see COVID-19 Regional Surveillance Dashboard
For latest version of this map, (note: change symbols not   14
included), see COVID-19 Regional Surveillance Dashboard
Prince George and
Chilliwack have both
high number of cases
and high case rates

                       For latest version of this graph, see COVID-19 Regional Surveillance Dashboard   15
Prince George and
Chilliwack have both
high number of cases
and high case rates
For latest version of this graph, see COVID- 16
19 Regional Surveillance DashboardKey messages – Outcomes by vaccine status
• Most of the recent cases and hospitalizations continue to be among unvaccinated
individuals
• Based on data over the last 4 weeks, compared with fully vaccinated individuals and after adjusting
for age differences, unvaccinated individuals are
• ≈ 10x more likely to become a case
• ≈ 52x more likely to be hospitalized
• ≈ 44x more likely to die
• NB: relative rates fluctuate over time and do not represent vaccine effectiveness
• Unvaccinated: no dose or not yet protected (Over the past week, fully vaccinated individuals represented 71% of BC’s total population, but
accounted for only 30% of cases and 19% of hospitalizations.
These % fluctuate over time. There are many more vaccinated individuals than unvaccinated individuals, and thus it is
important to take the denominator into account. These figures do not represent vaccine effectiveness.
We operate in a live database environment and data get updated retrospectively. These figures were run on Tuesday Oct 5 and may differ slightly from previously reported counts. Cases are
captured based on surveillance date. Hospitalizations are by admission date. Please note that there is often a multiple-days lag in recording hospitalizations, e.g. some hospital admissions that
occurred on Aug 24th may not be captured by our surveillance system until Aug 29th.
18Over the past month, fully vaccinated individuals accounted for 26% of cases and 16% of
hospitalizations.
These % are expected to increase over time as more people get fully vaccinated and there are fewer
unvaccinated people. If 100% of population gets fully vaccinated (which is almost the case for many long term
care residents for example), then any new cases, hospitalizations, or deaths will be among vaccinated people.
A large proportion of deaths is
among older (80+) individuals,
>90% of whom are fully
vaccinated, which explains the
higher relative % of deaths
among the fully vaccinated.
67%
We operate in a live database environment and data get updated retrospectively. These figures were run on Oct 5 th and thus will differ slightly from previously reported counts. Cases are captured
based on surveillance date. Hospitalizations are by admission date. Deaths are by date of death. Please note that there is often a multiple-days lag in recording hospitalizations and deaths, e.g.
some hospital admissions that occurred on Aug 24 th may not be captured in our surveillance system until Aug 29th.
19COVID-19 health outcomes by vaccination status and age, BC, Sep 7 – Oct 4, 2021
COVID-19 case rate by
vaccination status and
Health Authority, July 1 –
Oct 6, 2021

Denominators for each vaccine status
group are dynamic and change daily
as people flow from being
unvaccinated to protected by 1 dose
to protected by 2 doses. Therefore,
the denominators are different across
groups and over time.

                                        For latest version of this figure, see COVID-19 Regional Surveillance Dashboard   21
COVID-19 case rate by
vaccination status and
age, July 1 – Oct 6,
2021
Denominators for each vaccine status
group are dynamic and change daily
as people flow from being
unvaccinated to protected by 1 dose
to protected by 2 doses. Therefore,
the denominators are different across
groups and over time.
For latest version of this figure, see COVID-19 Regional Surveillance Dashboard 22COVID-19 hospitalization
rate by vaccination
status, July 1 – Sept 30,
2021
Data by hospital admission date.
Denominators for each vaccine status
group are dynamic and change daily
as people flow from being
unvaccinated to protected by 1 dose
to protected by 2 doses. Therefore,
the denominators are different across
groups and over time.
For latest version of this figure, see COVID-19 Regional Surveillance Dashboard 23COVID-19
hospitalization rate by
vaccination status and
age, July 1 – Sept 30,
2021
Rates for unvaccinated/1 dose 80+
year olds not shown as they are
unstable, making it difficult to
Denominators for each vaccine status interpret data for other age groups
group are dynamic and change daily
as people flow from being
unvaccinated to protected by 1 dose
to protected by 2 doses. Therefore,
the denominators are different across
groups and over time.
For latest version of this figure, see COVID-19 Regional Surveillance Dashboard 24After adjusting for age, unvaccinated individuals continue to be at a significantly higher risk of
infection, hospitalization, and death from COVID-19 compared with fully vaccinated
Relative rate fluctuates over time (see graph to the right). These figures do not represent vaccine effectiveness.
~10x
~52x
~44x
25Vaccination progress in BC over time by age group and dose number up to Oct. 5, 2021
~90% of adults 50+
have at least 1 dose – of
this group, almost all
have their 2nd dose too
~80% of total BC
population has 1 dose
26Vaccination progress in BC
and by Health Authority as
of Oct 5, by age group and
dose number (%)
Denominator for this graph is Client Roster
maintained by the BC Ministry of Health.
Client Roster population data are sourced
from a list of all residents registered with
Medical Services Plan as of March 12, 2021.
Since this date, people may have moved,
permanently or temporarily, and have been
vaccinated or reported their vaccination
status. As a result, there are areas in BC
where there will be more people vaccinated
than there were living in that area in March
2021. The Client Roster likely
underrepresents new arrivals into a region
such as young adults relocating to attend
post-secondary institutes and workers at
major construction project areas. An
alternative denominator would be based on
projections derived from Census 2016,
which is also not representative of the
current BC population. There is no perfect
denominator.
27
Blue line is for visual reference only; note the change to 90%
For latest version of this figure, see COVID-19 Regional Surveillance Dashboard 27For latest version of this map, see COVID-19 Regional Surveillance Dashboard 28
NEW 2nd dose map

For latest version of this map, see COVID-19 Regional Surveillance Dashboard                29
For latest version of this map, see COVID-19 Regional Surveillance Dashboard 30
NEW 2nd dose map For latest version of this map, see COVID-19 Regional Surveillance Dashboard 31
Lab - Key Messages
• Test positivity among publicly funded tests has decreased in last few weeks (current ~6%)
    • Test positivity varies by HA, ranging from 4.0% in VCH to 18.4% in NH.
    • Test positivity is high in Fraser East and most HSDAs in NH and IH
• Publicly funded testing increased 8% this week (~80K total public tests)
    • Testing rates remain elevated in children (
Weekly Summary of ALL lab tests performed
3,898,543 total specimens tested
5% relative to last week
103,893 new this epi week
199,434 total positive specimens 4.9% positivity
0.4% absolute change from
5,088 new positive this epi week last week
19 hr mean turnaround time (TAT)
1% TAT relative to last
18 [11-25] Median [Q1 – Q3] TAT week
Weekly Summary of Lab tests paid Publicly
2,949,696 total specimens tested
8% relative to last week
80,179 new this epi week
196,952 total positive specimens 6.3% positivity 33
0.7% absolute change from
5,022 new positive this epi week
last week
Data source: PLOVER extract at 10:30am on October 6, 2021.
Epi week 39 (Sep 26 – Oct 2)For latest version of this map, see the new (note: change 34 symbols not included) COVID-19 Surveillance Dashboard
Includes all tests

For latest version of this map, see the new (note: change                35
symbols not included) COVID-19 Surveillance Dashboard
Percent positivity decreased slightly in the most recent week (~6%), in parallel with an increase
in the number of publicly funded specimens tested.

                                                                                               36
Case incidence rates decreased or remained stable in all HAs.
Fraser Health and Northern Health Authorities have the highest testing rates in the province
6.2% 5.6% 8.7%
18.4% 4.0% 5.0%
37Test positivity high in NH and East Kootenay; incidence is increasing in Fraser East and NHA and
remains elevated in IH, NH and Fraser East.
For latest version of a graph similar to this one 38
(difference: all tests, not public tests), see the Epi AppTesting rates continue to increase for individuals
Among sequenced VOC samples provincially based on information for September 26 to October
2, the dominant VOC continues to be Delta ~100%

                                                                             Alpha (%) ≈ 0%

                                                                              Delta (%) ≈ 100%

                                                                             Gamma (%) ≈ 0%

                                                                                              40
Wastewater samples can act as a population-level sentinel surveillance tool – viral signals found
in wastewater are highly correlated with disease incidence in population.
In Fraser Health, the viral signal from wastewater reflects the trends in case counts in this region:
Time-series plots show weekly or bi-weekly viral signals from each wastewater plant (right y-axis), overlaid with rolling 7-day mean of daily new cases within
wastewater catchment area (left y-axis). Plot title shows wastewater plant name, followed by approximate catchment area.
41In Vancouver Coastal Health, the viral signal from wastewater reflects the declining trends in
case counts in this region:
Time-series plots show weekly or bi-weekly viral signals from each wastewater plant (right y-axis), overlaid with rolling 7-day mean of daily new cases within
wastewater catchment area (left y-axis). Plot title shows wastewater plant name, followed by approximate catchment area.
42Pediatric Report - Key Messages • New mask mandate implemented for school grades K-3 • Case numbers in
Sep 30 to Oct 06: Pediatric COVID-19 Profile

Age group: 0-4                  Age group: 0-4                   Age group: 0-4                   Age group: 0-4
     4,920 total cases                103 ever hospitalized            11 ever in critical care          2 total deaths
       204 new this week                 3 new this week                1 current this week              0 new this week

Age group: 5-11                 Age group: 5-11                  Age group: 5-11                  Age group: 5-11
    12,132 total cases                  44 ever hospitalized            3 ever in critical care          0 total deaths
       877 new this week                 1 new this week                0 current this week              0 new this week

Age group: 12-17                Age group: 12-17                 Age group: 12-17                 Age group: 12-17
    11,575 total cases                  45 ever hospitalized            7 ever in critical care          0 total deaths
       267 new this week                 2 new this week                1 current this week              0 new this week

* Hospital census numbers are as of Oct 05 2021
* New cases and new deaths are net new between Line lists of Sep 29 and Oct 06

                                                                                                                      45
In regions with highly vaccinated adult populations, incidence is lower in children. Some of the recent increase in incidence among
Elevated case rates in children
and youth have not translated
into more hospitalizations

                         0-11 years

                       12 to 19 years

                           ***NEW***For latest version of this figure, see COVID-19 Regional Surveillance Dashboard   47
Hospitalization rates remain very low and stable; deaths are extremely rare
Note: Absolute number of new hospitalizations still low (see y-axis on right)
48COVID-19 vaccination coverage with 1st dose among 12-17 year olds, by Local Health Area,
up to 4 Oct 2021: there is more variation in this age group compared with older age groups
For latest version of this map, see COVID-19 Regional Surveillance Dashboard 49Testing rates among all pediatric age groups have recently stabilized but remain high
50Testing rates among 0-17 years remain high in all HSDAs. Percent positivity is high in NH, East Kootenay,
Kootenay Boundary and Thompson Cariboo Shuswap. Incidence is elevated in Fraser East, and across NH
and IH.
51Additional Resources • BCCDC COVID-19 Regional Surveillance Dashboard showing maps, vertical plots, and trends by LHA can be found here • More BC COVID-19 data, including the latest Situation Report, maps, and BC COVID-19 public dashboard, can be found here • For more information on variants of concern and whole genome sequencing, the latest report is posted here • To put BC provincial, Health Authority, and HSDA trajectories into national and international context, see BCCDC COVID-19 Epidemiology app • COVID SPEAK 2020 Round 1 Survey results • Slides for previous public and modelling briefings by Dr. Bonnie Henry can be found here • PHAC’s COVID-19 Epidemiology update can be found here
You can also read


