Beel, C., Heslop, J., Orwin, J., Pope, M., Schevers, A., Hung, J., Lafreniere, M., Lamoureux, S. (2021): Emerging dominance of summer rainfall ...
←
→
Page content transcription
If your browser does not render page correctly, please read the page content below
Beel, C., Heslop, J., Orwin, J., Pope, M., Schevers, A., Hung,
J., Lafreniere, M., Lamoureux, S. (2021): Emerging
dominance of summer rainfall driving High Arctic
terrestrial-aquatic connectivity. - Nature Communications,
12, 1448.

https://doi.org/10.1038/s41467-021-21759-3

Institional Repository GFZpublic: https://gfzpublic.gfz-potsdam.de/
ARTICLE
                  https://doi.org/10.1038/s41467-021-21759-3                 OPEN

                  Emerging dominance of summer rainfall driving
                  High Arctic terrestrial-aquatic connectivity
                  C. R. Beel 1,2,5 ✉, J. K. Heslop1,3,5, J. F. Orwin                    1,4,   M. A. Pope1, A. J. Schevers1, J. K. Y. Hung           1,

                  M. J. Lafrenière 1 & S. F. Lamoureux 1

                  Hydrological transformations induced by climate warming are causing Arctic annual fluvial
1234567890():,;

                  energy to shift from skewed (snowmelt-dominated) to multimodal (snowmelt- and rainfall-
                  dominated) distributions. We integrated decade-long hydrometeorological and biogeo-
                  chemical data from the High Arctic to show that shifts in the timing and magnitude of annual
                  discharge patterns and stream power budgets are causing Arctic material transfer regimes to
                  undergo fundamental changes. Increased late summer rainfall enhanced terrestrial-aquatic
                  connectivity for dissolved and particulate material fluxes. Permafrost disturbances (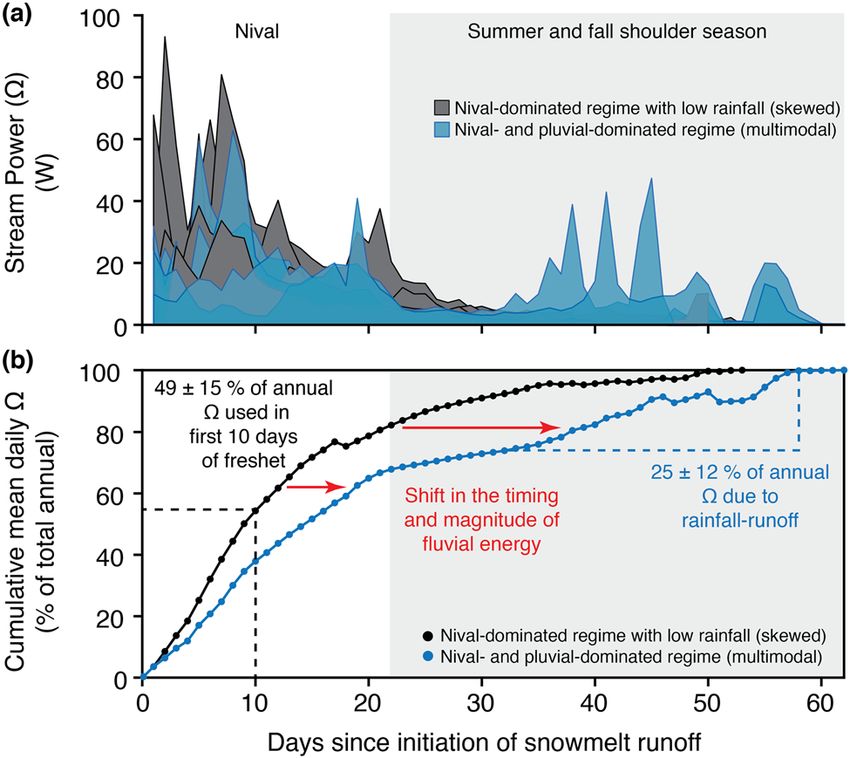
ARTICLE                                                                  NATURE COMMUNICATIONS | https://doi.org/10.1038/s41467-021-21759-3

D
          espite recent advances in our understanding of terrestrial-         snowmelt phase on material transfer. Our findings highlight the
          aquatic connectivity in permafrost-underlain watersheds1–3,         increasing importance of rainfall in driving connectivity along the
          few studies directly link the controls and changes in High          High Arctic terrestrial-aquatic continuum, providing a frame-
Arctic terrestrial-aquatic connectivity to climate warming-induced            work to improve earth system models and demonstrating why it
changes in hydrology1,3–6. As the Arctic warms and precipitation              is increasingly important for the research community to shift our
patterns change7,8, shifts in the timing and magnitude of fluvial              focus to capturing the late-fall shoulder season5.
energy (e.g., stream power) in response to rainfall inputs will alter
landscape connectivity in watersheds by increasing the late-season
delivery of organic (e.g., organic carbon; OC) and inorganic (e.g.,           Results and discussion
sediment, major ions) terrestrial materials into downstream aquatic           Shifting magnitude and distribution of fluvial energy. The
ecosystems9–11. The impacts of shifts in the timing and magnitude             primary control on Arctic hydrology is seasonal phase changes in
of fluvial energy coupled with terrestrial ecosystem changes are               water form and movement, characterized by a short summer flow
scarcely documented in these environments due to a lack of inte-              season between spring “break-up” (2–3 weeks following daily
grated longer-term (≥10 years) biogeochemical records12 and the               mean air temperatures consistently >0 °C) and fall “freeze-up”
remote nature of the High Arctic13. Accurate biogeochemical bud-              (daily mean air temperatures consistently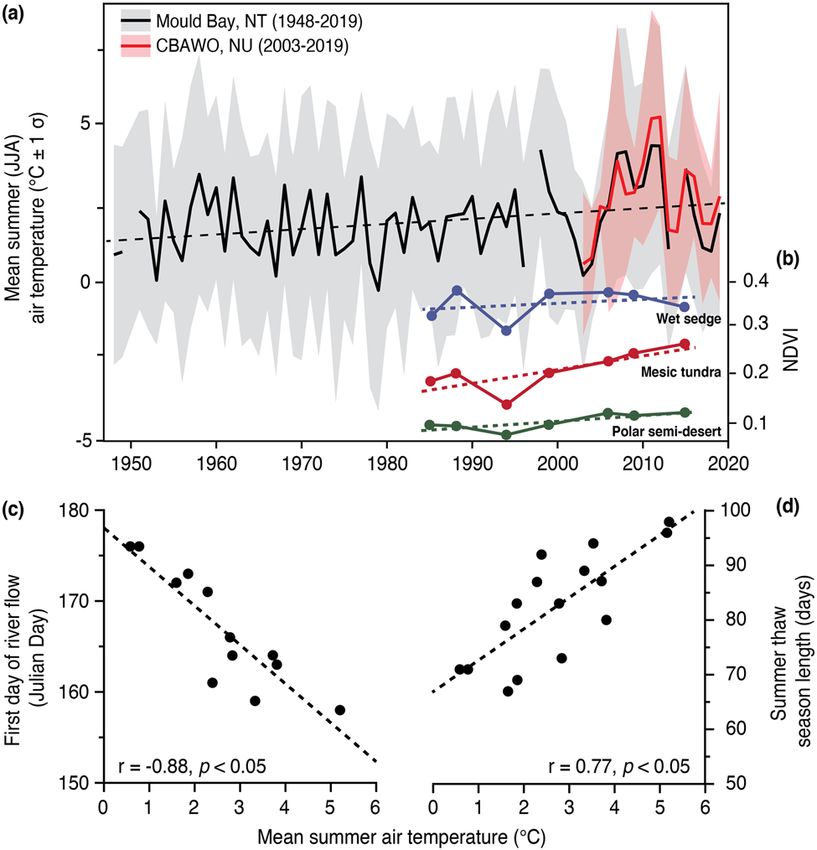
NATURE COMMUNICATIONS | https://doi.org/10.1038/s41467-021-21759-3                                                                      ARTICLE

Fig. 1 Hydrological energy budgets for small High Arctic streams. a Daily
stream power records for a small, non-glacial High Arctic stream at the
CBAWO (West river; 8 km2; 2003–2017) normalized to the first day of
nival runoff and separated into annual hydrological regimes; (1) nival-         Fig. 2 Regional hydrometeorology. a Local mean summer (Jun-Aug; JJA)
dominated regime with little-to-no hydrological response to summer/fall         air temperature for the CBAWO is significantly correlated (r = 0.99, p <
rainfall inputs (skewed distribution; black/gray; n = 8); and (2) nival- and    0.05); (2003–2019) with the longer-term mean summer air temperature at
pluvial-dominated hydrological regime (multimodal distribution; blue; n =       Mould Bay (1948–2019; 300 km west). Warming temperatures correlated
4). b Cumulative mean daily stream power (% of the total annual stream          with: (b) increased normalized difference vegetative index (NVDI) for all
power) for the same annual hydrological regimes. In all years, 49 ± 15% of      vegetation types at the CBAWO (modified from Edwards and Treitz, 2017);
the annual available stream power is expended in the first ten days of           (c) earlier first day of river flow and (d) an increase in the summer thaw
freshet and 74 ± 13 % is expended during the full nival period (22 ± 5 days).   season length (p < 0.05). Mould Bay data licensed under the Open
In warmer wetter years with proportionately more pluvial discharge (blue)       Government License – Canada.
we observe a transition in the timing and magnitude of fluvial energy to
later in the summer thaw season. In these years, pluvial runoff expended
25 ± 12% of the annual stream power budget during the summer and fall           Arctic received proportionately more rainfall in general (8.0 to
shoulder seasons. Baseflow periods had the lowest stream powers                  2.95 million km2 watersheds; Supplementary Figs. 6–8). In
expending 50% chance                   aquatic connectivity. Shifts in the timing and magnitude of
of exceedance in any given year); (ii) consecutive low-intensity                annual discharge patterns and stream power budgets are causing
rainfall (July 2007; ≤0.09–0.33 mm h−1,
ARTICLE NATURE COMMUNICATIONS | https://doi.org/10.1038/s41467-021-21759-3
Table 1 Mean ± SD proportions of annual flux from each hydrological period at the CBAWO.
Physically undisturbed headwater slope Physically disturbed headwater slope Main stems (WR and ER)
stream (GS) stream (PT)
Nival Base flow Pluvial Nival Base flow Pluvial Nival Base flow Pluvial
2005–2017a
SSC 74 ± 19% 19 ± 11% 8 ± 16% 67 ± 41% 2 ± 3% 14 ± 17% 84 ± 29% 1 ± 1% 24 ± 34%
POC 73 ± 21% 21 ± 12% 9 ± 16% 75 ± 34% 3 ± 3% 17 ± 20% 84 ± 29% 1 ± 1% 24 ± 34%
DOC 71 ± 19% 24 ± 15% 10 ± 12% 77 ± 27% 3 ± 6% 25 ± 28% 85 ± 17% 4 ± 2% 13 ± 18%
TDN 72 ± 18% 23 ± 14% 9 ± 10% 77 ± 26% 4 ± 9% 23 ± 24% 83 ± 18% 6 ± 4% 17 ± 16%
Major ions 69 ± 22% 28 ± 20% 7 ± 11% 67 ± 34% 9 ± 13% 28 ± 22% 76 ± 22% 8 ± 4% 28 ± 20%
Stream power 72 ± 17% 20 ± 17% 11 ± 5% 81 ± 17% 11 ± 8% 13 ± 10% 80 ± 17% 8 ± 8% 14 ± 12%
2007–2009, 2016
SSC 37 ± 1% 40 ± 14% 20 ± 17% 53 ± 2% 18 ± 13% 30 ± 11% 37 ± 30% 4 ± 6% 59 ± 33%
POC 35 ± 3% 47 ± 17% 16 ± 23% 52 ± 1% 18 ± 14% 30 ± 13% 37 ± 29% 4 ± 6% 59 ± 32%
DOC 41 ± 1% 46 ± 16% 13 ± 18% 40 ± 8% 11 ± 15% 50 ± 8% 63 ± 23% 6 ± 3% 32 ± 22%
TDN 40 ± 2% 48 ± 17% 11 ± 16% 41 ± 16% 14 ± 20% 45 ± 4% 58 ± 23% 12 ± 8% 30 ± 20%
Major ions 42 ± 2% 45 ± 16% 12 ± 15% 37 ± 12% 24 ± 7% 40 ± 5% 41 ± 11% 12 ± 7% 47 ± 10%
Stream power 48 ± 12% 33 ± 12% 19 ± 1% 44 ± 14% 25 ± 3% 31 ± 11% 59 ± 13% 9 ± 4% 32 ± 10%
We separate years with significant pluvial responses (2007–2009, 2016) from the remainder of the dataset (2005–2017) to show how shifts in the timing and magnitude of pluvial energy affect
proportions of annual flux during each hydrological period. Full flux data are available in the Supplementary Data.
aExcluding 2007–2009, 2016.
is sourced from surface runoff processes (e.g., terrestrial surface
materials, temporary channel stores)28. Conversely, pluvial runoff
couples the terrestrial-aquatic continuum at a time when: (i) the
seasonal active layer is deepening (mean JJA active layer depth
0.8 ± 0.3 m), increasing subsurface drainage connectivity6,30; and
(ii) vegetation productivity is at its peak, increasing above-ground
biomass and available organic material from modern terrestrial
vegetation31 (Fig. 3; Supplementary Fig. 3c). Given that the
potential for export of terrigenous material is higher during late
summer/fall, increased proportions of annual available stream
power expended during pluvial events disproportionately
increases the erosion and delivery of terrestrial material into the
downstream aquatic ecosystem9,10.
Optical DOM indices measured at the CBAWO support
increased levels of terrigenous DOM export during pluvial
responses compared to the nival and baseflow periods
(2012–2017; Fig. 4; Supplementary Figs. 9 and 10). In headwater
catchments, mean α350 values were highest during pluvial events
(Fig. 4d; Supplementary Fig. 9a); α350 values are correlated with
lignin phenols (unique biomarkers of vascular plants) and serve
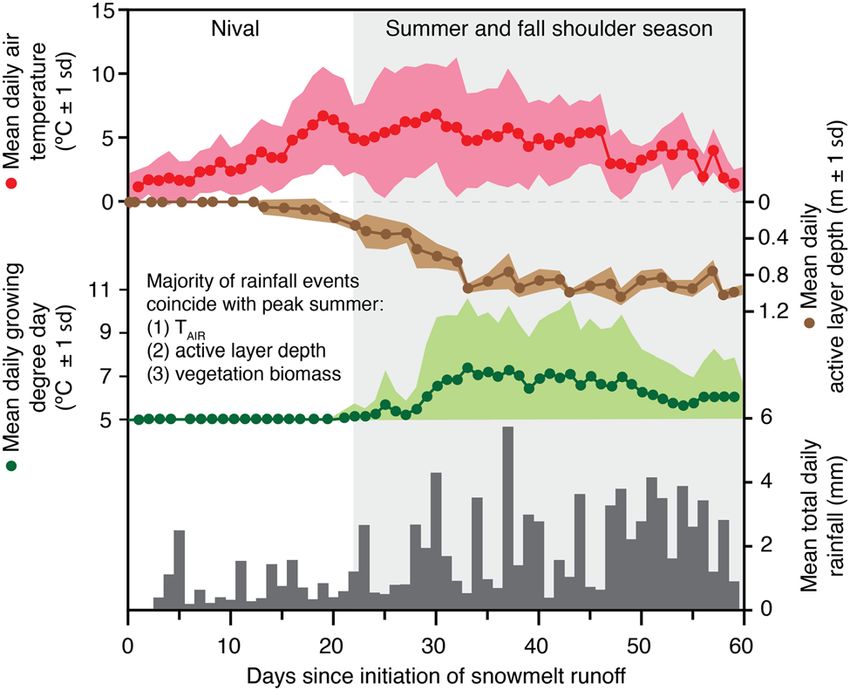
Fig. 3 Implications of the redistribution of fluvial energy across a as an indicator for terrigenous DOM32,33. Concurrent higher
lengthening summer thaw season in small High Arctic watersheds growing degree day (GDD; Fig. 3) and DOM freshness index
(10 km2) underlain by continuous permafrost. Daily mean (±1 SD) air (β:α) values during pluvial responses further support that this
temperature (2003–2019), active layer depth (2012–2019), growing degree DOM was recently-produced in the surrounding terrestrial
day (GDD; 2003–2019) and total daily rainfall (2003–2019) from the environment (Fig. 4e; Supplementary Fig. 9c). The lack of
CBAWO. A shift in higher stream powers to later in the summer/fall
vegetative productivity during the nival period, coupled with
shoulder season enhances the potential for terrestrial-aquatic connectivity lower potential for terrestrial interaction and lower DOM β:α
in response to rainfall inputs when annual summer air temperatures, active
values, indicate increased α350 values during nival periods
layer depths, and vegetation productivity are at their annual maximums. compared to baseflow are likely the result of mobilization of
terrigenous material from prior growing seasons.
season and (Fig. 1b), in turn, elevated potential for lateral Our results also indicate that the maximum pluvial stream
(terrestrial to stream channel) and longitudinal (upstream to power generated by varying rainfall magnitudes dictates whether
downstream) material fluxes along the watershed continuum due terrestrial-aquatic pathways export proportionately more dis-
to increased terrestrial-aquatic hydrological connectivity. The solved or particulate material. Low-intensity, short duration
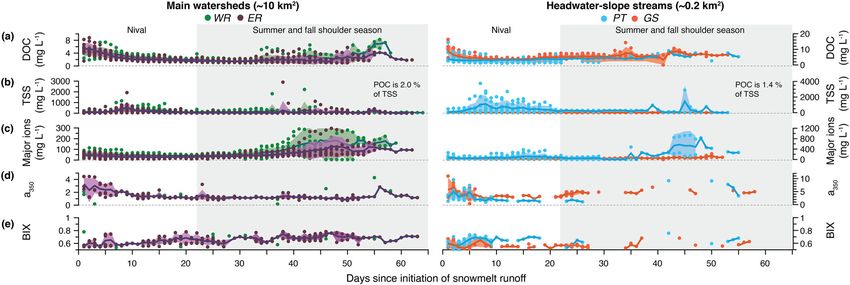
nival period, when the majority of stream power (76 ± 13% at our rainfall events with resultant stream powersNATURE COMMUNICATIONS | https://doi.org/10.1038/s41467-021-21759-3 ARTICLE Fig. 4 Mean daily biogeochemical records normalized to the first day of nival runoff and separated by watershed scale; main watersheds (~10 km2): West River (WR); East River (ER); and headwater-slope streams (~0.2 km2): Ptarmigan (PT); Goose (GS). (a) DOC concentration; (b) TSS concentration (note that POC is 1.4–2.0% of TSS in these systems); (c) major ions; (d) a350 values, which are an indicator of terrigenous DOM; and (e) BIX values which are an indicator of autochthonous DOM. events with resultant stream power >30 ± 9 W transfer primarily DOM input. As the hydrological season continues to lengthen particulate material (79 ± 19% of the total pluvial flux in 20 ± 2% and both air and river temperatures increase, in-stream of the active flow season). Spectral slope ratios (SR) of productivity and increased DOM processing during baseflow chromophoric DOM indicated that pluvial runoff from rainfall periods will also likely increase, further impacting C processing events with higher intensities, longer durations, and/or less potentials in this landscape38. frequent recurrence intervals led to higher average molecular Combined, our results show lower magnitude rainfall events weight DOM in the stream networks35 (Supplementary Fig. 11). are important mechanisms for supplying Arctic rivers with These patterns suggest that higher pluvial stream powers, dissolved and particulate terrestrial material9,34. However, the low exceeding a threshold of 30 ± 9 W, are necessary to: (i) initiate magnitude rainfall events are unable to overcome energy channel bank erosion in the upper watershed and (ii) connect thresholds needed to transport particulate material downstream terrestrial-aquatic pathways along the full watershed continuum to watershed outlets. This results in the temporary storage of for particulate terrigenous materials. It is important to note that particulate material within steam channels, where it can be the scale of pluvial responses was strongly controlled by processed and become available for microbial use during low antecedent conditions. For example, consecutive low-intensity, energy hydrological periods. When higher magnitude pluvial longer-duration rainfall events (30 W), particulate material from eroded channel banks and Baseflow periods had the lowest stream powers (0.05 ± 0.02 W disturbed hillslopes was directly coupled downstream with the in headwaters and 3.0 ± 2.2 W in main streams), with limited watershed outlet10,28. At this site, rainfall magnitudes great hydrological connectivity and terrestrial to aquatic material enough to produce runoff energy to overcome stream power flux9,10 (Supplementary Fig. 3b). Surface flow in headwater- thresholds only occur on an 8 to 100-year recurrence interval slope streams often rapidly ceased following snow exhaustion by (2–5 years) of these impacts remain relatively unknown. The within the stream network37 at a time when water temperatures paired watersheds in this study were impacted by localized ALDs are at their annual maximums (up to 18.2 °C locally). The in 2007–2008, disturbing 1.2–2.7% of the watersheds’ areal extent enhanced BIX values in the main streams were less evident when (Supplementary Fig. 1). The ALDs (100+) varied from small stream powers exceeded ~25 W, suggesting a threshold where hydrologically (dis)connected patches on headwater-slopes and autochthonous DOM production is reduced and/or the auto- along channel banks to long (>100 m) linear features that directly chthonous DOM signal is masked by increased allochthonous coupled with main watershed streams; prior to 2007 there was no NATURE COMMUNICATIONS | (2021)12:1448 | https://doi.org/10.1038/s41467-021-21759-3 | www.nature.com/naturecommunications 5
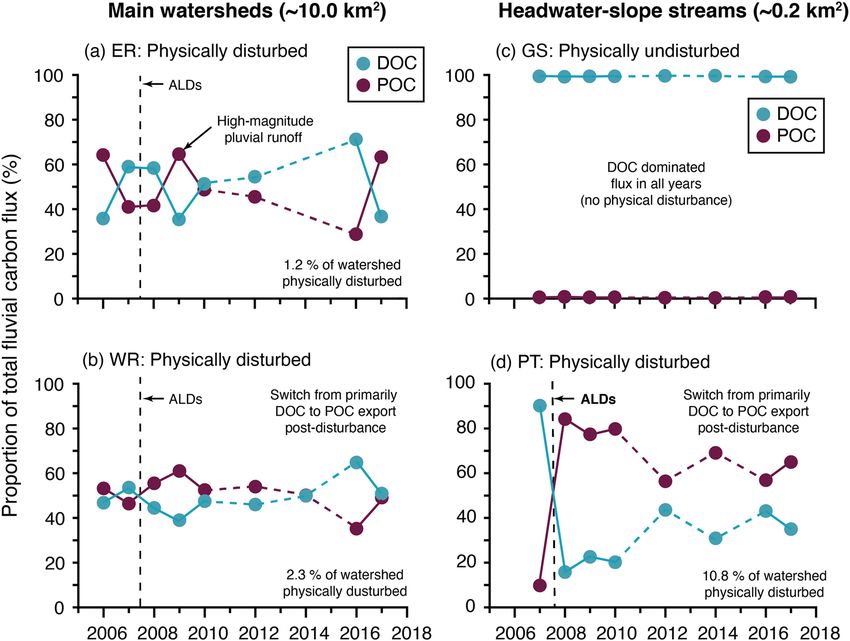
ARTICLE                                                                   NATURE COMMUNICATIONS | https://doi.org/10.1038/s41467-021-21759-3

Fig. 5 The impact of permafrost change on watershed carbon export. The impact of localized active layer detachments (ALDs; geomorphological
disturbance) on the relative contributions (%) of DOC and POC to the total annual fluvial C flux (2006-2017) in: (a) East river (ER; 1.2 % of watershed area
disturbed); (b) West river (WR; 2.7% of watershed area disturbed); (c) Goose stream (GS; no geomorphological disturbance); (d) Ptarmigan stream (PT;
10.8% of watershed area disturbed). In geomorphologically undisturbed watersheds (a), the annual C flux is dominated by DOC; increasing mean annual
DOC concentrations from these watersheds were likely the result of watershed greening. Thaw-induced geomorphological disturbance of terrestrial
surfaces (a–b,d) decreased annual DOC concentrations at all watershed scales and led to a fundamental shift in the primary form of C export from a DOC-
to a POC-dominated flux (p < 0.05), with the magnitude and persistence of impact increasing with areal extent of watershed disturbance.

evidence of recent terrestrial disturbance at the CBAWO. Given                 network48; and (iii) preferential sorption of available DOC to
that warming July-August temperatures are anticipated to                       newly exposed mineral soils49,50.
increase the initiation of permafrost disturbance in the High                     At all watershed scales the ALDs led to a shift in the primary
Arctic22, our data provide a unique opportunity to compare the                 form of C export from a DOC- to a POC-dominated flux, with
relative influence of changing hydrology versus permafrost thaw-                the magnitude and persistence of impact increasing with the areal
induced geomorphological disturbance on the terrestrial-aquatic                extent of watershed disturbance (Fig. 5). Our results show that
continuum in the decade following ALD formation (2007–2017).                   hydrologically-coupled ALDs need to physically disturb as little as
   We show that despite disturbances covering a relatively small               1.2–2.7% of the watershed area (≤12 km2) to trigger this change
areal extent (30 W in the main streams. Pluvial responses with less
phological disturbance from ALDs resulted in a decline in                      energy rapidly mobilize and exhaust temporary in-channel
interannual DOC concentrations at all watershed scales (Supple-                particulate stores28, but are an important mechanism resupplying
mentary Fig. 12). This was likely due to a combination of: (i) the             channel stores with newly mobilized/eroded terrestrial material9.
geomorphological evolution and stabilization of internal channels              This suggests that, at the watershed-scale, the effect of thaw-
within ALDs9, (ii) enhanced DOC processing within the stream                   induced geomorphological disturbance on particulate material

6                  NATURE COMMUNICATIONS | (2021)12:1448 | https://doi.org/10.1038/s41467-021-21759-3 | www.nature.com/naturecommunications
NATURE COMMUNICATIONS | https://doi.org/10.1038/s41467-021-21759-3                                                                              ARTICLE

export is smaller than the shift toward a multimodal hydrological               and play a minor to negligible role in the mineralization of ter-
regime in this environment. Furthermore, disturbed sites are                    restrial C57.
more vulnerable to rain-induced surface thaw51, which could                        In this study, we found evidence of shifts in timing of fluvial
further accelerate the additional release of terrestrial materials              energy from a skewed to a multimodal distribution in both large
following future rainfall. Hence, we conclude terrestrial dis-                  and small circum-arctic watersheds, which aligns with global
turbance primes Arctic watersheds for accelerated geomorpholo-                  climate model projections of amplified Arctic warming, decreased
gical change when future rainfall magnitudes and consequent                     winter precipitation, and increased magnitude and frequency of
pluvial responses exceed the current buffering capacity of the                  summer rainfall7,8. Given that the seasonality of Arctic hydrology
terrestrial-aquatic continuum (30 ± 9 W).                                       is closely linked to regional weather, we can expect the timing and
   In watersheds with a terrestrial disturbance area
ARTICLE                                                                               NATURE COMMUNICATIONS | https://doi.org/10.1038/s41467-021-21759-3

antecedent soil moisture conditions. Surface runoff in the upper ER watershed              7.    Bintanja, R. The impact of Arctic warming on increased rainfall. Sci. Rep. 8,
occurs as diffuse flow over vegetated water tracks, hydrologically connecting ponds               16001 (2018).
along the terrestrial-aquatic continuum. Water tracks in the WR watershed are              8.    Bintanja, R. & Andry, O. Towards a rain-dominated Arctic. Nat. Clim. Change
limited to headwater-slope inputs, with the majority of runoff in channelized gravel             7, 263–267 (2017).
bed streams.                                                                               9.    Beel, C. R. et al. Differential impact of thermal and physical permafrost
   Instrumentation, datalogger, and analytical method specifications are docu-                    disturbance on High Arctic dissolved and particulate fluvial fluxes. Sci. Rep.
mented in the Supplementary Methods and Supplementary Table 2. For coherence                     10, 11836 (2020).
among records and to provide the finest temporal resolution across all years, we            10.   Beel, C. R., Lamoureux, S. F., Orwin, J. F. Fluvial response to a period of
reprocessed all variables from raw data into daily means. To normalize hydro-                    hydrometeorological change and landscape disturbance in the Canadian High
logical seasons irrespective of interannual variation in hydrometeorological con-                Arctic. Geophys. Res. Lett., 45 https://doi.org/10.1029/2018GL079660 (2018).
ditions, we temporally normalized data to the first day of flow instead of calendar          11.   Coch, C. et al. Summer rainfall, dissolved organic carbon, solute, and sediment
dates. All statistical analyses were conducted in Matlab versions R2016a and 2020a               fluxes in a small Arctic coastal catchment on Herschel Island (Yukon
software. Correlations were calculated using Pearson’s r linear correlation coeffi-               Territory, Canada). Arct. Sci. 4, 750–780 (2018).
cients (Supplementary Tables 3-6). Differences between variables: (i) between              12.   Laudon, H. et al. Save northern high-latitude catchments. Nat. Geosci. 10,
watersheds and (ii) between hydrological periods were determined using a com-                    324–325 (2017).
bination of ANOVA analyses (Supplementary Table 7) and two-samples t tests
                                                                                           13.   Metcalfe, D. B. et al. Patchy field sampling biases understanding of climate
(Supplementary Figs. 9–10). Differences in annual stream power distributions were
                                                                                                 change impacts across the Arctic. Nat. Ecol. Evol. 2, 1443–1448 (2018).
tested using two-sample Kolmogorov–Smirnov tests (Supplementary Table 8).
                                                                                           14.   Schuur, E. A. G. et al. Climate change and the permafrost carbon feedback.
Results from all statistical analyses were considered significant at the α = 0.05 level
                                                                                                 Nature 520, 171–179 (2015).
when p < 0.05.
   Daily JJA active layer depths (Fig. 3) were estimated using ground temperature          15.   Kicklighter, D. W. et al. Insights and issues with simulating terrestrial DOC
data collected between 2012–2019 from a 7-m borehole (Supplementary Fig. 1a).                    loading of Arctic river networks. Ecol. Appl. 23, 1817–1836 (2013).
Daily active layer depth estimates were calculated using a linear regression of            16.   Heslop, J. K., et al. Diverging pond dissolved organic matter characteristics
temperatures recorded at 0.3 m and 1.3 m depth, with the depth at which the                      yield similar CO2 flux potentials in a disturbed High Arctic landscape.
temperature was 0 °C being the assumed thaw boundary. This method assumed                        Environ. Res. Lett. https://doi.org/10.1088/1748-9326/abc913 (2020).
linear decreases in ground temperature within the 1.3 m depth range. Actual active         17.   Hobbie, J. E. et al. Ecosystem responses to climate change at a Low Arctic and
layer depths may vary with local soil moisture and ice content conditions; however,              a High Arctic long-term research site. Ambio 46, S160–S173 (2017).
values estimated using linear regression (0.0–1.20 m during JJA) were consistent           18.   Guo, L., Ping, C. L. & Macdonald, R. W. Mobilization pathways of organic
with mean seasonal maximum active layer depths manually measured using a                         carbon from permafrost to arctic rivers in a changing climate. Geophys. Res.
probe (0.7–1.1 m spatially across both watersheds). Growing degree days (GDD)                    Lett. 34, 13 (2007).
were calculated as:                                                                        19.   Judd, K. E. & Kling, G. W. Production and export of dissolved C in arctic
                                                                                                 tundra mesocosms: the roles of vegetation and water flow. Biogeochem 60,
                            GDD ¼ Tmax þ Tmin 2  Tbase                             ð1Þ          213–234 (2002).
where Tmax and Tmin are the daily maximum and minimum temperatures,                        20.   Turetsky, M. R. et al. Carbon release through abrupt permafrost thaw. Nat.
respectively, and Tbase is the base temperature representative of the threshold                  Geosci. 13, 138–143 (2020).
temperature above which plants are productive (≥ 5 °C).                                    21.   Farquharson, L. et al. Climate Change Drives Widespread and Rapid
   Stream power represents the rate of energy expenditure along a riverbed and                   Thermokarst Development in Very Cold Permafrost in the Canadian High
banks:                                                                                           Arctic. Geophys. Res. Lett. 46, 6681–6689 (2019).
                                                                                           22.   Lewkowicz, A. G. & Way, R. G. Extremes of summer climate trigger thousands
                                      Ω ¼ ρgQs                                      ð2Þ          of thermokarst landslides in a High Arctic environment. Nat. Commun. 10,
where stream power (Ω; Watts or kg m−2 s−3) is the product of water density                      1329 (2019).
calculated from measured water temperatures (ρ; kg m−3), acceleration due to               23.   Rodenhizer, H. et al. Carbon thaw rate doubles when accounting for subsidence
gravity (g; 9.8 m s−2), discharge (Q; m3 s−1), and channel slope (s). We applied a 5             in a permafrost warming experiment. JGR Biogeosci. 125, e2019JG005528 (2020).
m buffer on either side of the middle of the channel in ArcGIS® to represent the           24.   Rudy, A. C. A., Lamoureux, S. F., Kokelj, S. V., Smith, I. R. & England, J. H.
channel area, from which the watershed’s average slope was calculated (Supple-                   Accelerating thermokarst transforms ice-cored terrain triggering a
mentary Table 1).                                                                                downstream cascade to the ocean. Geophys. Res. Lett. 44, 11080–11087 (2017).
                                                                                           25.   Abbott, B. W., Jones, J. B., Godsey, S. E., Larouche, J. R. & Bowden, W. B.
                                                                                                 Patterns and persistence of hydrologic carbon and nutrient export from
Data availability                                                                                collapsing upland permafrost. Biogeosciences 12, 3725–3740 (2015).
Discharge, stream power, DOM optical data, SS, DOC, POC, major ions, and DIN are
                                                                                           26.   Olsson, P. et al. Five stages of the alaskan arctic cold season with ecosystem
available in the Supplementary Information. Climate, SS, and Q data for the main
                                                                                                 implications. Arct., Antarct., Alp. Res. 35, 74–81 (2003).
watersheds are available as Supplementary Information in Beel et al. (2018). Q, SS, POC,
                                                                                           27.   Woo, M. Permafrost Hydrology. ISBN 978-3-642-23462-0
DOC, and major ions from headwater-slope streams are available as Supplementary
                                                                                           28.   Favaro, E. & Lamoureux, S. F. Downstream patterns of suspended sediment
Information in Beel et al. (2020). This data is also available through the Polar Data
                                                                                                 transport in a High Arctic river influenced by permafrost disturbance and
Catalog (www.polardata.ca).
                                                                                                 recent climate change. Geomorph 246, 359–369 (2015).
                                                                                           29.   Chorley, R. J. and Kennedy, B. A. Physical geography: a systems approach.
Received: 11 September 2020; Accepted: 10 February 2021;                                         London (Prentice‐Hall International), Pp. 370 (1971).
                                                                                           30.   Keller, K., Blum, J. D. & Kling, G. W. Stream geochemistry as an indicator of
                                                                                                 increasing permafrost thaw depth in an arctic watershed. Chem. Geol. 273,
                                                                                                 76–81 (2010).
                                                                                           31.   Elmendorf, S. C. et al. Plot-scale evidence of tundra vegetation change and
                                                                                                 links to recent summer warming. Nat. Clim. Change 2, 453–457 (2012).
                                                                                           32.   Spencer, R. G. M. et al. Dissolved organic carbon and chromophoric dissolved
References
                                                                                                 organic matter properties of rivers in the USA. J. Geophys. Res. 117, G03001
1.   Tank, S. E. et al. Landscape matters: predicting the biogeochemical effects of
     permafrost thaw on aquatic networks with a state factor approach. Perma.                    (2012).
                                                                                           33.   Mann, P. J. et al. Pan-Arctic trends in terrestrial dissolved organic matter from
     Periglac. Process. 31, 358–370 (2020).
                                                                                                 optical measurements. Front. Earth. Sci. 4, 25 (2016).
2.   Vonk, J. E., Tank, S. E. & Walvoord, M. A. Integrating hydrology and
                                                                                           34.   Doyle, M. W. et al. Effective discharge analysis of ecological processes in
     biogeochemistry across frozen landscapes. Nat. Comm. 10, 5377 (2019).
3.   Tank, S. E., Fellman, J. B., Hood, E. & Kritzberg, E. S. Beyond respiration:                streams. Water Resour. Res. 41, 16 (2005).
                                                                                           35.   Helms, J. R. et al. Absorption spectral slopes and slope ratios as indicators of
     controls on lateral carbon fluxes across the terrestrial-aquatic interface.
                                                                                                 molecular weight, source, and photobleaching of chromophoric dissolved
     Limnol. Oceanogr. Lett. 3, 76–88 (2018).
                                                                                                 organic matter. Limnol. Oceanogr. 53, 955–969 (2008).
4.   Juhls, B. et al. Identifying drivers of seasonality in Lena River biogeochemistry
                                                                                           36.   Huguet, A. et al. Properties of fluorescent dissolved organic matter in the
     and dissolved organic matter fluxes. Front. Environ. Sci. 8, 53 (2020).
5.   Shogren, A. J., Zarnestke, J. P., Abbott, B. W., Lannucci, F., Bowden, W. B. We             Gironde Estuary. Org. Geochem. 40, 706–719 (2008).
                                                                                           37.   Wauthy, M. & Rautio, M. Permafrost thaw stimulates primary producers but
     cannot shrug off the shoulder seasons: addressing knowledge and data gaps in
                                                                                                 has a moderate effect on primary consumers in subarctic ponds. Ecosphere 11,
     an Arctic Headwater. Environ. Res. Lett., in press, https://doi.org/10.1088/
                                                                                                 e03099 (2020).
     1748-9326/ab9d3c (2020).
6.   Frey, K. E. & McClelland, J. W. Impacts of permafrost degradation on arctic           38.   Cole, J. J. et al. Plumbing the global carbon cycle: integrating inland waters
                                                                                                 into the terrestrial carbon budget. Ecosystems, 10, 172–175 (2007).
     river biogeochemistry. Hydrol. Process. 23, 169–182 (2009).

8                      NATURE COMMUNICATIONS | (2021)12:1448 | https://doi.org/10.1038/s41467-021-21759-3 | www.nature.com/naturecommunications
NATURE COMMUNICATIONS | https://doi.org/10.1038/s41467-021-21759-3 ARTICLE
39. Olefeldt, D. et al. Circumpolar distribution and carbon storage of thermokarst 59. Spencer, R. G. M. et al. Seasonal and spatial variability in dissolved organic
landscapes. Nat. Comm. 7, 13043 (2016). matter quantity and composition from the Yukon River basin. Alsk. Glob.
40. Edwards, R. & Treitz, P. Vegetation greening trends at two sites in the Biogeochem. 22, GB4002 (2008).
Canadian Arctic: 1984-2015. Arct., Antarct. Alp. Res 49, 601–619 (2017). 60. Neumann, R. B. et al. Warming effects of spring rainfall increase methane
41. Arndt, K. A. et al. Arctic greening associated with lengthening growing emissions from thawing permafrost. Geophys. Res. Lett. 46, 1393–1401 (2019).
seasons in Northern Alaska. Environ. Res. Lett. 14, 125018 (2019).
42. O’Donnell, J. A. et al. DOM composition and transformation in boreal forest
soils: The effects of temperature and organic‐horizon decomposition state. J. Acknowledgements
Geophys. Res. 121, 2727–2744 (2016). We thank: past and present members of the CBAWO team for assisting in data col-
43. Bjorkman, A. D. et al. Status and trends in Arctic vegetation: evidence from lection; S. Liebner, S. Tank, and M. Turetsky for pre-submission feedback on an earlier
experimental warming and long-term monitoring. Ambio 49, 678–692 (2020). version of this manuscript. Financial support was provided by ArcticNet, Government of
44. Myers-Smith, I. H. et al. Complexity revealed in the greening of the Arctic. Canada International Polar Year (IPY) and Natural Resources and Engineering Council
Nat. Clim. Change 10, 106–117 (2020). (NSERC) grants to S.F.L. and M.J.L. Field logistics were provided by the Polar Con-
45. Frost, G. V. et al. Tundra greenness. Arctic Report Card 2019. Richter-Menge, tinental Shelf Program (PCSP), Natural Resources Canada. We thank the Hamlet of
J., Druckenmiller, M. L., and Jeffries, M., eds., http://www.arctic.noaa.gov/ Resolute for their permission and support for conducting research at the CBAWO.
Report-Card (2019).
46. Semenchuk, P. R. et al. High Arctic plant phenology is determined by Author contributions
snowmelt patterns but duration of phenological periods is fixed: an example of C.R.B. and J.K.H. designed the study, led data analyses and syntheses, and wrote the
periodicity. Environ. Res. Lett., 11, 125006 (2016). manuscript. S.F.L., J.F.O., and M.A.P. contributed to study design and data analyses. S.F.
47. Bjorkman, A. D., Elmendorf, S. C., Beamish, A. L., Vellend, M. & Henry, G. H. L. and M.J.L. led hydrological and biogeochemical data collection. A.J.S. led major ion
R. Contrasting effects of warming and increased snowfall on Arctic tundra and nitrogen analyses and synthesis. J.K.Y.H. led the GDD analyses and synthesis. All
plant phenology over the past two decades. Glob. Change Biol. 21, 4651–4661 authors commented on the analysis, interpretation and presentation of the data.
(2015).
48. Drake, T. W. et al. The ephemeral signature of permafrost carbon in an Arctic
fluvial network. JGR Biogeosci. 123, 1475–1485 (2018). Competing interests
49. Littlefair, C. A., Tank, S. E. & Kokelj, S. V. Retrogressive thaw slumps temper The authors declare no competing interests.
dissolved organic carbon delivery to streams of the Peel Plateau, NWT,
Canada. Biogeosciences 14, 5487–5505 (2017).
50. Kalbitz, K., Schwesig, D., Rethemeyer, J. & Matzner, E. Stabilization of
Additional information
Supplementary information The online version contains supplementary material
dissolved organic matter by sorption to the mineral soil. Soil Biol. Biochem. 37,
available at https://doi.org/10.1038/s41467-021-21759-3.
1319–1331 (2005).
51. Douglas, T. A., Turetsky, M. R. & Koven, C. D. Increased rainfall stimulates
Correspondence and requests for materials should be addressed to C.R.B.
permafrost thaw across a variety of interior Alaskan boreal ecosystems. Npj
Clim. Atmos. Sci. 3, 28 (2020).
Reprints and permission information is available at http://www.nature.com/reprints
52. Shakil, S. et al. Particulate dominance of organic carbon mobilization from
thaw slumps on the Peel Plateau, NT: quantification and implications for
Publisher’s note Springer Nature remains neutral with regard to jurisdictional claims in
stream systems and permafrost carbon release. Environ. Res. Lett. 15, 114019
published maps and institutional affiliations.
(2020).
53. Walter Anthony, K. et al. 21st-century modeled permafrost carbon emissions
accelerated by abrupt thaw beneath lakes. Nat. Comm. 9, 3262 (2018).
54. Bowden, W. B. et al. Sediment and nutrient delivery from thermokarst Open Access This article is licensed under a Creative Commons
features in the foothills of the North Slope, Alaska: potential impacts on Attribution 4.0 International License, which permits use, sharing,
headwater stream ecosystems. J. Geophys. Res. 113, G02026 (2008). adaptation, distribution and reproduction in any medium or format, as long as you give
55. French, D. W. et al. Headwater catchments govern biogeochemistry in appropriate credit to the original author(s) and the source, provide a link to the Creative
america’s largest free‐flowing river network. JGR-Biogeosci. 125, Commons license, and indicate if changes were made. The images or other third party
e2020JG005851 (2020). material in this article are included in the article’s Creative Commons license, unless
56. Raymond, P. A., Saiers, J. E. & Sobczak, W. V. Hydrological and indicated otherwise in a credit line to the material. If material is not included in the
biogeochemical controls on watershed dissolved organic matter transport: article’s Creative Commons license and your intended use is not permitted by statutory
pulse‐shunt concept. Ecology 97, 5–16 (2016). regulation or exceeds the permitted use, you will need to obtain permission directly from
57. Bogard, M. J. et al. Negligible cycling of terrestrial carbon in many lakes of the the copyright holder. To view a copy of this license, visit http://creativecommons.org/
arid circumpolar landscape. Nat. Geosci. 12, 180–185 (2019). licenses/by/4.0/.
58. Holmes, R. M. et al. Seasonal and annual fluxes of nutrients and organic
matter from large rivers to the Arctic Ocean and surrounding seas. Estuar.
Coasts 35, 369–382 (2012). © Crown 2021
NATURE COMMUNICATIONS | (2021)12:1448 | https://doi.org/10.1038/s41467-021-21759-3 | www.nature.com/naturecommunications 9You can also read